Core Sector Growth Slows to 0.5% in May 2026: What the Eight Core Industries Signal
Why in News?
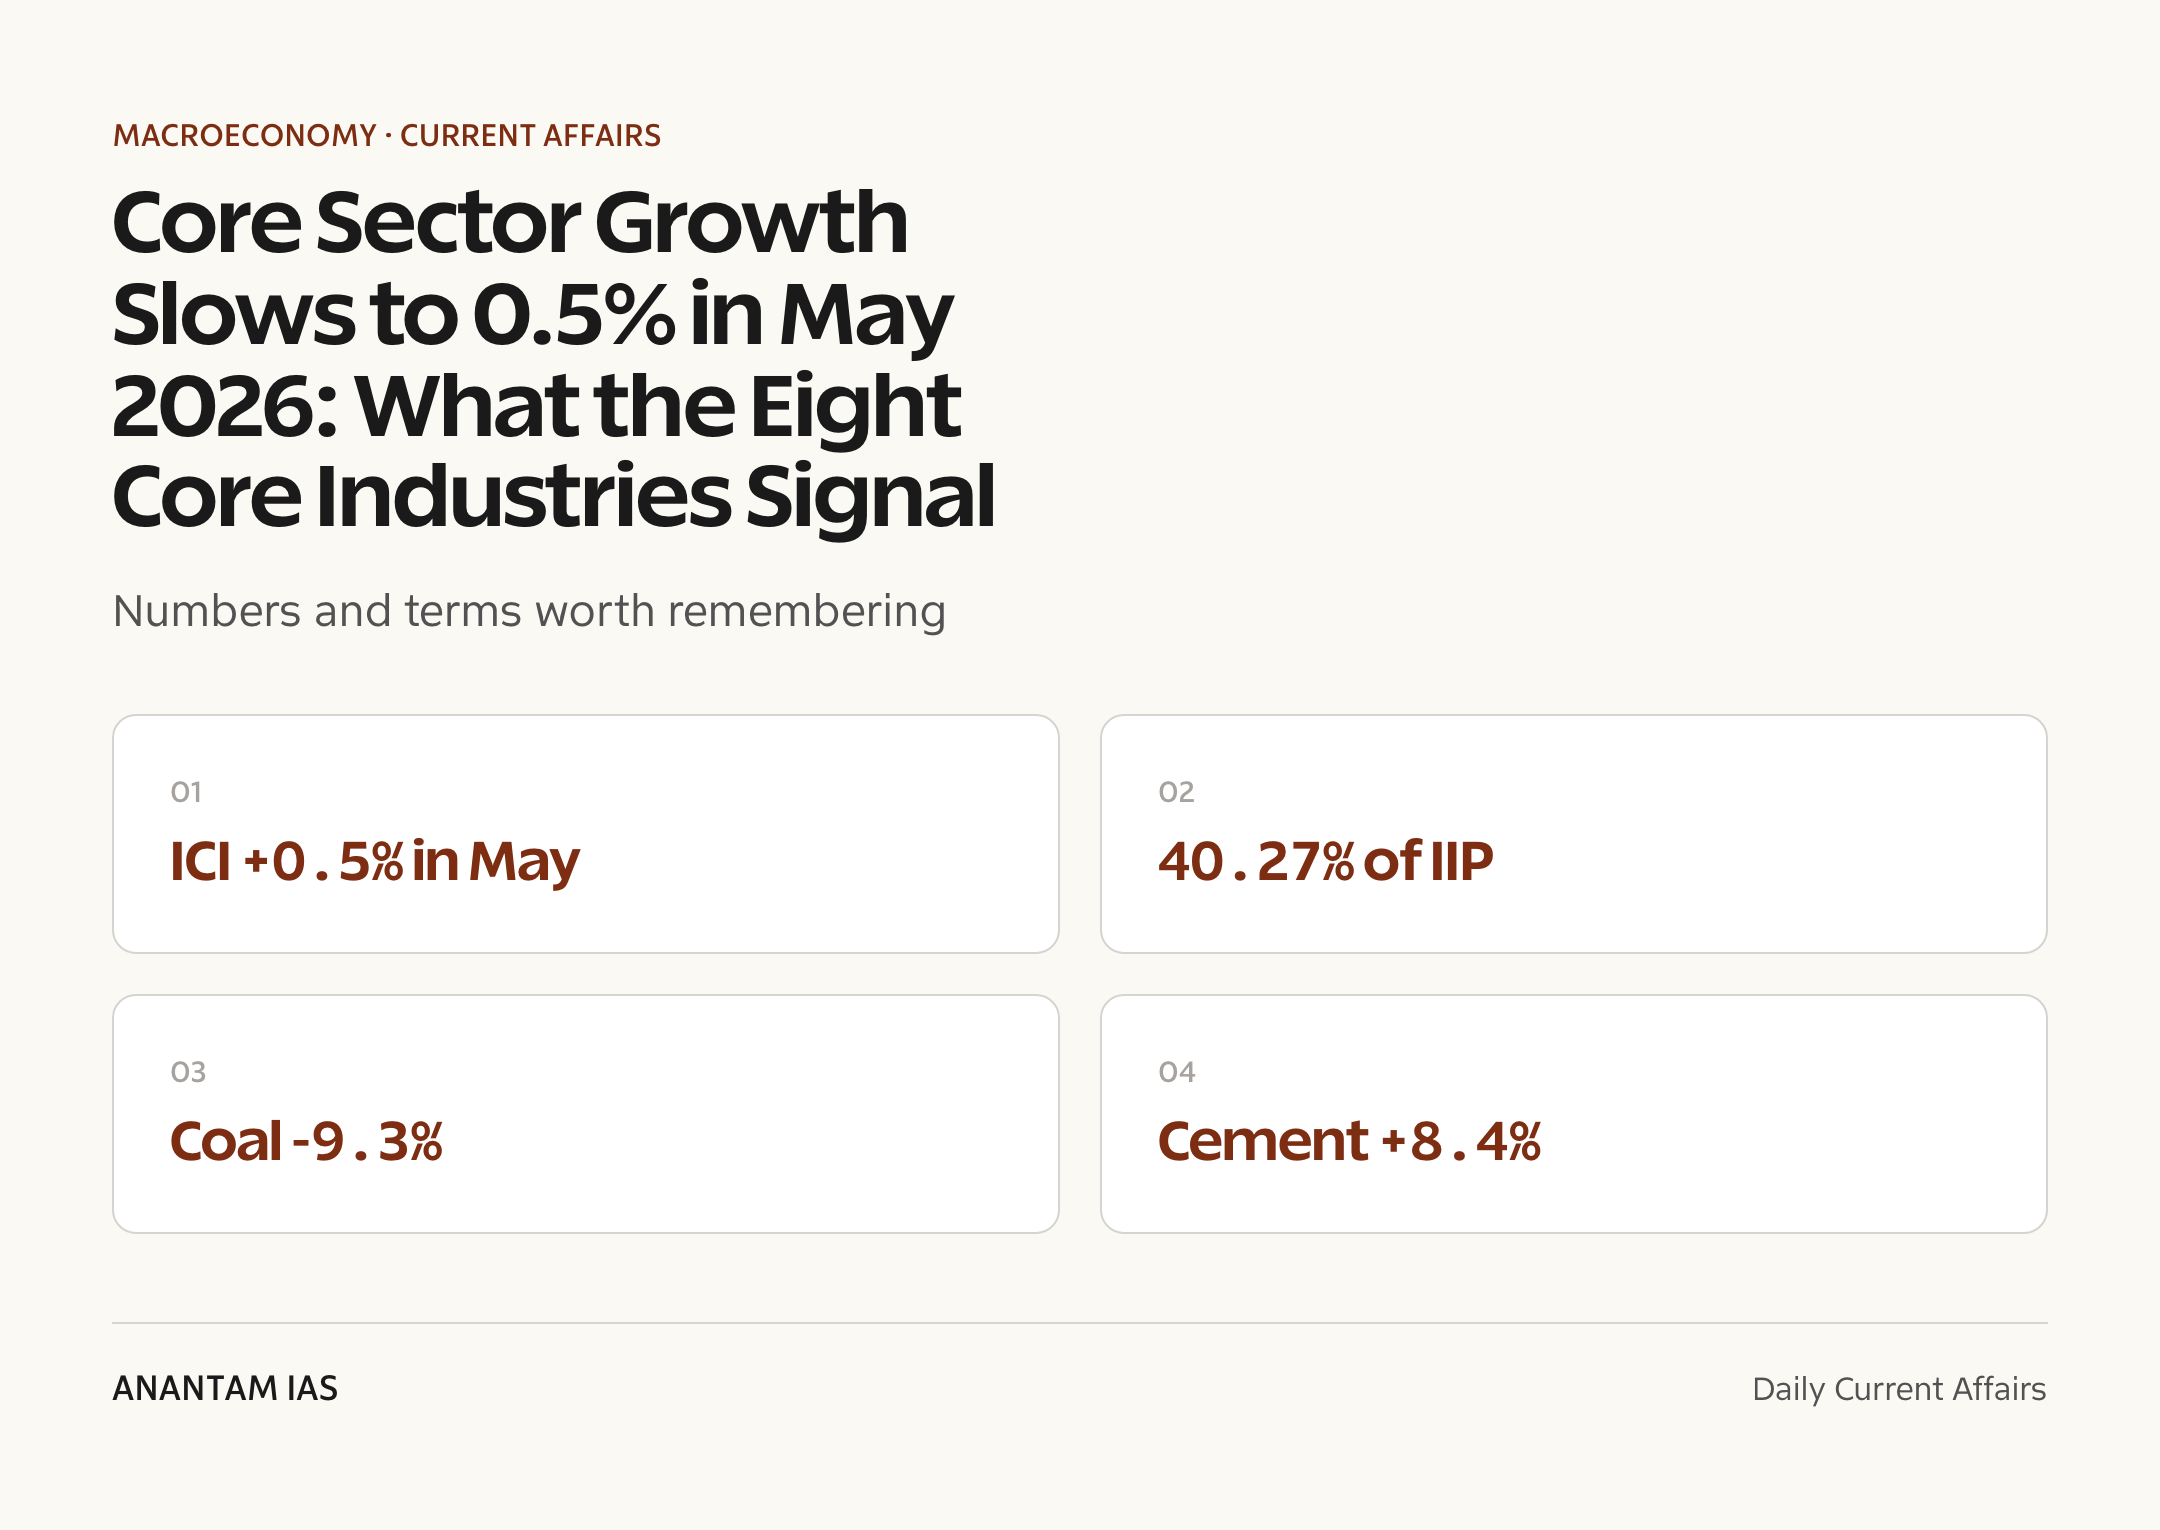
The Index of Eight Core Industries (ICI) grew only 0.5% year-on-year in May 2026, the slowest pace in seven months, according to data released by the Department for Promotion of Industry and Internal Trade (DPIIT). The reading marks a sharp deceleration from the 1.8% recorded in April 2026 and signals weakening industrial momentum at the start of the fiscal year.
The drag came almost entirely from the energy block. Coal, crude oil, natural gas and refinery products all contracted, offsetting strong gains in cement, electricity and steel. Since the ICI accounts for 40.27% of the Index of Industrial Production, the soft print is a leading warning sign for the broader IIP number due later.
- ICI rose 0.5% in May 2026 versus 1.8% in April 2026 — a seven-month low.
- Four of eight sectors contracted: coal (-9.3%), natural gas (-4.9%), refinery products (-8.7%), crude oil (-4.6%).
- Cement (+8.4%), electricity (+8.7%) and steel (+5.0%) were the bright spots.
- Cumulative growth for April-May FY27 stood at 1.1%, matching the year-ago period.
- ICI is a key lead indicator feeding the Index of Industrial Production (IIP).
The development matters in the context of:
- The ICI is compiled and released monthly by the Office of the Economic Adviser, DPIIT, with a roughly six-week lag.
- The current base year for the index is 2011-12 = 100.
- May data typically captures pre-monsoon construction and peak summer power demand, which lifted cement and electricity this year.
UPSC Relevance
Prelims Relevance
- ICI covers eight industries: coal, crude oil, natural gas, refinery products, fertilizers, steel, cement, electricity.
- Combined ICI weight in IIP = 40.27% — the single largest component group.
- Largest individual weight: refinery products (28.04%); smallest: fertilizers (2.63%).
- Base year of both ICI and IIP is currently 2011-12.
- ICI is released by DPIIT (Ministry of Commerce and Industry), not by the RBI or NSO.
- IIP is released by the National Statistical Office (NSO), Ministry of Statistics and Programme Implementation.
- ICI acts as a lead indicator for IIP because it is published earlier.
- Sector weight order: Refinery 28.04 > Electricity 19.85 > Steel 17.92 > Coal 10.33 > Crude Oil 8.98 > Natural Gas 6.88 > Cement 5.37 > Fertilizers 2.63.
- A reading near zero indicates near-flat infrastructure output, not contraction.
Mains Relevance
GS Paper 3
- Use ICI trends to discuss the health of India’s infrastructure and industrial sector and the drivers of industrial growth.
- Energy-block contraction (coal, oil, gas) links to questions on energy security, import dependence and the transition away from fossil fuels.
- Divergence between energy and construction materials illustrates the role of government capital expenditure in sustaining demand for steel and cement.
- Reliance on lead indicators like ICI underscores the importance of timely, credible official statistics for evidence-based policy.
Background and Context
What the Index of Eight Core Industries measures
The ICI tracks the combined and individual production performance of eight foundational industries that supply the rest of the economy.
- Released monthly by the Office of the Economic Adviser, DPIIT, Ministry of Commerce and Industry.
- Current base year is 2011-12 = 100, the same base as the IIP.
- The eight industries are coal, crude oil, natural gas, refinery products, fertilizers, steel, cement and electricity.
- These are upstream sectors — their output feeds construction, manufacturing, transport and power generation across the economy.
The eight industries and their weights
Each industry carries a fixed weight in the index, so a few large sectors dominate the headline number.
- Refinery products — 28.04%: the single largest component.
- Electricity — 19.85% and steel — 17.92%: the next two heavyweights.
- Coal — 10.33%, crude oil — 8.98%, natural gas — 6.88%.
- Cement — 5.37% and fertilizers — 2.63%: the smallest weights.
- Because refinery, electricity and steel together exceed 65% of the index, swings in these three move the headline most.
How ICI feeds the IIP
The core sector is the backbone of the broader industrial production measure, which is why it is watched as an early signal.
- The eight core industries together carry a weight of 40.27% in the Index of Industrial Production (IIP).
- IIP itself is released by the National Statistical Office (NSO) and covers mining, manufacturing and electricity.
- ICI is published roughly two weeks before the IIP, making it a reliable lead indicator of the larger number.
- A weak core print, as in May 2026, often foreshadows a subdued IIP reading for the same month.
What May 2026 data shows
Growth slowed to 0.5%, the weakest in seven months, as the energy block dragged while construction materials held up.
- Contractions: coal -9.3%, refinery products -8.7%, natural gas -4.9%, crude oil -4.6%, and fertilizers -0.9%.
- Expansions: electricity +8.7%, cement +8.4% and steel +5.0%.
- Headline cooled from 1.8% in April 2026 to 0.5% in May 2026.
- Cumulative April-May FY27 growth was 1.1%, level with the same two months a year earlier.
Why the energy block weakened
The contraction in fossil-fuel output reflects both base effects and structural shifts in India’s energy mix.
- Coal output fell as high stockpiles at thermal plants and softer demand reduced fresh mining.
- Crude oil and natural gas continue to face declining yields from ageing domestic fields, keeping India import-dependent.
- Refinery products dipped on maintenance shutdowns and weaker fuel demand growth.
- Strong electricity growth was met increasingly by renewables, easing pressure on coal-fired generation.
Way Forward
Strengthen domestic energy supply
- Arrest the decline in crude oil and natural gas output through enhanced recovery and new exploration under reformed licensing.
- Balance coal rationalisation with reliable thermal supply during peak demand to avoid power stress.
Sustain construction momentum
- Maintain public capital expenditure on roads, housing and railways to keep steel and cement demand firm.
- Crowd in private investment so industrial growth does not rest on government spending alone.
Track ICI alongside other lead indicators (GST collections, PMI, e-way bills) for a fuller read on industrial momentum.
Accelerate the long-pending base-year revision of ICI and IIP to better capture the current economic structure.
Conclusion
A 0.5% core-sector print is not contraction, but it is a clear loss of momentum that warns of a soft IIP reading for May. The split picture — falling energy output against rising cement, steel and power — captures an economy where government-backed construction is doing the heavy lifting while domestic fossil-fuel production keeps shrinking.
For policymakers, the message is twofold: shore up domestic energy supply and keep capital expenditure flowing until private investment broadens the base of industrial growth. For aspirants, the ICI remains a compact, high-yield lens on the real economy and a dependable early signal of where industrial output is headed.
UPSC Practice Questions
Prelims MCQ 1
With reference to the Index of Eight Core Industries (ICI), consider the following statements:
- It is compiled and released monthly by the Reserve Bank of India.
- The eight core industries together account for about 40.27% of the Index of Industrial Production.
- Refinery products carry the largest weight among the eight industries.
How many of the above statements are correct?
Only one Only two All three None
Answer: Only two
Explanation:
Statement 1 is incorrect: the ICI is released by the Office of the Economic Adviser, DPIIT (Ministry of Commerce and Industry), not the RBI. Statement 2 is correct: the eight core industries carry a combined weight of 40.27% in the IIP. Statement 3 is correct: refinery products, at 28.04%, have the largest individual weight.
Prelims MCQ 2
In the Index of Eight Core Industries, which of the following industries carries the smallest weight?
Cement Fertilizers Natural gas Crude oil
Answer: Fertilizers
Explanation:
Fertilizers carry the smallest weight in the ICI at 2.63%, below cement (5.37%), natural gas (6.88%) and crude oil (8.98%). Refinery products carry the largest weight at 28.04%.
UPSC Mains Questions
- The Index of Eight Core Industries is often described as a lead indicator of industrial output. Examine how its composition and weighting shape the signal it sends about the wider economy. (250 words)
- Recent core-sector data show domestic energy production contracting even as construction-linked industries expand. Discuss the implications of this divergence for India’s energy security and industrial strategy. (250 words)
- Timely and credible official statistics are essential for evidence-based economic policy. In this context, evaluate the role of indices such as the ICI and IIP and the case for revising their base year. (150 words)
Sources: Department for Promotion of Industry and Internal Trade (DPIIT), Ministry of Commerce and Industry and Business Today.
Frequently Asked Questions
What is the Index of Eight Core Industries?
The ICI is a monthly index that measures the combined and individual production of eight foundational industries: coal, crude oil, natural gas, refinery products, fertilizers, steel, cement and electricity. It is released by the DPIIT under the Ministry of Commerce and Industry and uses 2011-12 as its base year.
How much did core sector grow in May 2026?
Core sector output grew 0.5% year-on-year in May 2026, the slowest pace in seven months. This was down from 1.8% in April 2026. Coal, crude oil, natural gas and refinery products contracted, while cement, electricity and steel posted strong gains.
What is the weight of the core industries in the IIP?
The eight core industries together account for 40.27% of the Index of Industrial Production, making them the single largest component group. Because of this large share, the ICI is closely watched as an early indicator of the broader IIP, which is released about two weeks later by the NSO.
Which industry has the highest weight in the ICI?
Refinery products carry the highest weight in the ICI at 28.04%, followed by electricity at 19.85% and steel at 17.92%. The smallest weight belongs to fertilizers at 2.63%. This means swings in refinery, electricity and steel output move the headline number the most.
Why did the May 2026 core sector reading slow down?
The slowdown was driven almost entirely by the energy block. Coal fell 9.3%, refinery products 8.7%, natural gas 4.9% and crude oil 4.6%, reflecting high stockpiles, ageing fields and maintenance shutdowns. Strong cement, electricity and steel output partly offset these declines but could not lift the headline.
Who releases the ICI and the IIP?
The ICI is released by the Office of the Economic Adviser, DPIIT, in the Ministry of Commerce and Industry. The IIP is released separately by the National Statistical Office under the Ministry of Statistics and Programme Implementation. Both currently use 2011-12 as the base year.