UDISE+ 2025-26 Report: What the New School Education Data Shows
Why in News?
PIB confirmed that the Union Ministry of Education released the Report on Unified District Information System for Education Plus (UDISE+) 2025-26 on school education in India on 7 July 2026. Compiled by the Department of School Education and Literacy, UDISE+ is the country’s largest administrative database on schools, covering enrolment, teachers, infrastructure and stage-wise flow indicators for every recognised school from pre-primary to higher secondary across all States and Union Territories.
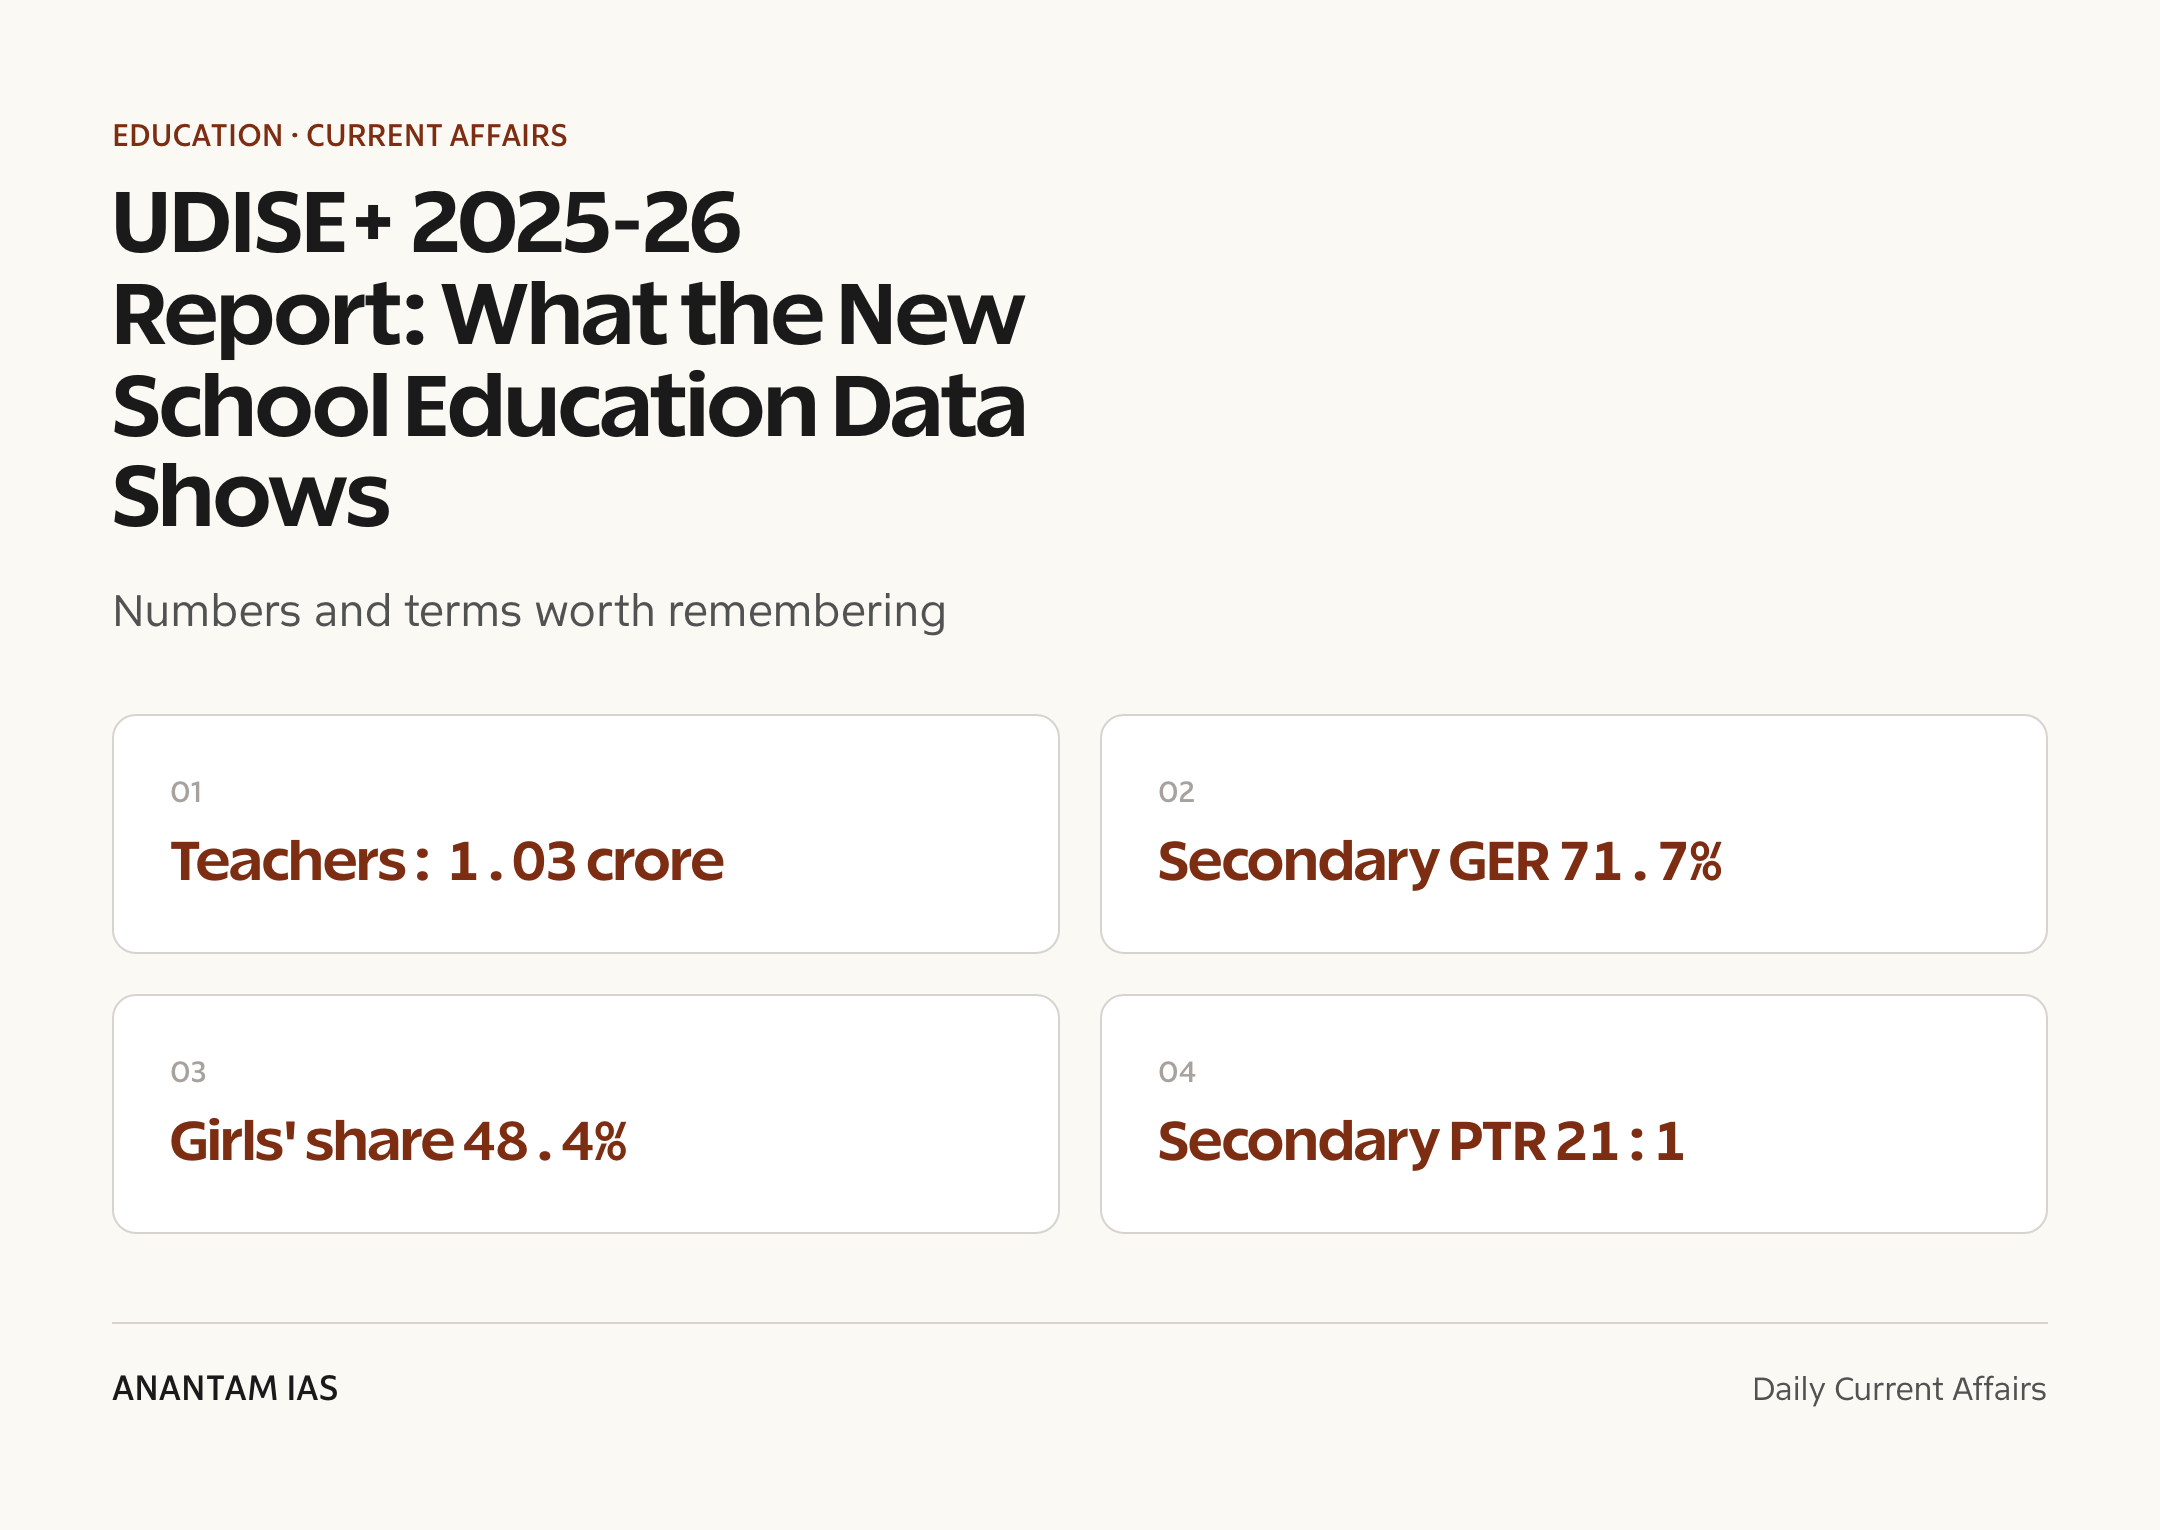
The headline picture is one of improving inputs and stronger retention: the teacher workforce has crossed 1.02 crore, the Pupil-Teacher Ratio (PTR) at every stage now sits well within the NEP 2020 norm of 30:1, secondary-level Gross Enrolment Ratio (GER) has climbed to 71.7%, and girls make up 48.4% of total enrolment.
For an aspirant, the report matters less as news than as a durable data anchor. It is the single official source that drives Samagra Shiksha fund allocation, feeds the Performance Grading Index (PGI 2.0) that ranks States and UTs, and underpins India’s national reporting against the education targets of Sustainable Development Goal 4. Reading its numbers as a progress card against NEP 2020 is what converts a press release into exam-ready notes.
- Teachers numbered 1,02,73,020 in 2025-26 — an 8.3% rise over the 94,83,294 recorded in 2022-23, the first year the national teacher count has crossed 1.02 crore.
- PTR now stands at 10 (Foundational), 12 (Preparatory), 17 (Middle) and 21 (Secondary) — all comfortably better than NEP 2020’s recommended 30:1 and the older Right to Education (RTE) Act, 2009 norms of 30:1 (primary) and 35:1 (upper primary).
- Secondary-stage dropout rate fell from 8.2% to 7.0%, and secondary retention improved from 47.2% to 51.9% in a single year.
- Secondary GER rose from 68.5% (2024-25) to 71.7% (2025-26); middle-stage GER held near 89.6%.
- Zero-enrolment schools declined about 29% to 5,663; single-teacher schools fell about 3% to 1,00,843.
- Female teachers now form 54.9% of the teaching workforce; girls’ enrolment inched up to 48.4% from 48.3%.
- Digital reach widened sharply since 2022-23: schools with computers rose to 69.9% and those with internet to 67.4%, even as roughly a third of schools stay offline.
The development matters in the context of:
- UDISE+ data is the statistical backbone for Samagra Shiksha planning, PGI 2.0 state grading and India’s reporting against SDG 4 (quality education).
- NEP 2020 targets 100% GER from preschool to secondary level by 2030 — a secondary GER of 71.7% shows how much distance remains at the top of the school pyramid.
- The report is published in both the Existing format and the NEP format (Foundational-Preparatory-Middle-Secondary), reflecting the transition to the 5+3+3+4 curricular design.
UPSC Relevance
Prelims Relevance
- UDISE+ — online school-data platform of the Department of School Education and Literacy, Ministry of Education; operational since 2018-19 as the upgraded version of UDISE (2012-13), which had merged the earlier DISE databases for elementary and secondary education.
- Since 2022-23, UDISE+ collects individual student-wise data from all recognised schools — a shift from aggregate school-level reporting.
- PTR 2025-26: Foundational 10, Preparatory 12, Middle 17, Secondary 21; NEP 2020 recommends a PTR under 30:1 (under 25:1 in disadvantaged areas).
- GER = enrolment at a stage as a % of population in the official age group (can exceed 100%); NER counts only official-age children, so NER ≤ GER — a standard Prelims trap.
- Dropout rates 2025-26: Preparatory 1.8%, Middle 3.6%, Secondary 7.0%; secondary retention 51.9%.
- Transition rates 2025-26: Foundational→Preparatory 99.2%, Preparatory→Middle 93.8%, Middle→Secondary 88.3%.
- Infrastructure coverage: drinking water 99.5%, girls’ toilets 98.5%, electricity 95.0%, computers 69.9%, internet 67.4%, ramps with handrails 58.2%.
- PGI 2.0 — Performance Grading Index for States/UTs: 73 indicators, 1,000 points, two categories (Outcomes; Governance & Management), grades from Daksh (top) to Akanshi-3 (bottom).
Mains Relevance
GS Paper 2
- Social sector — education: what improving inputs (teachers, PTR, digital access) do and don’t tell us about learning outcomes.
- NEP 2020 implementation: the 5+3+3+4 design, universal GER by 2030, and tracking progress through administrative data.
- Evidence-based governance: UDISE+, PGI 2.0 and data-driven teacher and fund allocation; limits of self-reported data.
- Gender and equity: girls at 48.4% of enrolment, women at 54.9% of teachers; only 58.2% of schools barrier-free.
GS Paper 1
- Social empowerment and the role of schooling in intergenerational mobility; regional and stage-wise disparities in retention.
Essay
- Inputs are necessary, outcomes are the test: what a classroom ratio can and cannot measure.
- Data is the new blackboard: administrative statistics and the governance of Indian education.
Background and Context
What UDISE+ Is and How the Data Is Collected
UDISE+ is India’s official census-style database of school education, run by the Department of School Education and Literacy — the definitional layer an aspirant must fix before reading any of its numbers.
- The lineage runs deep: DISE (District Information System for Education), launched in the mid-1990s under the District Primary Education Programme and later housed at NIEPA, tracked elementary schools, while a parallel SEMIS covered secondary schools.
- UDISE (from 2012-13) merged these elementary and secondary streams into one framework; UDISE+ (from 2018-19) moved the whole exercise online, adding real-time entry, in-built consistency checks and geo-tagging to curb the data-quality and time-lag problems of the manual system.
- It is a complete enumeration, not a sample survey: every government, aided, private and ‘other’ recognised school reports on itself, so UDISE+ describes the school system as a whole rather than estimating from a subset.
- Schools upload their own returns, which are then validated at block, district and state levels before national compilation — a layered check that improves reliability without removing the underlying self-reporting bias.
- Since 2022-23, the platform captures individual student-wise records keyed to a unique ID, with over 60 variables per child — enabling tracking of dropout, retention and transition child-by-child, which aggregate school-level counts could never do.
- The 2025-26 report is published in two formats: the Existing format (primary / upper-primary / secondary / higher-secondary) and the NEP format aligned to the 5+3+3+4 stages — Foundational, Preparatory, Middle and Secondary — letting users read the same system through the old and new architectures.
- Its outputs are not academic: they set per-child and per-school entitlements under Samagra Shiksha, so an inflated or missing entry has direct fiscal and planning consequences.
- Full publications are available on the official UDISE+ portal.

Teachers and PTR: The Input Story
Teacher numbers have risen every year since 2022-23, pulling stage-wise ratios well below both the NEP and RTE ceilings — but headline ratios and ground realities can diverge.
- The Pupil-Teacher Ratio (PTR) is simply total students divided by total teachers at a stage; a lower number means fewer children per teacher, and it is the standard proxy for teacher adequacy even though it says nothing about teacher quality or attendance.
- The workforce grew from 94,83,294 (2022-23) to 98,07,600 (2023-24), 1,01,22,420 (2024-25) and 1,02,73,020 in 2025-26 — a cumulative 8.3% increase over three years.
- PTR improved across every stage over four years: Foundational 11→10, Preparatory 14→12, Middle 18→17, Secondary 23→21.
- Every stage now sits far inside NEP 2020’s recommended ceiling of 30:1, which the policy pairs with a stricter 25:1 for areas with large numbers of socio-economically disadvantaged students.
- The ratios also clear the older statutory benchmarks in the Schedule to the RTE Act, 2009 — 30:1 at primary and 35:1 at upper-primary — showing the input mandate of the last framework has effectively been met nationally.
- A national PTR under the norm masks within-country skew: some blocks and subjects run heavy surpluses while others face acute shortages, especially for maths, science and language teachers at the secondary stage.
- PIB noted that UDISE+ findings are used to rationalise teacher allocation — redeploying teachers to where ratios are stretched rather than only hiring more, which is why accurate school-level entries matter.
- Single-teacher schools fell from 1,18,190 (2022-23) to 1,00,843 (2025-26); over a lakh such schools still running is a structural worry, since one teacher handling multiple grades weakens instruction quality regardless of the national average.
Retention, Dropout and Transition: Children Staying Longer
The flow indicators — how many children stay, leave and move up — improved almost across the board in 2025-26, and knowing exactly what each one measures is a common Prelims discriminator.
- Three flow metrics travel together: the dropout rate is the share of students leaving a stage without completing it; the retention rate is the share reaching the last grade of a stage relative to those who entered its first grade; and the transition rate is the share moving from the last grade of one stage into the first grade of the next.
- Dropout rates since 2022-23 fell steeply: Preparatory 8.7%→1.8%; Middle 8.1%→3.6%; Secondary 13.8%→7.0% — with secondary still the leakiest stage of the system.
- Retention in 2025-26: Foundational 98.5%, Preparatory 91.1%, Middle 83.7%, Secondary 51.9% — the secondary figure jumped nearly five percentage points from 47.2% in a single year.
- Transition rates all rose: Foundational→Preparatory 99.2%, Preparatory→Middle 93.8%, Middle→Secondary 88.3% — the drop at the middle-to-secondary junction being where most adolescent leakage begins.
- PIB attributed the secondary-stage gains partly to an increase in schools offering secondary education, which shortens the physical distance to continued study — a supply-side response to a long-standing access gap.
- The classic drivers behind adolescent dropout — household poverty and child labour, early marriage of girls, distance to secondary schools, and the pull of low-skill work — are exactly what schemes like scholarships, KGBVs and vocational streams try to counter.
- Zero-enrolment schools — schools with no students at all — dropped about 29% in one year, from 7,993 to 5,663, aiding rationalisation of idle buildings and staff.
Access and Enrolment: GER and the Gender Picture
Enrolment ratios show clear gains at the secondary stage, with gender indicators moving gradually in the right direction — but the GER/NER distinction is where the real reading happens.
- Secondary GER rose from 68.5% to 71.7%; middle-stage GER stayed around 89.6%, and enrolment thins visibly as the stage rises — the pyramid narrows towards the top.
- Gross Enrolment Ratio (GER) measures total enrolment at a stage against the corresponding official age-group population, so over-age and under-age children can push it past 100%; it captures coverage but not age-appropriateness.
- Net Enrolment Ratio (NER) counts only children of the official age group enrolled in that stage, so it is always the stricter measure — NER can never exceed GER, and a wide GER-NER gap signals large numbers of over-age or repeating students.
- Girls’ enrolment reached 48.4% of total enrolment (48.0% in 2022-23), broadly mirroring the population share and reflecting the near-closure of the elementary-stage gender gap achieved over the last two decades.
- The Gender Parity Index (GPI) — girls’ GER divided by boys’ GER, with 1.0 as parity — now sits close to or above 1 at the school stages, one of India’s clearest equity successes.
- Female teachers rose to 54.9% of the workforce, from 52.3% in 2022-23; a majority-female teaching profession is associated with safer, more gender-sensitive classrooms and stronger retention of girls, especially at upper stages.
- Both trends support the NEP 2020 equity agenda, including its Gender Inclusion Fund and targeted support for Socio-Economically Disadvantaged Groups (SEDGs), alongside schemes such as Kasturba Gandhi Balika Vidyalayas for adolescent girls.
School Infrastructure: Digital and Basic Facilities
Basic amenities are near-universal; digital infrastructure is expanding fastest but remains the biggest gap — and several of these facilities are legal entitlements, not aspirations.
- The Schedule to the RTE Act, 2009 already mandates minimum norms for every school — an all-weather building, separate toilets for boys and girls, safe drinking water, a library, a playground and a barrier-free environment — so infrastructure numbers double as a compliance scorecard.
- Schools with computer access rose from 64.7% to 69.9%; schools with internet from 63.5% to 67.4% — up dramatically from 47.7% and 49.7% respectively in 2022-23, the fastest-moving indicators in the report.
- Basic facilities in 2025-26 are near-universal: drinking water 99.5%, girls’ toilets 98.5%, boys’ toilets 97.2%, handwash 96.9%, electricity 95.0%, library 90.5%.
- Ramps with handrails reached 58.2% of schools (51.0% in 2022-23) — real progress on inclusive access, yet two in five schools still aren’t barrier-free for children with disabilities.
- Playground availability actually slipped, from 83.0% to 81.9%, and rainwater harvesting exists in under 30% of schools — the two visible soft spots in an otherwise improving table.
- The digital gap has a spatial pattern: the roughly one-third of schools without internet are concentrated in rural, remote and hilly blocks, the same places where teacher shortages and long distances to secondary schools also cluster.
- Digital access matters directly for DIKSHA, PM e-Vidya and the NEP’s technology-in-education agenda; without connectivity, digital content and online assessments simply cannot reach the last-mile school.
The NEP 2020 Yardstick
The report’s own categories are built around NEP 2020, so its numbers read as a running progress card against the policy’s stated targets.
- NEP 2020 replaced the old 10+2 structure with a 5+3+3+4 design: Foundational (ages 3-8, covering pre-primary plus Classes 1-2), Preparatory (8-11, Classes 3-5), Middle (11-14, Classes 6-8) and Secondary (14-18, Classes 9-12), formally bringing early-childhood education into the school system.
- Its headline access target is 100% GER from preschool to secondary level by 2030; secondary GER at 71.7% leaves roughly 28 percentage points to close in about four years — the steepest stretch of the climb.
- On teachers, the policy sets PTR under 30:1 everywhere (25:1 in disadvantaged areas) — now achieved at every stage — alongside continuous professional development, a common National Professional Standards for Teachers, and merit-based deployment.
- NEP also targets public spending on education at 6% of GDP (a goal traced back to the 1968 Kothari Commission that remains unmet), and universal Foundational Literacy and Numeracy (FLN) through the NIPUN Bharat mission.
- It commits to bringing an estimated 2 crore out-of-school children back into the system and to reducing dropout by strengthening the middle-to-secondary bridge, both of which UDISE+ flow data now track directly.
- The falling count of zero-enrolment and single-teacher schools reflects the policy’s push for school complexes/clusters that share resources and rationalise teacher deployment across nearby schools.
Where the Gaps Remain
Read critically, the same tables flag the unfinished agenda a strong Mains answer should foreground rather than celebrate the headlines.
- Secondary retention of 51.9% means nearly half a cohort still doesn’t complete the secondary stage — the single starkest number in the report and the clearest gap against the 100%-by-2030 target.
- Middle-stage dropout ticked up marginally from 3.5% to 3.6%, and Foundational/Preparatory retention dipped slightly after three years of gains — a reminder that trends can plateau or reverse.
- UDISE+ counts inputs and flows, not learning: it cannot say whether children read or compute at grade level — that is the job of learning surveys such as the National Achievement Survey (NAS) run by PARAKH, and independent studies like ASER, which have repeatedly flagged a foundational-learning crisis.
- Data is self-reported by schools; the block-district-state validation layers help, but incentives to over-report enrolment (tied to entitlements) or facilities remain a structural weakness of administrative statistics.
- National averages hide wide inter-state and rural-urban spreads — a national PTR under 30 coexists with severely understaffed districts — which is exactly why the Ministry grades States separately through PGI 2.0.
- Counting a facility as ‘present’ says nothing about whether it functions: a listed computer lab, toilet or library may be non-working, so infrastructure coverage is a ceiling on quality, not proof of it.
From Data to Accountability: PGI 2.0
UDISE+ numbers feed directly into the Ministry’s grading instrument for States, closing the loop between raw data and public accountability.
- PGI 2.0 (Performance Grading Index for States/UTs) scores school education across 73 indicators worth 1,000 points, in two broad categories — Outcomes and Governance & Management — spread over six domains: Learning Outcomes, Access, Infrastructure & Facilities, Equity, Governance Processes, and Teacher Education & Training.
- Grades run from Daksh (above 90%) through Utkarsh, Ati-Uttam, Uttam, Prachesta and Akanshi bands down to Akanshi-3 (the lowest); in the most recent published rounds no State reached the top bands, underscoring that strong inputs alone do not buy quality outcomes.
- A district-level version, PGI-D, applies the same logic below the State level so that intra-State variation is visible too.
- The design deliberately weights outcomes over inputs, nudging States to chase learning and equity rather than only building facilities — the accountability counterpart to UDISE+’s descriptive data.
- Together, UDISE+, PGI 2.0 and PARAKH/NAS assessments form the monitoring architecture of NEP 2020 — administrative data, comparative grading and learning measurement respectively.
- For daily exam-focused coverage of such reports, see the Anantam IAS current affairs archive.
Way Forward
Fix the secondary-stage funnel
- Expand secondary-school availability in underserved blocks, backed by transport support, residential facilities, scholarships and vocational pathways that make staying enrolled worthwhile.
- Target the transition points (middle→secondary at 88.3%) by flagging individual at-risk children early — now feasible with student-wise UDISE+ records — and following up on non-transitioning students by name.
- Strengthen adolescent-specific supports — KGBVs, bicycle and stipend schemes, and bridge courses — that address the poverty, distance and early-marriage pressures behind secondary dropout.
Shift from inputs to outcomes
- Pair UDISE+ input data with PARAKH/NAS learning assessments so PTR and infrastructure gains are judged by what children actually learn, not merely by facilities on a checklist.
- Anchor early grades in the NIPUN Bharat foundational literacy and numeracy mission, since weak foundations are the deepest cause of later dropout.
- Publish district-level dashboards that link spending, staffing and outcomes, and move toward independent third-party audits to offset the self-reporting bias in administrative data.
Close the digital and inclusion gaps
- Prioritise internet and computer access for the remaining roughly 30% of offline schools, converging with BharatNet and PM e-Vidya so digital content and assessments actually reach rural classrooms.
- Accelerate barrier-free access (ramps, accessible toilets) beyond 58.2% — a legal obligation under the Rights of Persons with Disabilities Act, 2016 and the RTE norms, not just a facility metric.
- Arrest the slide in playgrounds, mainstream rainwater harvesting, and shift the focus from whether a facility exists to whether it is functional and used.
Deploy teachers where they are needed
- Use UDISE+ ratios to rationalise teacher deployment — redeploying surplus teachers and filling subject-specific vacancies in maths, science and languages at the secondary stage rather than reading comfort from the national average.
- Phase out the remaining 1,00,843 single-teacher schools through school-complex clustering, so no child depends on one teacher across multiple grades.
Conclusion
UDISE+ 2025-26 is, on balance, a good-news report: more teachers, friendlier classroom ratios, fewer children dropping out, and near-universal basic amenities. The direction of every major flow indicator — dropout, retention, transition, GER — is favourable, and the gender composition of both classrooms and staffrooms keeps improving. The input mandate of the RTE era has largely been fulfilled at the national level.
But the report also defines the next frontier precisely. A secondary retention rate of 51.9% and a secondary GER of 71.7% against NEP 2020’s 100%-by-2030 target mean the system still loses too many adolescents exactly when schooling starts paying off. National averages, which say nothing about learning, also sit atop wide inter-state and rural-urban gaps that only PGI 2.0 and learning surveys expose.
The task ahead is a shift in kind, not degree: from counting inputs to measuring learning, from building facilities to making them function, and from national averages to the specific blocks and children being left behind. Whether India converts its improving inputs into completion and grade-level learning is now the real test of evidence-based education governance — and UDISE+, read honestly, is the instrument that will keep score.
UPSC Practice Questions
Prelims MCQ 1
With reference to the Unified District Information System for Education Plus (UDISE+), consider the following statements:
- It is maintained by the Department of School Education and Literacy under the Union Ministry of Education.
- It has collected individual student-wise data from all recognised schools since 2022-23.
- According to the UDISE+ 2025-26 report, the Pupil-Teacher Ratio at the secondary level is worse than the 30:1 ratio recommended by NEP 2020.
How many of the above statements are correct?
(a) Only one (b) Only two (c) All three (d) None
Answer: (b) Only two
Explanation:
Statements 1 and 2 are correct: UDISE+ is run by the Department of School Education and Literacy and has captured student-wise records since 2022-23. Statement 3 is incorrect — secondary-stage PTR is 21, comfortably better than NEP 2020’s recommended ceiling of 30:1.
Prelims MCQ 2
According to the UDISE+ 2025-26 report, which one of the following indicators recorded a decline compared with 2024-25?
(a) Percentage of schools with playgrounds (b) Girls’ share of total enrolment (c) Gross Enrolment Ratio at the secondary level (d) Percentage of schools with internet access
Answer: (a) Percentage of schools with playgrounds
Explanation:
Playground availability slipped from 83.0% to 81.9%. Girls’ enrolment (48.3%→48.4%), secondary GER (68.5%→71.7%) and internet access (63.5%→67.4%) all improved.
UPSC Mains Questions
- The UDISE+ 2025-26 report shows improving inputs but persistent attrition at the secondary stage. Examine the factors behind low secondary retention in Indian school education and suggest measures to achieve NEP 2020’s target of universal Gross Enrolment Ratio by 2030.
- Reliable administrative data is the backbone of education governance. Discuss the roles of UDISE+, PGI 2.0 and learning assessments in evidence-based policymaking for school education in India, along with the limitations of self-reported data.
- Near-universal toilets and drinking water but only 58% barrier-free schools and 70% with computers — critically assess whether India’s school infrastructure push is keeping pace with the inclusion and digital-learning goals of NEP 2020.
Sources: PIB, Ministry of Education and UDISE+ portal, Department of School Education & Literacy.
Frequently Asked Questions
What is UDISE+?
UDISE+ (Unified District Information System for Education Plus) is the Ministry of Education’s online database covering all recognised schools in India. Operational since 2018-19 as an upgrade of UDISE, it records enrolment, teachers, infrastructure and student flows, and has collected individual student-wise data since 2022-23.
Who publishes the UDISE+ report?
The Department of School Education and Literacy under the Union Ministry of Education compiles and publishes it. Schools upload their own data online, which is verified at block, district and state levels. The 2025-26 report was released on 7 July 2026 in both the Existing and NEP formats.
What are the key findings of UDISE+ 2025-26?
Teachers rose to 1.02 crore (up 8.3% since 2022-23), secondary GER climbed to 71.7%, secondary dropout fell to 7.0%, secondary retention improved to 51.9%, girls’ enrolment reached 48.4%, and 69.9% of schools now have computer access. Zero-enrolment schools fell about 29% to 5,663.
What Pupil-Teacher Ratio does NEP 2020 recommend?
NEP 2020 recommends a PTR under 30:1 at every school, and under 25:1 in areas with many socio-economically disadvantaged students. UDISE+ 2025-26 reports PTRs of 10, 12, 17 and 21 at the Foundational, Preparatory, Middle and Secondary stages — all within the norm.
What is the difference between GER and NER?
Gross Enrolment Ratio counts all students at a stage against the official age-group population, so over-age and under-age children can push it beyond 100%. Net Enrolment Ratio counts only children of the official age group, making it the stricter measure. NER can never exceed GER.
How does UDISE+ relate to PGI 2.0?
UDISE+ supplies much of the raw data for PGI 2.0, the Performance Grading Index that scores states and UTs on 73 indicators worth 1,000 points across outcomes and governance. Grades run from Daksh (highest) to Akanshi-3, turning administrative data into comparative accountability.