Economic Survey 2025-26: Real GDP, CPI, Forex Reserves and Sectoral Outlook
Economic Survey 2025-26 — tabled in Parliament on 29 January 2026 by FM Nirmala Sitharaman — pegs FY26 real GDP growth at 7.4%, projects FY27 at 6.8–7.2%, records the lowest CPI inflation under the 2014 series at 1.7% and crosses $701.4 billion in forex reserves. A complete UPSC-ready breakdown.
Introduction
The Economic Survey is the Government of India’s annual diagnostic of the macroeconomy, prepared by the Department of Economic Affairs in the Ministry of Finance under the supervision of the Chief Economic Adviser, currently V. Anantha Nageswaran. Tabled in Parliament a day before the Union Budget, the document is at once a stocktaking exercise, a forecasting instrument, and a policy memorandum that sets the analytical frame within which the next year’s Budget is read. Finance Minister Nirmala Sitharaman placed the Economic Survey 2025-26 on the table of both Houses on 29 January 2026, the eve of the Budget Session, and the volume immediately drew commentary because it pairs the highest real growth print since the pandemic recovery with the lowest headline inflation reading recorded under the 2014-base CPI series. For the UPSC aspirant, this single document opens onto Paper II governance and parliamentary procedure, Paper III economy and resource mobilisation, and Paper IV ethics in public finance, while supplying a dense corpus of Prelims-grade numbers.
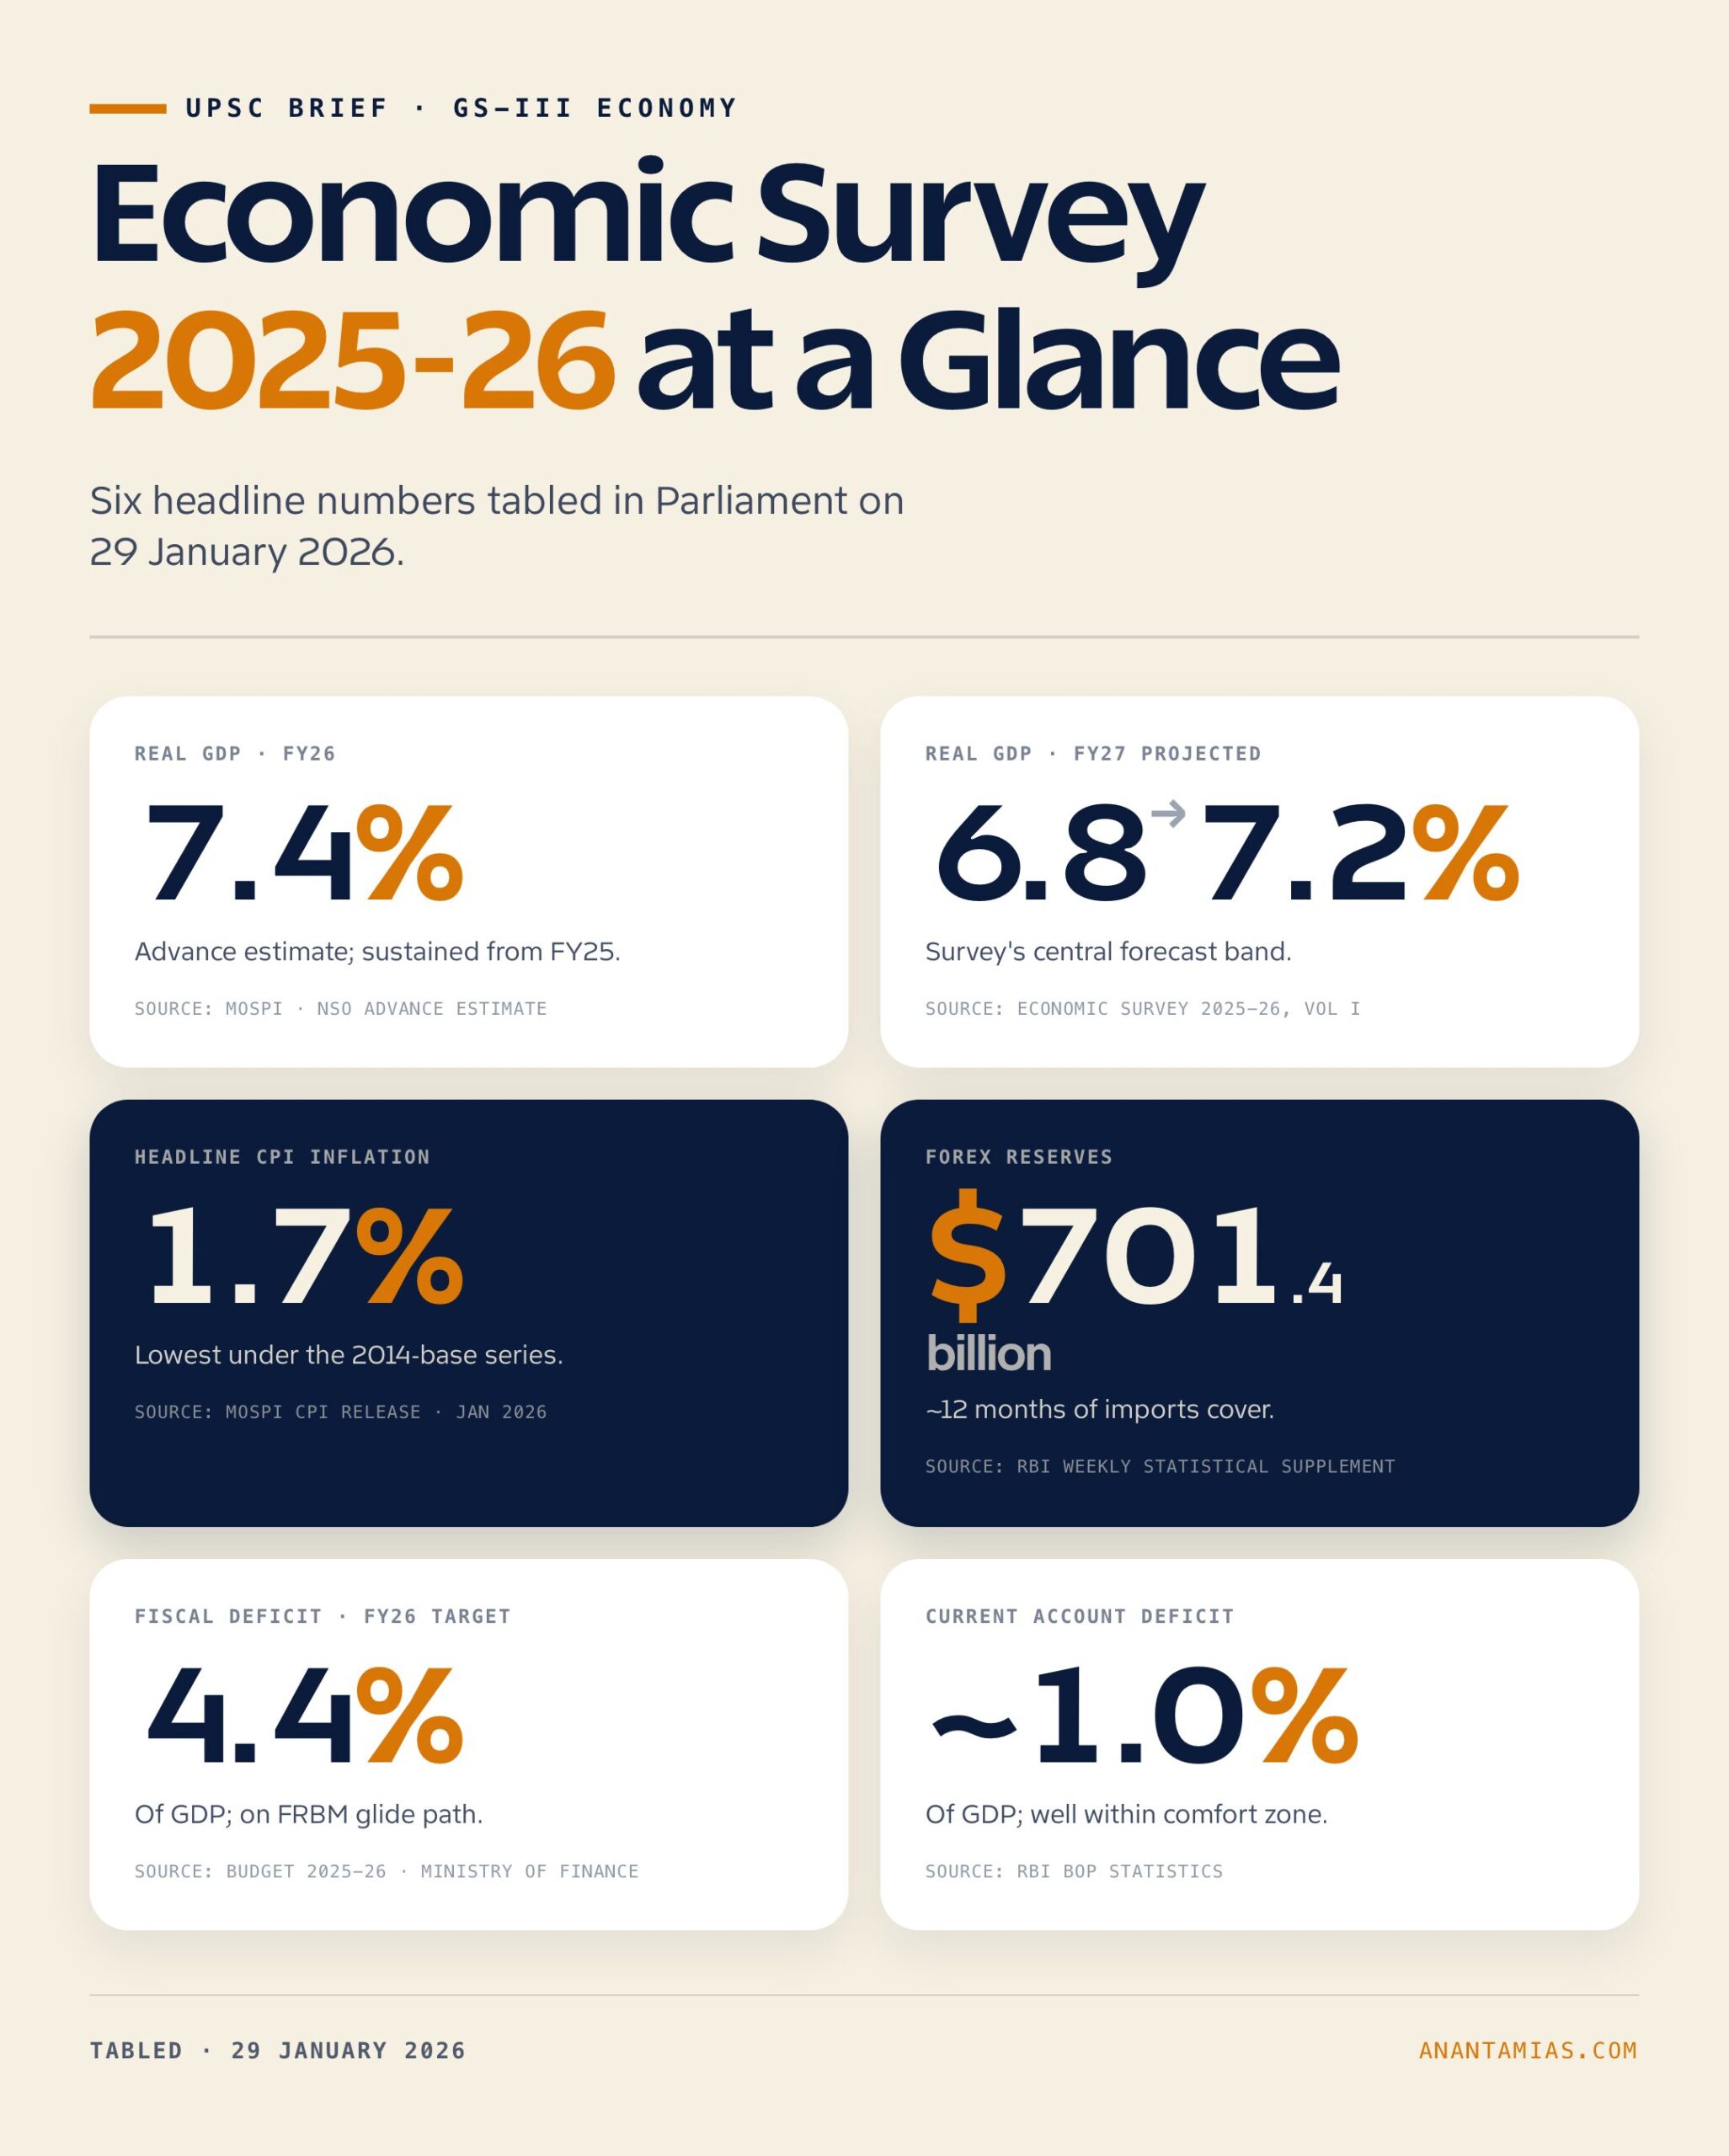
The headline numbers anchor the rest of the discussion. Real GDP growth for FY26 is estimated at 7.4% in the advance estimate, the FY27 projection is placed in a 6.8% to 7.2% band, headline CPI inflation has fallen to 1.7%, and foreign exchange reserves have crossed $701.4 billion — sufficient, the Survey records, to cover roughly twelve months of merchandise imports. Each of these numbers carries policy weight far beyond the press headline. This article unpacks the data, the institutional history of the Survey, the sectoral picture across agriculture, industry and services, the comparative position vis-à-vis Asian peers, and the criticisms that informed commentators have already raised in the days following publication.
Quick Facts at a Glance
| Indicator | Value | Source |
|---|---|---|
| Real GDP growth, FY26 (advance estimate) | 7.4% | Economic Survey 2025-26, Vol. II |
| Real GDP growth projection, FY27 | 6.8% to 7.2% | Economic Survey 2025-26, Macroeconomic Framework |
| Headline CPI inflation (December 2025 print) | 1.7% | MoSPI / Economic Survey 2025-26 |
| Foreign exchange reserves (end-January 2026) | $701.4 billion | RBI Weekly Statistical Supplement |
| Fiscal deficit target, FY26 | 4.4% of GDP | Budget 2025-26 / Economic Survey 2025-26 |
| Current account deficit, FY26 estimate | ~1.0% of GDP | Economic Survey 2025-26, External Sector chapter |
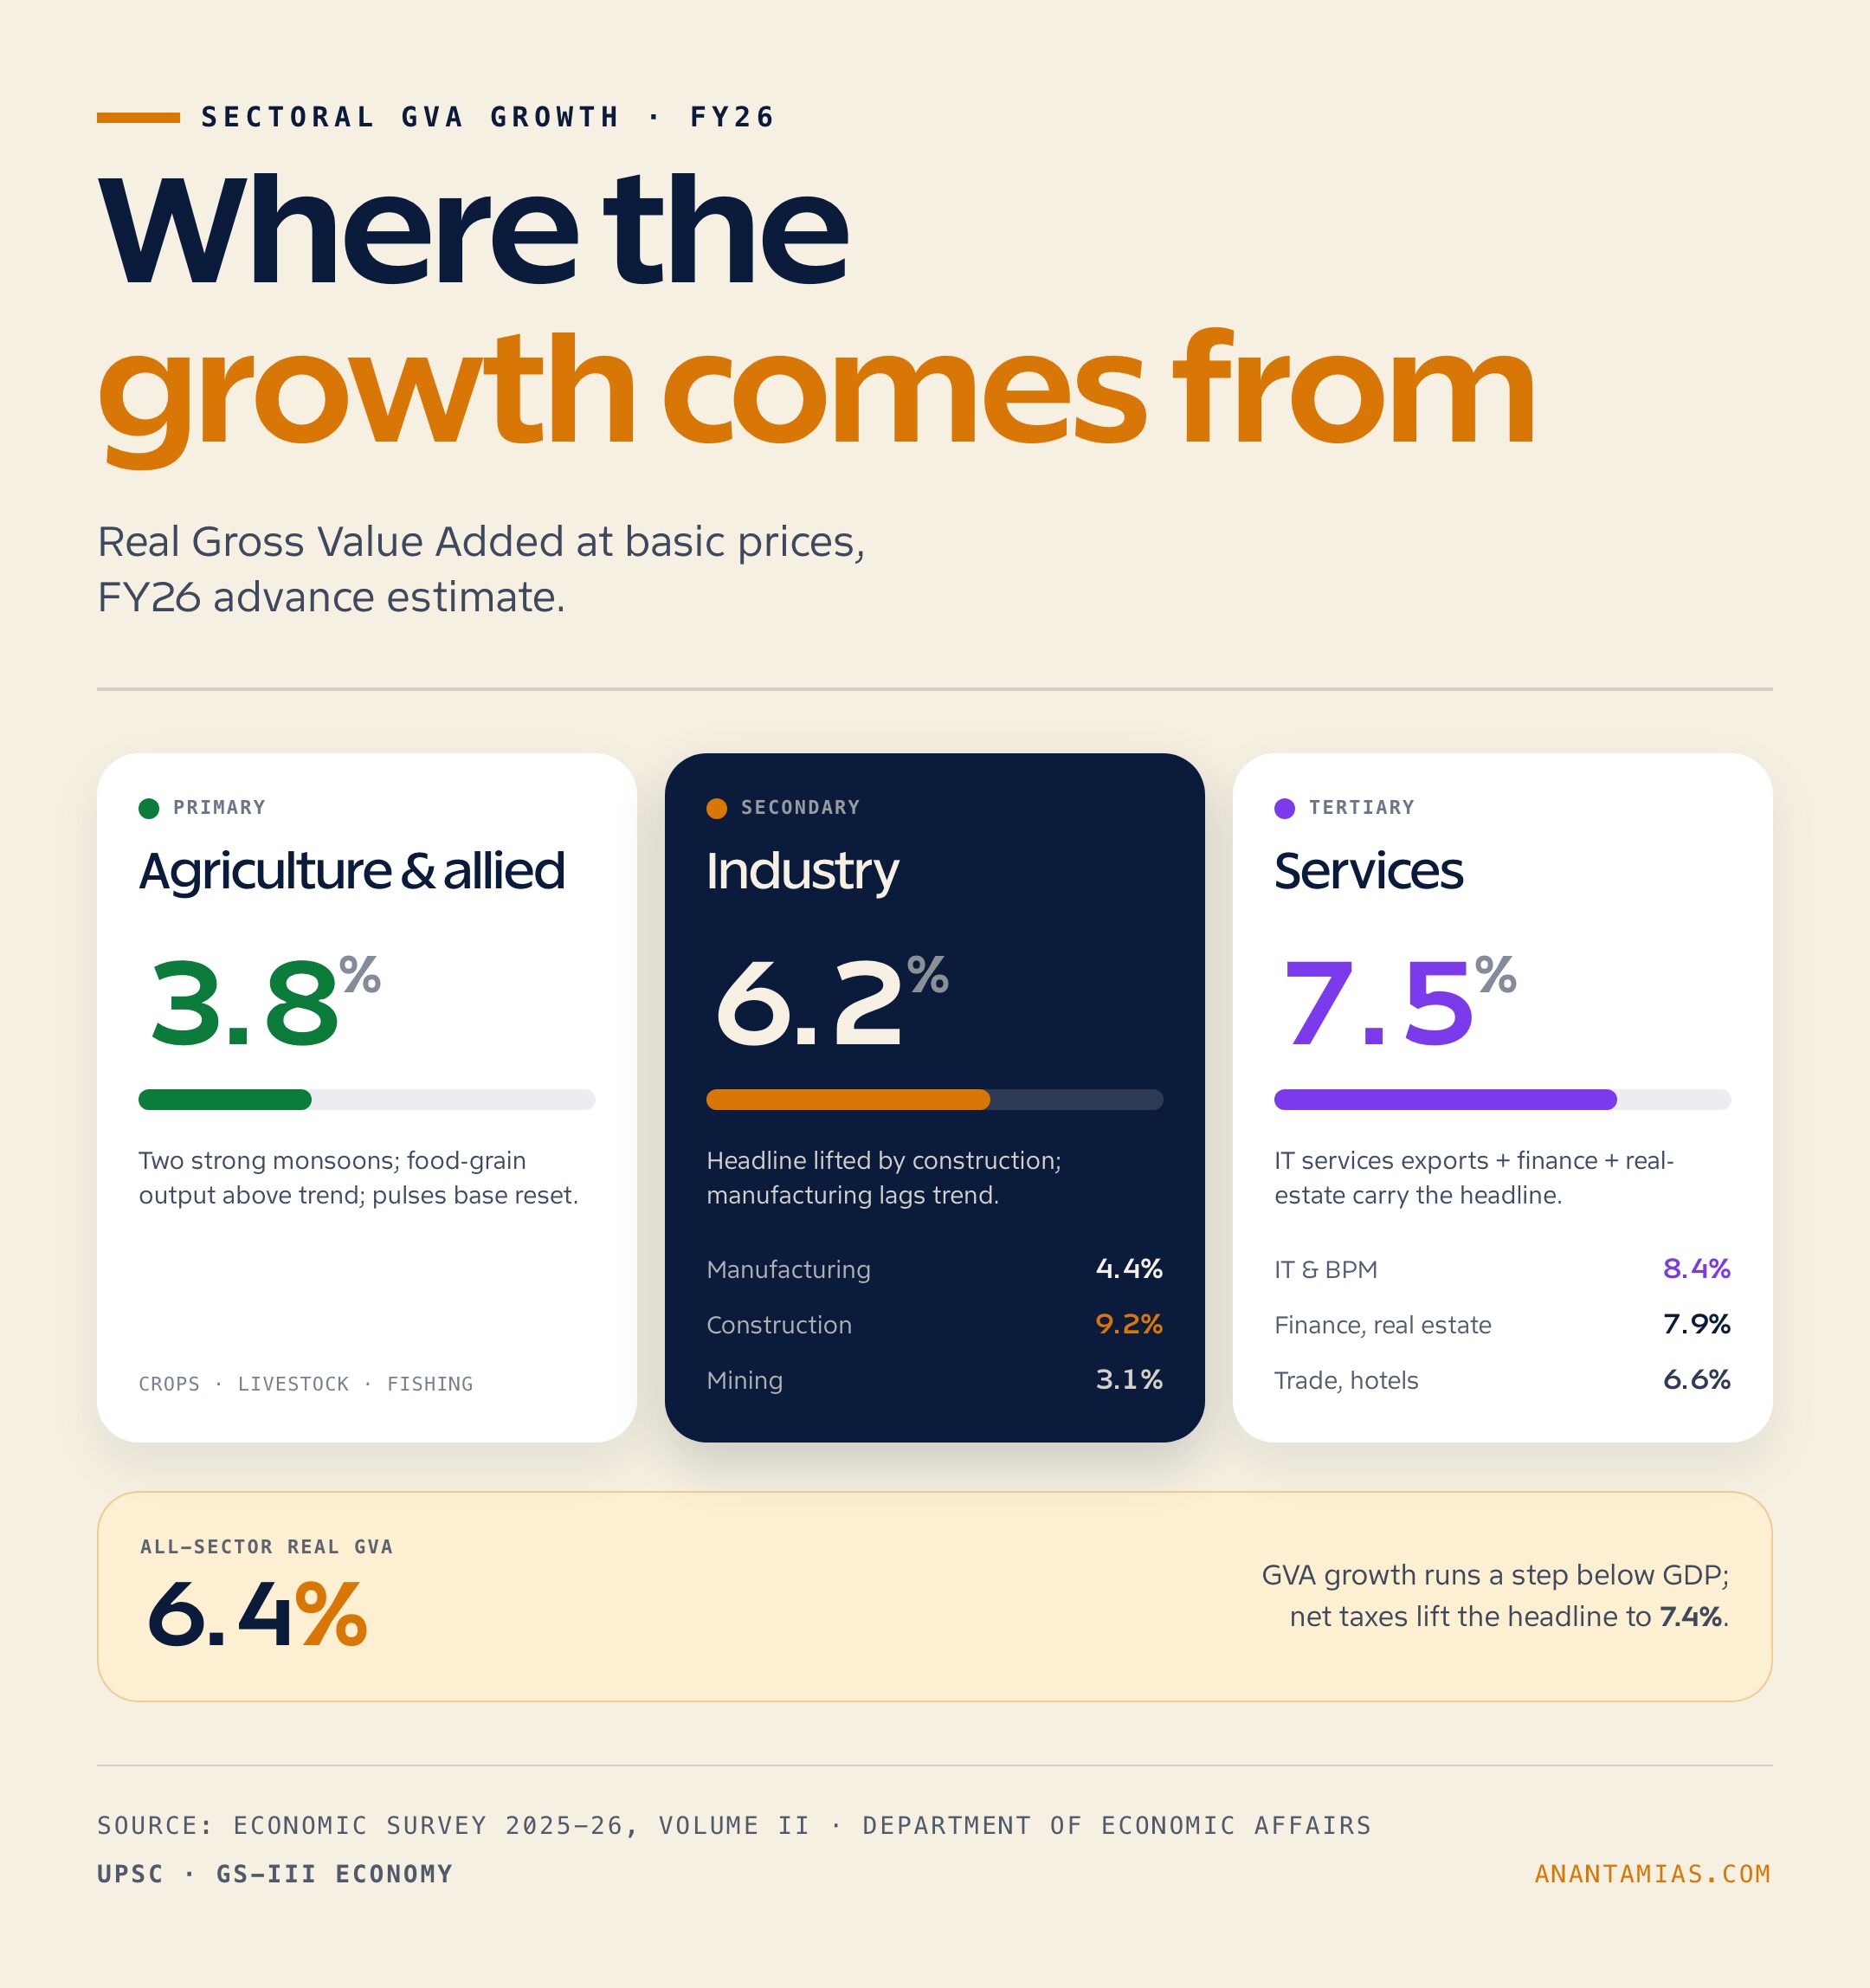
| Agriculture and allied sectors growth, FY26 | 3.8% | Economic Survey 2025-26, Agriculture chapter |
| Industry growth, FY26 | 6.5% | Economic Survey 2025-26, Industry chapter |
| Services growth, FY26 | 8.4% | Economic Survey 2025-26, Services chapter |
Background and Historical Context
The Economic Survey is older than the Budget speech as we know it today. The first Survey was presented in 1950-51 as part of the Budget documents, and from 1964 onwards it was de-linked from the Budget speech and tabled separately a day before the Finance Minister’s address, an arrangement formalised so that Members of Parliament could read the analytical groundwork before being asked to debate revenue and expenditure proposals. The document is constitutionally unobliged — no provision of the Constitution mandates its presentation — yet it has acquired the weight of convention, and successive governments have treated it as a non-negotiable feature of the budgetary calendar. The Survey draws on data from the Ministry of Statistics and Programme Implementation, the Reserve Bank of India, line ministries, and increasingly on private high-frequency indicators such as e-way bill volumes, GST collections and UPI throughput.
The institutional architecture has evolved alongside the document. The post of Chief Economic Adviser, created in 1956, anchors Survey authorship; the office has been held by figures such as I. G. Patel, Manmohan Singh, Bimal Jalan, Shankar Acharya, Arvind Subramanian, Krishnamurthy Subramanian, and from 2022 onwards V. Anantha Nageswaran. The two-volume format — Volume I as analytical essays on chosen themes, Volume II as standard sectoral reportage — was institutionalised under Arvind Subramanian’s tenure and has been retained in subsequent editions, with the 2025-26 issue continuing the convention of theme chapters in Volume I followed by a workhorse sectoral Volume II.
Survey 2025-26 sits at a particular juncture in the post-pandemic story. India’s real GDP contracted sharply in FY21, rebounded in FY22, and has since printed growth above 7% in three of the four years through FY26. The structural question the Survey takes up is whether this run-rate is a cyclical bounce or the floor of a longer expansion underwritten by digital public infrastructure, formalisation, and capital-expenditure-led demand. What is structurally new in this edition is the chapter-length attention to artificial intelligence diffusion, the climate finance gap, and the interaction between disinflation and monetary policy transmission — themes absent from earlier Surveys. The 2025-26 volume also breaks with tradition by carrying a dedicated chapter on the welfare and productivity implications of digital public infrastructure, a category in which India has acquired global standard-setting status, and an extended treatment of the demographic transition that locates India’s working-age share at its multi-decade peak around 2031.
The Survey is also implicitly a political document. Its tone calibrates the government’s economic narrative for the coming year and signals to bond markets, rating agencies and international investors which reform vectors will be prioritised. Successive editions can be read as a layered conversation: the 2022-23 edition laid the analytical case for the capex push, 2023-24 addressed the sticky inflation problem, 2024-25 turned to private-investment revival, and the 2025-26 edition consolidates the macro picture while pivoting attention to the supply side — productivity, factor markets, and the climate transition. This continuity makes the document indispensable not just for the year it covers but for tracing the trajectory of official thinking across cycles.
Key Features of the Economic Survey 2025-26
Macroeconomic Outlook
The Survey’s central macro claim is that the Indian economy will close FY26 with real GDP growth of 7.4%, anchored on a private final consumption recovery, sustained government capex, and a services export tailwind. For FY27, the document offers a band — 6.8% to 7.2% — rather than a point estimate, an uncharacteristic hedge that reflects external uncertainty around the US monetary cycle, oil prices, and the trajectory of the China slowdown. Nominal GDP is projected to grow at roughly 10.1%, which preserves the denominator arithmetic that makes the fiscal-deficit-to-GDP target of 4.4% achievable without expenditure compression. The Survey explicitly frames the FY27 outlook as a “growth recalibration” rather than a deceleration, arguing that base effects from FY26’s high print explain most of the moderation.
Inflation and Monetary Stance
Headline CPI at 1.7% is the lowest reading since the 2014-base series began, and the Survey treats this as a double-edged development. Disinflation has been driven primarily by a collapse in food inflation, particularly cereals and vegetables, on the back of two strong monsoons and active buffer-stock management by the Food Corporation of India. Core inflation, stripping out food and fuel, sits closer to 3.5%, suggesting that demand-side pressure remains contained. The Survey notes that this print sits well below the Reserve Bank of India‘s lower tolerance band of 2% under the flexible inflation targeting regime, and flags the implication for the Monetary Policy Committee: the policy rate has more headroom to support growth than the macro aggregates alone would suggest.
External Sector and Forex Position
India’s foreign exchange reserves crossed $701.4 billion in the week preceding the Survey’s tabling, the highest stock ever recorded and equivalent to roughly twelve months of merchandise imports — comfortably above the eight-month threshold typically cited by the IMF as adequacy. The current account deficit is estimated at around 1.0% of GDP for FY26, narrower than the FY25 print, helped by buoyant services exports — particularly software and global capability centres — and steady remittances. The Survey records that net foreign portfolio investment turned positive after a volatile first half, while foreign direct investment inflows remained subdued in absolute terms but improved in net terms as repatriation moderated.
Sectoral Performance — Agriculture, Industry, Services
Agriculture and allied activities are estimated to grow at 3.8% in FY26, propelled by a record kharif harvest and strong rabi sowing acreage. Industry expanded at 6.5%, with manufacturing and construction doing the heavy lifting; mining and quarrying lagged. Services posted 8.4% growth, the strongest of the three, with the trade-hotels-transport-communication aggregate accelerating on the back of urban consumption and tourism normalisation. The Survey notes that the services share of Gross Value Added has crept above 54%, while manufacturing’s share remains stuck near 17% — a structural lopsidedness the document calls out as the single biggest medium-term concern. Within manufacturing, electronics, pharmaceuticals and automobiles continue to outperform, while textiles, leather and food processing — the labour-intensive sub-sectors that should be absorbing the rural-to-urban migration — have grown below the manufacturing average for the third consecutive year, a divergence the Survey treats as an unfinished agenda for both PLI and the trade-policy framework being recalibrated after the conclusion of the India-EU and India-UK trade agreements.
Significance for UPSC and General Knowledge
- Direct GS3 syllabus hit on Indian economy, planning, mobilisation of resources, growth, development and employment.
- GS2 anchor on parliament and budgetary procedure — the Survey’s tabling on the eve of the Budget is itself a procedural fact testable in Prelims.
- Prelims static fodder on monetary aggregates, fiscal deficit definitions, current account components, and FRBM thresholds.
- Essay paper data bank — every sectoral number in the Survey is quotable in growth, inequality and welfare essays.
- GS3 environment overlap via the climate and SDG chapters that situate the Indian transition pathway.
- Interview-stage current affairs material on the disinflation puzzle and the RBI’s policy dilemma.
- GS4 ethics linkage on the integrity of statistical institutions and the credibility of official forecasts.
Detailed Analysis: Sectoral Allocations and Reform Priorities
The detailed sectoral story in Survey 2025-26 is best read as a triptych: a productive agriculture sector still trapped in low-value crop choices, a manufacturing sector that has finally decoupled construction from machinery output, and a services sector that is bifurcating between high-productivity export verticals and low-productivity informal services. The Survey’s own table of Gross Value Added growth, reproduced and condensed below, shows that the only sub-sector running below 4% growth is mining and quarrying, while construction and financial services are pulling the index up. The headline framing — services-led, capex-supported, consumption-recovering — masks heterogeneity that becomes visible only at the two-digit NIC level.
| Sector | FY26 GVA Growth (Advance Estimate) | Share of Total GVA |
|---|---|---|
| Agriculture and allied | 3.8% | ~17.4% |
| Mining and quarrying | 2.1% | ~2.0% |
| Manufacturing | 5.9% | ~17.1% |
| Electricity, gas, water and utilities | 6.8% | ~2.4% |
| Construction | 9.1% | ~9.0% |
| Trade, hotels, transport, communication | 7.2% | ~18.4% |
| Financial, real estate, professional services | 8.6% | ~22.6% |
| Public administration, defence, other services | 9.5% | ~13.1% |
The Survey’s most pointed reform discussion centres on agriculture. Three structural facts are restated: nearly 45% of the workforce remains engaged in agriculture, average operational holdings have shrunk to under 1.08 hectares, and the share of high-value horticulture, dairy and fisheries in agricultural GVA now exceeds the share of cereals — yet public procurement, MSP signalling and credit flow continue to privilege rice and wheat. The Survey calls for accelerated rollout of the Agriculture Infrastructure Fund, deeper integration of e-NAM across mandis, and a pivot in the PM-AASHA framework towards pulses and oilseeds. The document is unusually candid about the agriculture-water-electricity nexus: free-power subsidies and skewed cropping patterns are described as the binding constraint on northern groundwater tables.
On industry, the Survey treats the Production Linked Incentive (PLI) scheme as having delivered measurable export gains in electronics and pharmaceuticals while underperforming on textiles and specialty steel. The document records that the share of mobile phone exports has risen from negligible in FY18 to over $20 billion in FY26, with Apple Inc. contract manufacturing through Foxconn, Pegatron and Tata Electronics accounting for the bulk of incremental volume. Beyond PLI, the Survey foregrounds the National Logistics Policy, the PM Gati Shakti master plan, and the gradual rollout of the Unified Logistics Interface Platform as the supply-side scaffolding under medium-term competitiveness. Manufacturing wage growth, the document notes carefully, has lagged productivity growth — a finding that complicates the consumption-recovery narrative.
Services growth is treated with optimism but qualified. Software exports, captive global capability centres for firms such as JPMorgan Chase, Goldman Sachs and Walmart, and the booming digital payments rail anchored by UPI all feature prominently. UPI processed monthly volumes north of 18 billion transactions in the December 2025 print, and the Survey treats this as evidence that digital public infrastructure has produced genuine productivity gains rather than mere convenience. Yet the Survey does not let the headline obscure the underbelly: roughly half of services employment remains in retail, food services and personal services with productivity levels close to subsistence. The document calls for portable social-security architecture under the e-Shram registry to cover this segment.
Infrastructure runs as a connecting thread through the sectoral chapters. Capital expenditure by the Union government, budgeted at over Rs 11.1 lakh crore for FY26, is treated as the supply-side counterpart to the consumption recovery on the demand side. The Survey records that physical execution of national highway projects under the Bharatmala Pariyojana, dedicated freight corridors operated by DFCCIL, and the rolling stock modernisation under the Vande Bharat programme has accelerated, with the average daily highway construction rate climbing back above 28 km. In parallel, the document tracks renewable capacity additions: India’s installed non-fossil capacity has crossed the halfway mark in the energy mix, and the Survey ties this directly to the Panchamrit commitments announced at COP26 and the long-term net-zero-by-2070 trajectory.
The reform priorities the Survey crystallises across these chapters can be read together: deepen factor-market reform in land and labour, complete the GST rate-rationalisation begun in late 2025, recapitalise the agriculture extension system, accelerate green-hydrogen capacity sanctions under the National Green Hydrogen Mission, and use the disinflation window to push through energy-pricing reform. None of these is new — most appear in some form in previous Surveys — but the 2025-26 edition argues, with greater conviction than its predecessors, that the macroeconomic stability achieved in FY26 has finally created the political space to act on them. The closing chapters of Volume I make a sharper point: India’s growth ceiling over the next decade will be set less by aggregate demand and more by the country’s ability to lift female labour-force participation, formalise the urban services workforce, and convert R&D spend — currently below 0.7% of GDP — into a meaningful innovation flywheel.
Comparative Perspective
India’s FY26 growth print sits at the top of the major-economy league table and meaningfully ahead of comparable Asian peers. China‘s growth is decelerating into a structurally lower band as the property cycle plays out and demographic headwinds bite, while Vietnam and Indonesia are both growing fast but from smaller bases and with greater external dependence. The instructive comparison is not the level of growth but the composition: India’s expansion is consumption-and-services-led, Vietnam’s is manufacturing-export-led, and Indonesia’s is increasingly commodity-and-nickel-processing-led.
| Country | Real GDP Growth, FY26 (or 2025 calendar year) | Source |
|---|---|---|
| India | 7.4% | Economic Survey 2025-26 |
| Vietnam | 6.5% | IMF World Economic Outlook, October 2025 |
| Indonesia | 5.1% | IMF World Economic Outlook, October 2025 |
| China | 4.6% | IMF World Economic Outlook, October 2025 |
| Bangladesh | 4.5% | World Bank South Asia Development Update |
| Brazil | 2.2% | IMF World Economic Outlook, October 2025 |
The structural insight from this table is that India is the only large Asian economy combining fast growth with a current account deficit narrower than 1.5% of GDP — the comparator economies either run surpluses (China, Vietnam) or deeper deficits (Indonesia in select quarters). This makes India’s external position less dependent on commodity tailwinds and more dependent on services-export resilience, which is itself a function of the pace and pricing of AI-driven outsourcing — an exposure the Survey acknowledges in the external sector chapter without fully resolving. A second insight worth flagging is that India’s growth premium over China has now widened to nearly 280 basis points, the largest gap in over three decades; if sustained for even five more years, this single arithmetic fact will rewire global supply-chain calculus, multilateral voting weights, and the trajectory of Indian per-capita income against the middle-income threshold defined by the World Bank.
Challenges and Criticisms
The 1.7% inflation print is not unambiguously good news. PRS Legislative Research, in its summary brief on the Survey, flags that food inflation has been volatile in both directions over the past 24 months and that the recent collapse owes more to a favourable base than to durable supply-side improvement. A reading too far below the lower tolerance band complicates the RBI’s communication: if disinflation deepens into deflation in any sub-component, monetary easing risks getting locked into a procyclical loop. The International Monetary Fund‘s most recent Article IV staff report raised a parallel concern — that India’s growth outperformance is masking weakness in private investment, which has not recovered to its pre-pandemic share of GDP despite four years of corporate-tax cuts.
The employment story remains the Survey’s softest flank, and the critique here cuts deeper than the inflation debate. Headline labour-force participation has improved in Periodic Labour Force Survey rounds, but the quality of jobs created — disproportionately self-employment and unpaid family work in rural areas — remains an open question that economists including Jean Drèze, Santosh Mehrotra and the Centre for Monitoring Indian Economy have argued the Survey papers over. Female labour-force participation, while rising, remains heavily concentrated in agriculture, and the urban formal-sector absorption rate is well below what a 7% growth economy would normally generate. The Survey acknowledges this in the social sectors chapter but treats it as a transition phenomenon rather than a structural failure. Azim Premji University‘s State of Working India 2024 report, which the Survey cites in passing, found that the share of regular wage workers with written contracts and social security has stagnated near 25% for nearly a decade — a finding hard to reconcile with a growth narrative that emphasises formalisation as the headline structural shift. Until the formal-sector hiring data and the Survey’s growth data move in the same direction, the gap between aggregate and lived experience will remain the document’s most stubborn vulnerability.
Fiscal arithmetic and external vulnerability complete the critique list. The 4.4% fiscal deficit target depends on disinvestment receipts that have repeatedly missed budget estimates, on buoyant GST collections sustaining double-digit growth, and on capex compression as a residual lever if revenue underperforms. On the external front, $701 billion in reserves looks invulnerable in absolute terms, but the share of short-term external debt to reserves has crept up over FY26, and a sudden reversal in foreign portfolio flows — triggered, say, by a hawkish surprise from the US Federal Reserve — could test market depth in ways the headline reserves number does not capture. The agriculture productivity gap deserves a separate mention: yields per hectare for staple cereals remain well below those of peer economies, and the Survey’s own data show that public investment in agricultural research and extension as a share of agricultural GDP has stagnated below 0.6% for over a decade — well below the 1% threshold recommended by the National Commission on Farmers chaired by M. S. Swaminathan. None of these risks is acute. All of them are visible in the data the Survey itself prints.
Prelims Pointers
- Economic Survey 2025-26 was tabled in Parliament on 29 January 2026 by Finance Minister Nirmala Sitharaman.
- The Survey is prepared by the Department of Economic Affairs, Ministry of Finance, under the Chief Economic Adviser.
- The current Chief Economic Adviser is V. Anantha Nageswaran (in office since 2022).
- The first Economic Survey was presented in 1950-51; it was de-linked from the Budget speech in 1964.
- Real GDP growth advance estimate for FY26 stands at 7.4%.
- Real GDP growth projection for FY27 is in the 6.8% to 7.2% band.
- Headline CPI inflation at 1.7% is the lowest since the 2014-base series began.
- India’s foreign exchange reserves crossed $701.4 billion in late January 2026.
- Fiscal deficit target for FY26 is 4.4% of GDP, set in Budget 2025-26.
- Current account deficit for FY26 is estimated at around 1.0% of GDP.
- FY26 sectoral growth: Agriculture 3.8%, Industry 6.5%, Services 8.4%.
- Services share of Gross Value Added now exceeds 54%; manufacturing share remains near 17%.
- Budget 2026-27 was presented on 1 February 2026, the day after the Survey was tabled.
- RBI’s flexible inflation targeting tolerance band is 2% to 6%, with a 4% midpoint.
- The Economic Survey is published in two volumes: thematic essays (Volume I) and sectoral chapters (Volume II).
Mains Practice Questions
- The Economic Survey 2025-26 records real GDP growth of 7.4% alongside CPI inflation at a series-low of 1.7%. Examine whether this combination represents a durable Goldilocks moment or a cyclical confluence, and discuss its implications for the Reserve Bank of India’s monetary stance. (15 marks)
- “India’s growth is services-led while its employment problem is agriculture-locked.” Critically analyse this statement in light of the sectoral evidence in the Economic Survey 2025-26. (15 marks)
- Discuss the institutional role of the Chief Economic Adviser and the Department of Economic Affairs in the preparation of the Economic Survey, and assess the document’s influence on Union Budget formulation. (10 marks)
- Foreign exchange reserves of $701 billion sit alongside a creeping share of short-term external debt. Evaluate the adequacy of India’s external position using both stock and flow indicators highlighted in Economic Survey 2025-26. (15 marks)
- The Production Linked Incentive scheme has yielded asymmetric outcomes across sectors. Analyse the achievements and limitations of PLI as documented in the Economic Survey 2025-26 and suggest a calibrated reform path. (15 marks)
- Examine the disinflation recorded in 2025-26 in the context of food prices, monetary policy transmission, and rural real wages. Does low headline inflation translate into welfare gains for the bottom quintile? (10 marks)
- Compare India’s FY26 growth trajectory with that of Vietnam, Indonesia and China, and identify the structural factors that explain India’s outperformance. (15 marks)
- Assess the Economic Survey 2025-26’s treatment of the climate-finance gap and the rollout of the National Green Hydrogen Mission as instruments of India’s energy transition. (10 marks)
Conclusion
What the Economic Survey 2025-26 reveals, read as a whole, is the maturation of an Indian growth model whose ingredients have been in place for a decade but whose macroeconomic stability has only recently arrived. Disinflation, a reserves stockpile that buys policy autonomy, fiscal consolidation that does not strangle capex, and a services-export engine that has decoupled from the China cycle — these are not unrelated phenomena, and the Survey treats them as a system. Whether that system can deliver job-rich growth, raise manufacturing’s share, and absorb the rural workforce is a separate, sharper question. The numbers in the document confirm the system; the chapters that ask the harder questions admit it has not yet delivered the answers.
For the year ahead, three watchpoints follow directly from the Survey. The first is the alignment between Survey priorities and the Budget 2026-27 expenditure pattern presented on 1 February 2026 — the test is whether agriculture extension, factor-market reform and green-hydrogen capex actually receive incremental allocation. The second is the trajectory of the RBI’s Monetary Policy Committee through 2026: with CPI at 1.7%, the burden of proof has shifted to those who would hold rates steady. The third is the FY27 growth print itself — if it lands at the upper end of the 6.8% to 7.2% band, the Survey’s framing of “recalibration not deceleration” is vindicated; if it lands below, the structural anxieties about private investment and employment quality become harder to dismiss.
For the aspirant, the line worth carrying into the answer booklet is that macroeconomic stability is necessary, not sufficient — Survey 2025-26 has documented the necessary; the next decade of Surveys will be judged on the sufficient.
Frequently Asked Questions
What is the Economic Survey 2025-26?
The Economic Survey 2025-26 is the Government of India’s annual diagnostic of the macroeconomy, tabled by Finance Minister Nirmala Sitharaman on 29 January 2026 — the day before the Union Budget. It’s prepared by the Department of Economic Affairs in the Ministry of Finance under the Chief Economic Adviser, V. Anantha Nageswaran.
What is the projected GDP growth for FY26 and FY27?
Real GDP growth for FY26 is estimated at 7.4% in the advance estimate. The FY27 projection is placed in a 6.8% to 7.2% band, supported by sustained capital expenditure, services exports, and easing inflation.
What does the Survey say about inflation?
Headline CPI inflation has fallen to 1.7% — the lowest reading recorded under the 2014-base CPI series. The drop is driven mainly by a collapse in food inflation after two strong monsoons, while core inflation sits closer to 3.5%, indicating contained demand-side pressure.
How large are India’s forex reserves as of January 2026?
India’s foreign exchange reserves crossed $701.4 billion in the week before the Survey’s tabling — a record stock equivalent to roughly twelve months of merchandise imports. That sits well above the eight-month adequacy benchmark cited by the IMF.
Who prepares the Economic Survey?
The Economic Survey is prepared by the Economic Division of the Department of Economic Affairs, Ministry of Finance, under the supervision of the Chief Economic Adviser. The current CEA is V. Anantha Nageswaran. Final editorial responsibility rests with the Finance Minister, who tables it in Parliament.
How is the Economic Survey different from the Union Budget?
The Economic Survey is an analytical document — it reviews the past year, projects the year ahead, and surveys the structural state of the economy. The Union Budget, presented under Article 112 as the Annual Financial Statement, is a binding statement of receipts and expenditure for the upcoming year. The Survey precedes the Budget by a day and informs but does not commit it.
What are the key reform priorities flagged in Economic Survey 2025-26?
The Survey emphasises sustained capital expenditure, deregulation under the Jan Vishwas framework, factor-market reforms in land and labour, deepening of MSME credit access, climate-aligned infrastructure under NDC 3.0, and a renewed push on agricultural productivity and pulses self-sufficiency.
Why is the Economic Survey important for UPSC?
The Economic Survey is one of the densest single-document sources for the GS-III economy syllabus and a frequent supplier of Prelims data points. It feeds essay paper data, interview economy questions, and GS-II budgetary procedure questions. Aspirants typically read Volume I in full for thematic essays and use Volume II as a sectoral reference.