GDP vs GNP: National Income Aggregates Explained
GDP counts what's produced inside the country; GNP counts what the country's people earn anywhere. One line of difference, called NFIA, separates them and decides every national income aggregate in the GS3 paper.
GDP stands for Gross Domestic Product and GNP stands for Gross National Product. GDP is the value of all final goods and services produced within a country’s territory; GNP is the value produced by a country’s residents anywhere in the world. The two are linked by one term, Net Factor Income from Abroad (NFIA), so GNP = GDP + NFIA. For India, GDP is larger than GNP, because NFIA is negative.
| Term | Full form | What it measures | Relation |
|---|---|---|---|
| GDP | Gross Domestic Product | Output within domestic territory, by anyone | Base aggregate |
| GNP | Gross National Product | Output by a country’s residents, anywhere | GDP + NFIA |
| NNP | Net National Product | National output after capital wear | GNP − depreciation |
| National Income | NNP at factor cost | Actual income earned by factors of production | NNP at MP − net indirect taxes |
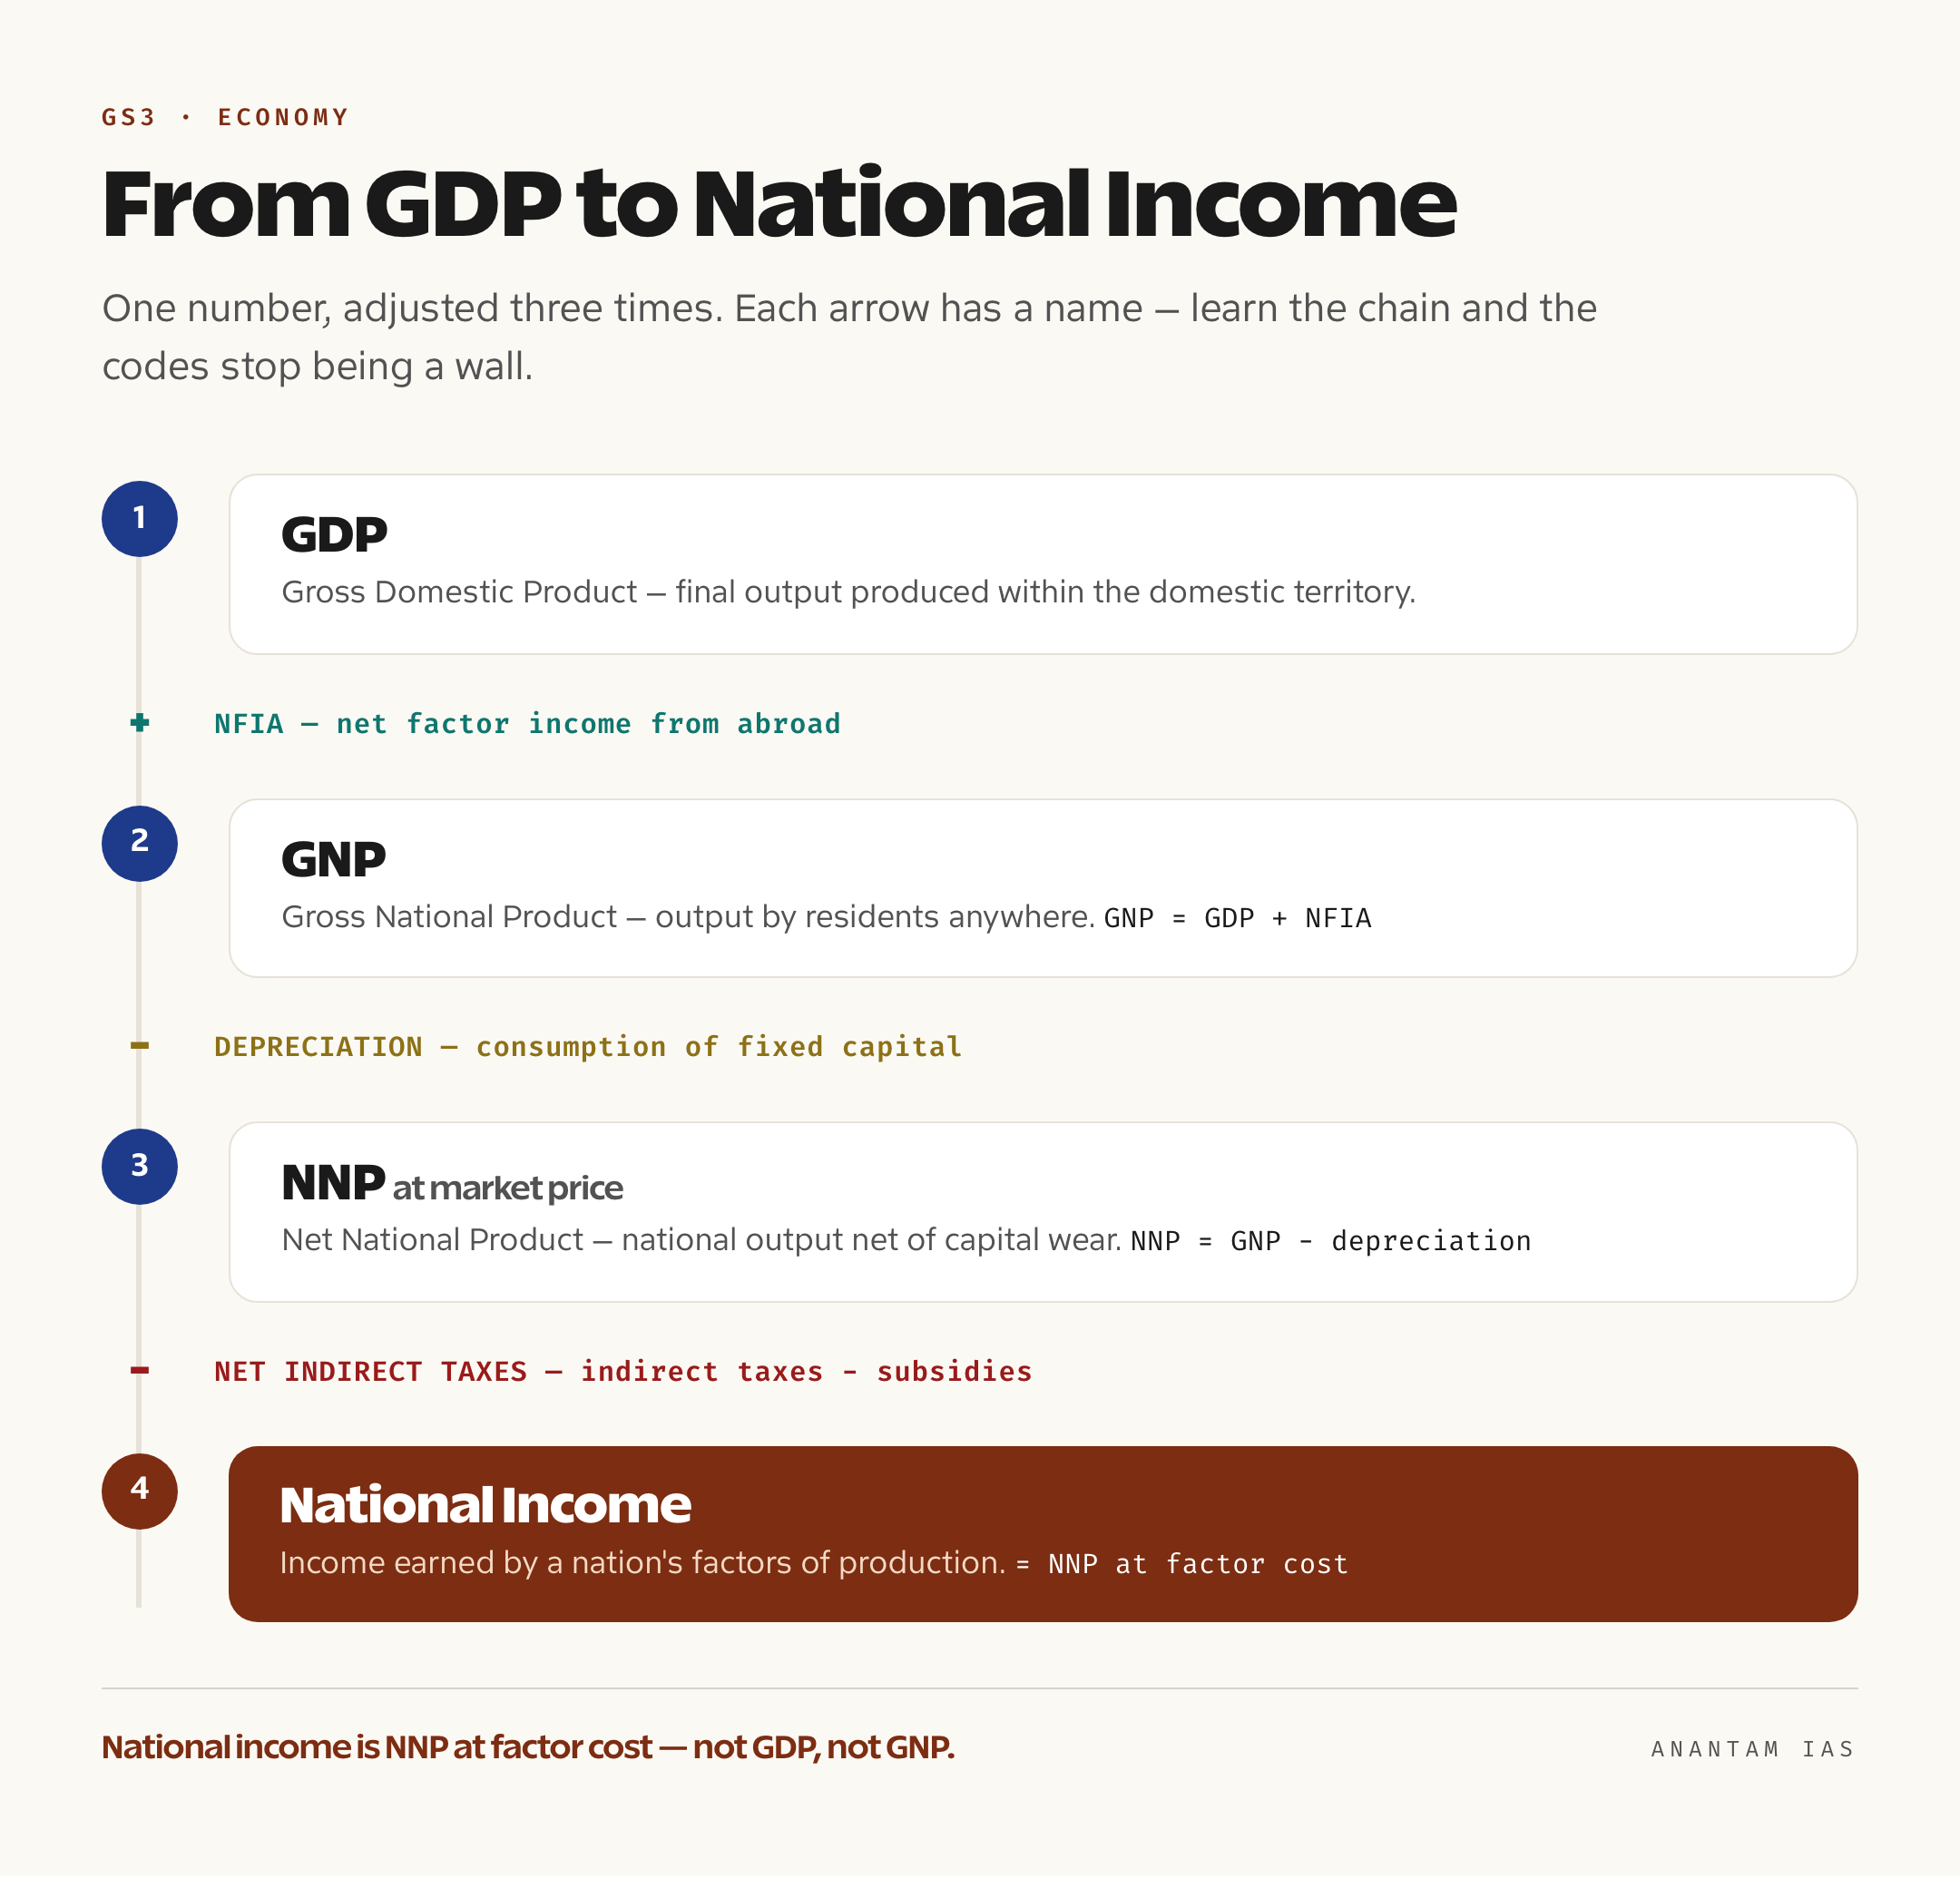
Most aspirants can recite that GDP stands for Gross Domestic Product and GNP for Gross National Product, and then freeze the moment a question asks which one is bigger for India, or whether national income is measured at market price or factor cost. The whole family of aggregates looks like a wall of three-letter codes, but it’s really one number adjusted four times. Start with what gets produced inside the country, then add what the country’s people earn outside it, then knock off wear and tear on machines, then strip out the taxes baked into prices. Each adjustment has a name, and that’s all GDP, GNP, NNP, NDP and national income actually are.
The reason this matters for UPSC is that it sits under almost everything in GS3 economy. Growth rates, the Economic Survey, fiscal deficit as a share of GDP, per-capita income comparisons, the debate over whether GDP even measures well-being, all of it assumes you can move cleanly between these aggregates. Prelims tests the definitions and the “which is greater” logic directly, and Mains expects you to use the right measure without being told. Get this one page right and the rest of the macro syllabus stops feeling like a guessing game.
What Each National Income Aggregate Actually Measures
Each aggregate answers one question: whose output, where, and after which deductions. GDP (Gross Domestic Product) is the money value of all final goods and services produced within a country’s domestic territory in a year, no matter who produces them. A Japanese-owned car factory in Tamil Nadu, a foreign bank’s branch in Mumbai, a migrant worker stitching shirts in Tiruppur, all of it counts in India’s GDP because the production happens on Indian soil. Territory is the only test.
GNP (Gross National Product) switches the test from territory to nationality. It’s the value of output produced by a country’s residents (its nationals) anywhere in the world. So GNP starts from GDP and then adds what Indians earn abroad while subtracting what foreigners earn inside India. That single adjustment has a name you must lock in: Net Factor Income from Abroad (NFIA).
So the first formula is the one everything else hangs on:
> GNP = GDP + NFIA, where NFIA = factor income earned by residents abroad − factor income earned by non-residents at home.
“Factor income” means income earned by the factors of production: wages for labour, interest on capital, rent on land, profit for enterprise. It does not include personal remittances sent home by a worker as a gift to family, those are transfers, not payment for a factor of production, and this distinction trips up almost everyone. NFIA is about salaries, interest, dividends and profits crossing borders, not money orders.
The next two aggregates are simpler. They just remove depreciation, the wear and tear on machines, buildings and equipment used up during the year (also called consumption of fixed capital). “Gross” means depreciation is still included; “Net” means it has been taken out. So:
> NDP (Net Domestic Product) = GDP − depreciation > NNP (Net National Product) = GNP − depreciation
Net measures are more honest about how much new value an economy actually added, because a country that produces a lot but lets its capital crumble isn’t truly richer. The catch is that depreciation is hard to estimate accurately, which is why headline numbers usually quote gross figures.
The last step converts the valuation from what buyers pay to what producers actually receive, which gives us national income. Here is the whole ladder in one table.
| Aggregate | Formula | What It Captures |
|---|---|---|
| GDP (at market price) | Value of final output within domestic territory | Production inside the country, by anyone |
| GNP (at market price) | GDP + NFIA | Production by residents, anywhere |
| NDP | GDP − depreciation | Domestic output net of capital wear |
| NNP (at market price) | GNP − depreciation | National output net of capital wear |
| National Income | NNP at factor cost = NNP at MP − net indirect taxes | Actual income earned by a nation’s factors of production |
The bottom row is the one examiners love: National Income = NNP at factor cost. Not GDP, not GNP, not NNP at market price. National income is specifically Net National Product valued at factor cost.
Market Price vs Factor Cost, and the Net Indirect Taxes Bridge
The difference between market price and factor cost is just the taxes and subsidies sitting inside a price. Market price (MP) is what you actually pay at the counter, taxes included. Factor cost (FC) is what the producer genuinely receives, after the government’s slice is removed and any subsidy is added back. The bridge between them is net indirect taxes.
> Factor Cost = Market Price − Net Indirect Taxes, where Net Indirect Taxes = Indirect Taxes − Subsidies.
A worked example makes it stick. Suppose a bag of fertiliser sells for 100 rupees at market price. The government has added 18 rupees of indirect tax (say GST) but also given the manufacturer an 8 rupee subsidy. Net indirect taxes here are 18 − 8 = 10 rupees. So the factor cost, what the producers, workers and capital actually earned, is 100 − 10 = 90 rupees. The 10 rupees was never income to any factor of production; it was a transfer to and from the state. That’s why national income, which measures factor earnings, is reported at factor cost.
This is also why the same aggregate can wear two labels. “GDP at market price” and “GDP at factor cost” differ by exactly net indirect taxes. India dropped headline GDP at factor cost in 2015 and moved to international practice, a point we’ll return to. The conversions are mechanical once you hold the bridge:
| Conversion | Operation |
|---|---|
| MP → FC | Subtract net indirect taxes |
| FC → MP | Add net indirect taxes |
| Gross → Net | Subtract depreciation |
| Domestic → National | Add NFIA |
Nominal vs Real GDP, and the GDP Deflator
There’s a second valuation problem that has nothing to do with taxes: prices keep rising, so a bigger GDP number doesn’t always mean more goods. Nominal GDP (also called GDP at current prices) values this year’s output at this year’s prices, so it swells with inflation even if the country produced exactly the same basket. Real GDP (GDP at constant prices) values output at the prices of a fixed base year, which strips inflation out and leaves only the genuine change in quantity produced.
The link between them is the GDP deflator, the broadest measure of economy-wide inflation:
> GDP Deflator = (Nominal GDP ÷ Real GDP) × 100.
In the base year, nominal and real GDP are equal by definition, so the deflator is exactly 100. If a country’s nominal GDP rose 11% but real GDP rose only 6%, the deflator tells you roughly 5% of that growth was just higher prices, not more stuff. When you read that India “grew 6.4%,” that’s almost always real GDP growth, because that’s the figure that reflects rising living standards rather than rising price tags. Our explainer on inflation unpacks how the deflator compares with the CPI and WPI, which is a favourite Prelims trap.
GDP vs GNP: Territory, Nationality, and Why India’s GDP Beats Its GNP
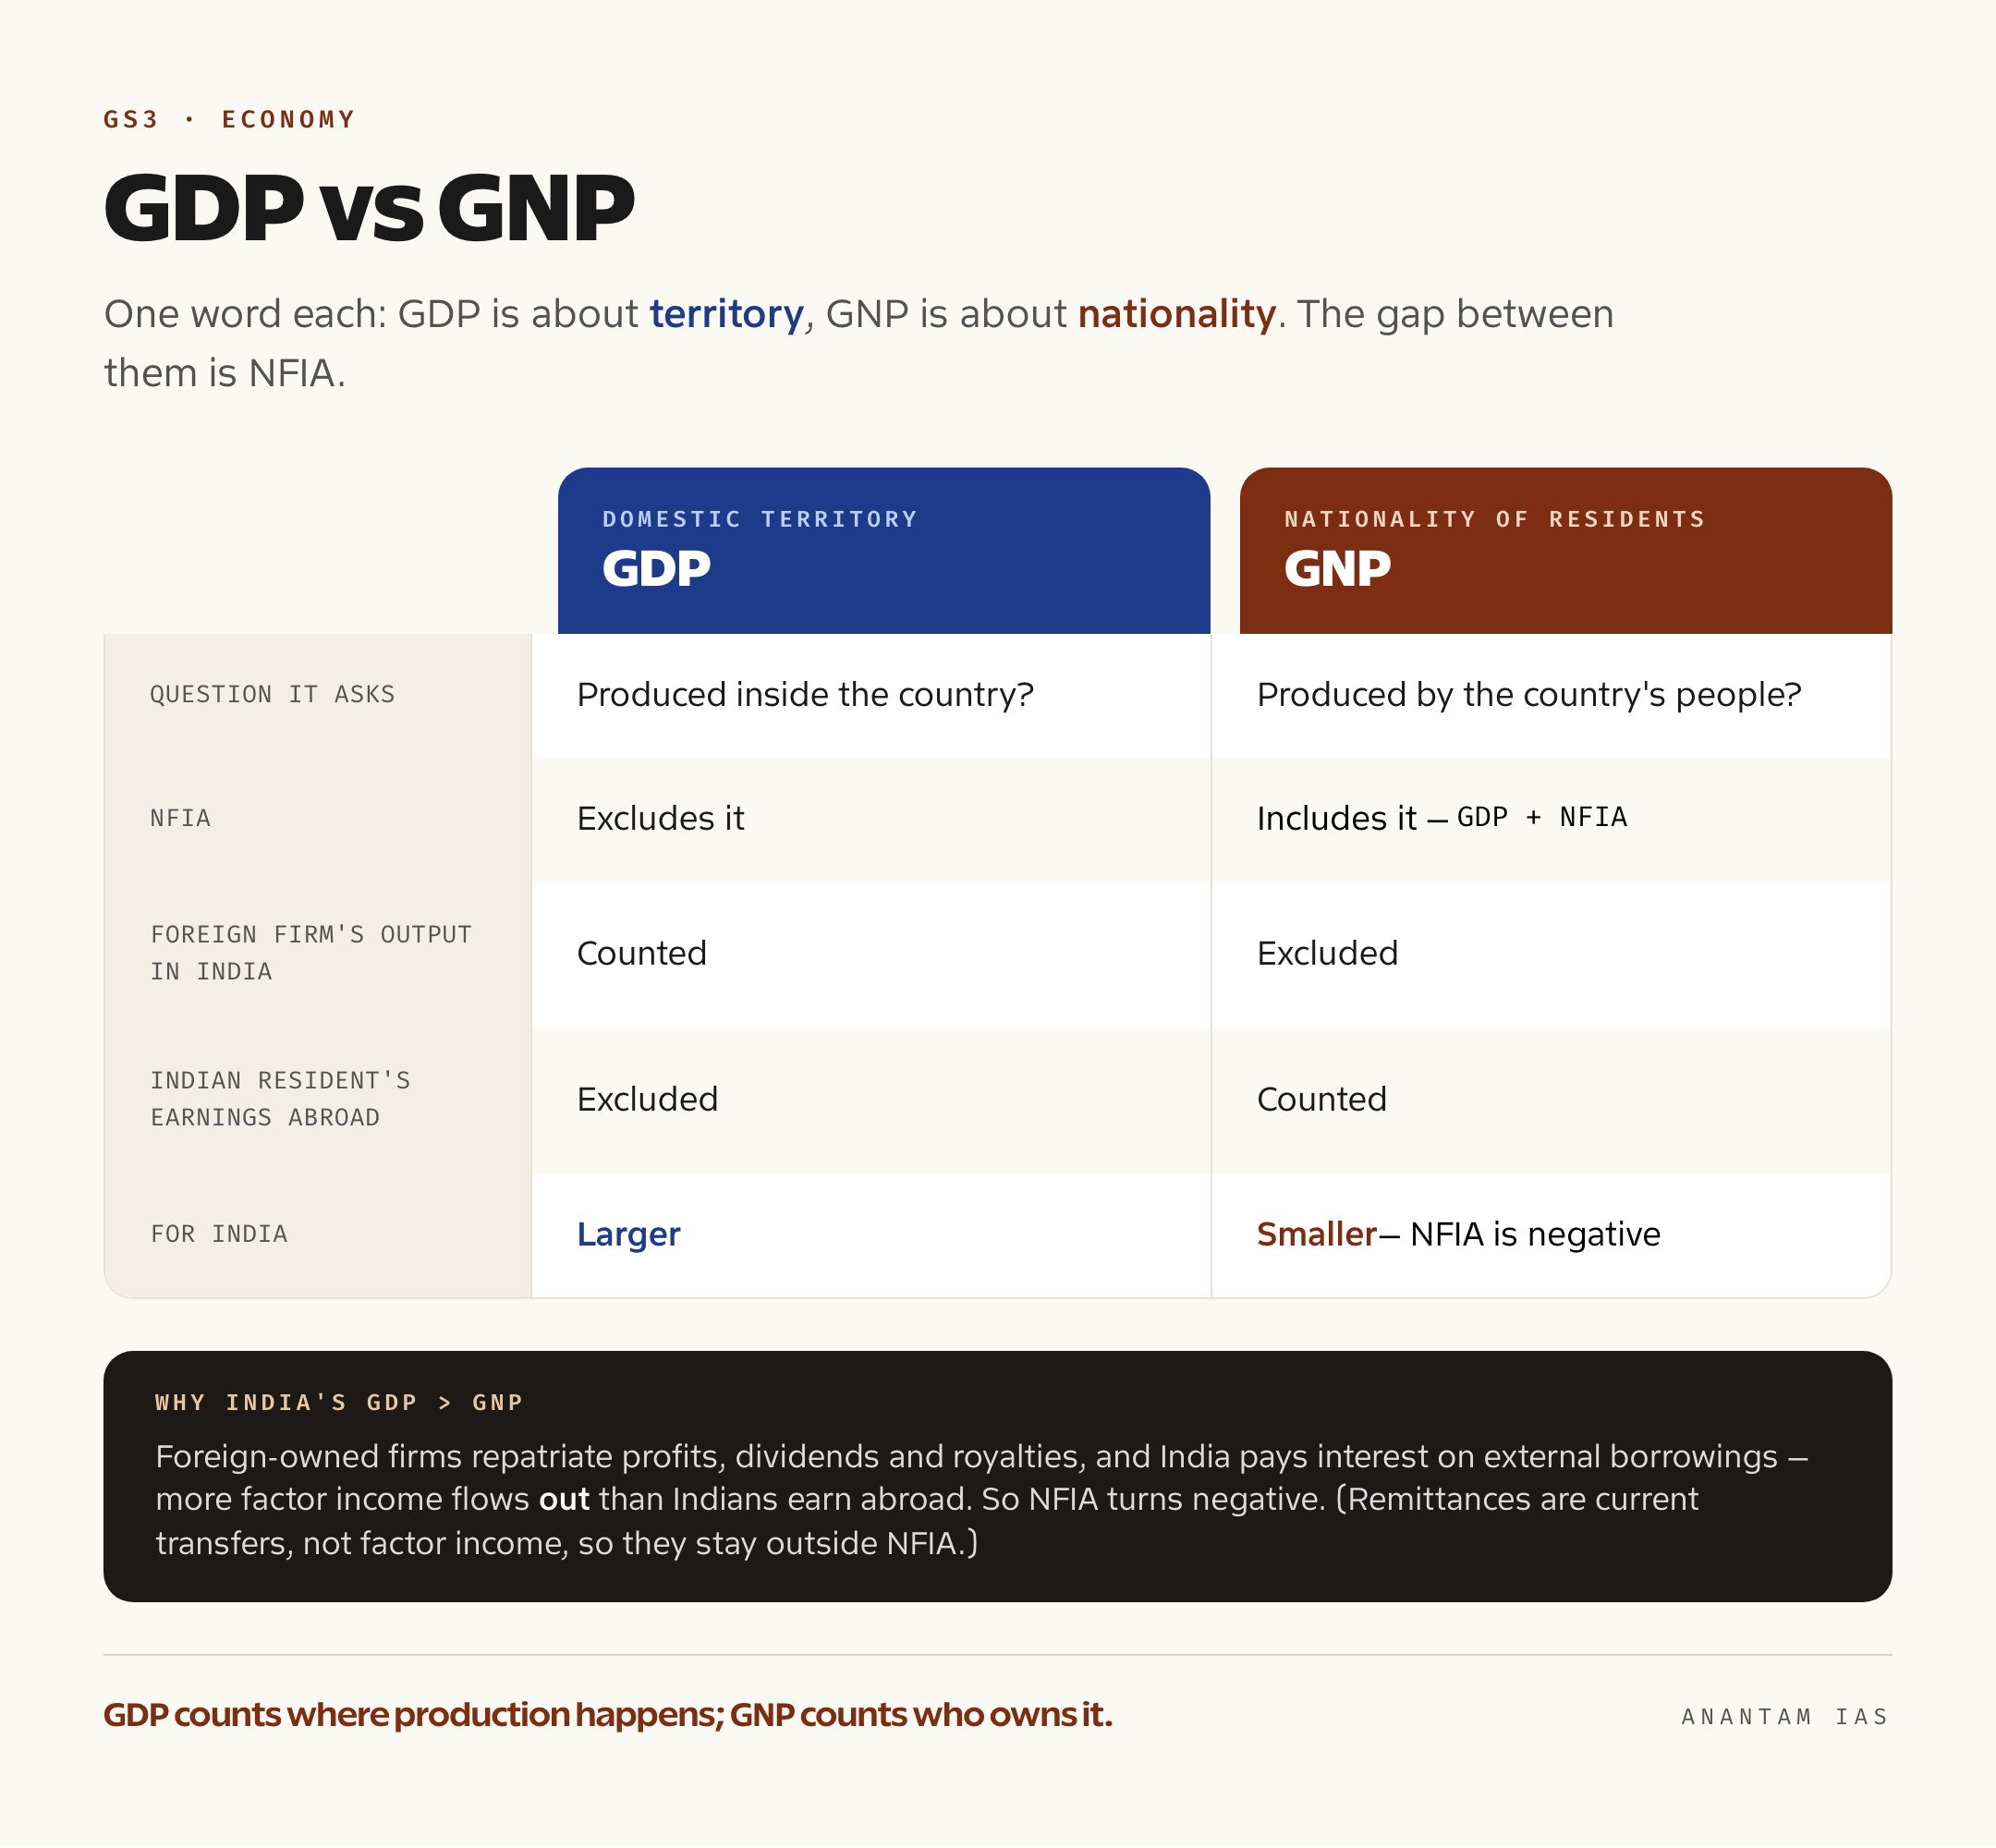
The cleanest way to keep GDP and GNP apart is one word each: GDP is about territory, GNP is about nationality. GDP asks “was it produced inside the country?” GNP asks “was it produced by the country’s people?” Everything else, including which one is larger, follows from NFIA being positive or negative.
When NFIA is positive, the country’s residents earn more abroad than foreigners earn inside it, so GNP exceeds GDP. Think of a country that exports skilled professionals and owns big foreign assets but hosts little foreign-owned industry. When NFIA is negative, foreigners earn more inside the country than its residents earn abroad, so GDP exceeds GNP. That second case is India.
India’s GDP is consistently greater than its GNP, which means India’s NFIA is negative. The reasons are worth understanding rather than memorising. India hosts a large stock of foreign direct investment, and the profits, dividends and royalties that foreign-owned firms repatriate are outflows of factor income. India also pays substantial interest on external borrowings and fees for foreign technology and services. Against these outflows, the factor income Indians genuinely earn abroad as wages, interest and profit is smaller. So more factor income flows out than flows in, NFIA turns negative, and GDP ends up larger than GNP.
A common student error is to assume India’s huge remittances, the world’s largest at over 100 billion dollars a year, must push NFIA positive. They don’t, because most remittances are current transfers (money a worker gifts home), not factor income for work done while a resident abroad, so they sit outside NFIA in the standard accounting. This is exactly the kind of subtlety Prelims uses to separate careful aspirants from rote learners. For the bigger picture of how these aggregates fit India’s macro story, see our overview of the Indian economy and the deeper walkthrough at national income.
Here is the comparison distilled:
| Basis | GDP | GNP |
|---|---|---|
| Core test | Domestic territory | Nationality (residents) |
| Question it answers | Produced inside the country? | Produced by the country’s people? |
| Treatment of NFIA | Excludes it | Includes it (GDP + NFIA) |
| Foreign firm’s output in India | Counted | Excluded |
| Indian resident’s earnings abroad | Excluded | Counted |
| For India | Larger | Smaller (NFIA is negative) |
Why GDP Isn’t Welfare: GVA, Green GDP and Per-Capita Income
GDP measures the size of the economy, not the well-being of the people in it, and conflating the two is the single biggest conceptual mistake in this topic. A country can post strong GDP growth while inequality widens, rivers turn toxic, and the median citizen feels no richer. GDP counts a rise in spending on hospital bills after a pollution disaster as growth, which tells you how blunt the instrument is. Several refinements exist precisely because of this gap.
Per-capita income divides national income by population, giving a rough sense of the average person’s slice. It’s a better welfare proxy than raw GDP, but it still hides distribution, two countries with identical per-capita income can have wildly different inequality. Green GDP attempts to subtract the cost of environmental degradation and resource depletion from conventional GDP, so that cutting down a forest doesn’t masquerade as pure gain. It remains hard to compute and isn’t a headline figure anywhere, but the concept appears regularly in GS3 sustainability questions.
The most important India-specific refinement is Gross Value Added (GVA). GVA measures output from the supply side, the value each sector adds, and is valued at basic prices (after production taxes and subsidies, but before product taxes like GST). The relationship is exact and examinable:
> GDP at market price = GVA at basic prices + product taxes − product subsidies.
In January 2015, the Central Statistics Office (now the National Statistical Office) under the Ministry of Statistics and Programme Implementation (MoSPI) overhauled the national accounts: it shifted the base year from 2004-05 to 2011-12, dropped the old “GDP at factor cost,” and adopted the global convention of presenting headline GDP at market prices while measuring sectoral output as GVA at basic prices. GVA is the preferred lens for judging which sectors, agriculture, manufacturing, services, are actually driving growth, because it’s cleaner of tax distortions. As of 2025, MoSPI has announced a fresh base-year revision (towards a more recent year such as 2022-23) to keep the series current, the kind of methodology update the Economic Survey typically flags.
How to Study This for UPSC
Master the ladder first, then the labels. The single most valuable thing you can do is be able to draw, from memory, GDP → (+NFIA) → GNP → (−depreciation) → NNP → (−net indirect taxes) → National Income. If you can write that chain and explain each arrow with a one-line reason, you can answer almost any objective question in this area by elimination. Memorise the three core formulae cold: GNP = GDP + NFIA, National Income = NNP at factor cost, and GDP Deflator = (Nominal ÷ Real) × 100.
For Prelims, the high-frequency traps are predictable. Expect “which is greater for India, GDP or GNP” (answer: GDP, because NFIA is negative); the remittances-versus-factor-income distinction; “national income equals which aggregate” (NNP at factor cost); and statements mixing up market price with factor cost. Practise the matching-and-statement format, because that’s how it’s set. NCERT macroeconomics (Class 12) is the right base text here, and a single careful reading of its national-income chapter beats five coaching PDFs. Skip the heavy derivation-style numericals unless you’re targeting the economics optional; the conceptual conversions are what GS demands.
For Mains, you rarely define these aggregates outright, but you must wield the right one without prompting. When you write about growth and well-being, reach for per-capita income, GVA and the GDP-isn’t-welfare critique rather than just quoting a GDP figure. When you discuss sectoral performance, cite GVA. When you discuss the fiscal deficit or external sector, anchor ratios to GDP. The examiner rewards the aspirant who knows that GDP is a measure, not a verdict.
Frequently Asked Questions
Is India’s GDP greater or smaller than its GNP? India’s GDP is greater than its GNP. That’s because India’s Net Factor Income from Abroad (NFIA) is negative: foreign-owned firms repatriate more profit and India pays more interest abroad than the factor income Indians earn overseas, so subtracting NFIA from GDP makes GNP smaller.
What is the difference between GDP and GNP in one line? GDP measures output produced within a country’s territory by anyone; GNP measures output produced by a country’s residents anywhere. The bridge between them is NFIA, since GNP = GDP + NFIA.
Which aggregate is national income equal to? National income equals NNP at factor cost, that is, Net National Product valued at factor cost. It’s GNP minus depreciation minus net indirect taxes, so it reflects the actual income earned by a nation’s factors of production.
Do remittances make India’s NFIA positive? Usually no. Most remittances are current transfers (money workers send home as gifts), not payment for a factor of production, so they’re recorded outside NFIA. India’s NFIA stays negative despite being the world’s largest remittance recipient.
What is the difference between market price and factor cost? Factor cost equals market price minus net indirect taxes, where net indirect taxes are indirect taxes minus subsidies. Market price is what the buyer pays; factor cost is what producers actually receive after the government’s tax slice is removed and subsidies are added back.
Practice Questions
Prelims MCQs
- Consider the following statements about India’s national income aggregates. (a) India’s GDP is greater than its GNP (b) India’s GDP is smaller than its GNP (c) India’s GDP is always equal to its GNP (d) The relationship cannot be determined. Answer: (a) Because India’s NFIA is negative, GNP (= GDP + NFIA) comes out smaller than GDP.
- Net National Product at factor cost is also known as: (a) Gross Domestic Product (b) National Income (c) Personal Income (d) Disposable Income. Answer: (b) National income is defined precisely as NNP at factor cost.
- The formula for converting market price to factor cost is: (a) MP + net indirect taxes (b) MP − net indirect taxes (c) MP − depreciation (d) MP + NFIA. Answer: (b) Factor cost removes net indirect taxes (indirect taxes minus subsidies) from market price.
- If a country’s nominal GDP is 110 and real GDP is 100, the GDP deflator is: (a) 10 (b) 100 (c) 110 (d) 90. Answer: (c) Deflator = (Nominal ÷ Real) × 100 = (110 ÷ 100) × 100 = 110, indicating 10% economy-wide price rise.
- Which of the following correctly relates GDP at market price and GVA at basic prices? (a) GDP at MP = GVA at basic prices + product taxes − product subsidies (b) GDP at MP = GVA − NFIA (c) GDP at MP = GVA − depreciation (d) GDP at MP = GVA + subsidies. Answer: (a) Adding product taxes and removing product subsidies converts GVA at basic prices to GDP at market price, the convention India adopted in 2015.
Mains Practice Questions
- Distinguish between GDP and GNP, and explain with reasons why India’s GDP consistently exceeds its GNP. (10 marks, 150 words)
- “GDP measures the size of an economy, not the welfare of its people.” Critically examine this statement with reference to Green GDP and per-capita income. (15 marks, 250 words)
- Explain the difference between market price and factor cost, and why national income is conventionally measured at factor cost. (10 marks, 150 words)
- Discuss the significance of the 2015 shift to GVA-based measurement and a 2011-12 base year in India’s national accounting. (15 marks, 250 words)
- Differentiate between nominal and real GDP, and explain the role of the GDP deflator as a measure of inflation. (10 marks, 150 words)
If you take only one thing from this page, take the ladder, because every aggregate is just GDP with one adjustment added or removed, and once that chain is automatic, the codes stop being a wall and start being a sentence you can read. The aspirants who struggle here are the ones who memorised five definitions in isolation; the ones who breeze through learned a single number that travels. Build the chain, drill the three formulae, and remember that GDP tells you how big the economy is, never how well its people are living. That distinction is what separates an answer that scores from one that simply reports.