Population Geography Measures: Fertility, Density and Dependency
Why crude rates mislead, the fertility measures in order of precision from CBR to net reproduction rate, population momentum, the three densities, dependency and the demographic dividend, and how India states its sex ratio.
Population geography measures look like arithmetic and behave like arguments. A crude rate can make a rich country look unhealthier than a poor one; a total fertility rate at replacement does not stop a population growing for another forty years; and the word density means at least three different things depending on what you divide by. Getting the definitions exact is what makes the comparisons defensible.
Why Crude Rates Mislead
The crude birth rate is live births per 1,000 population in a year and the crude death rate is deaths per 1,000. They are called crude because they take no account of the age and sex composition of the population underneath them.
The consequence is counter-intuitive and worth stating plainly: a rich, healthy, ageing country can have a higher crude death rate than a poor young one, because it has far more old people. Germany’s crude death rate exceeds India’s, and that tells you about age structure, not about health. Any comparison of mortality between countries has to be age-standardised or it means nothing.
Fertility Measures, in Order of Precision
- Crude birth rate: births per 1,000 of the whole population. Affected by age structure, so weakest for comparison.
- General fertility rate: births per 1,000 women of reproductive age. Better, since it uses the population actually at risk.
- Age-specific fertility rate: births per 1,000 women in each five-year age band. The raw material for everything below.
- Total fertility rate: the number of children a woman would bear if she passed through her reproductive years at current age-specific rates. Independent of age structure, which is why it is the standard measure.
- Gross reproduction rate: the same, counting daughters only. It measures replacement of the female generation but ignores mortality.
- Net reproduction rate: the gross rate adjusted for mortality before the end of the reproductive span. NRR = 1 is the exact statement of replacement.
This ordering matters. The familiar figure of 2.1 for replacement fertility is a shorthand for NRR = 1, and it is valid only under low mortality and a normal sex ratio at birth. Where child mortality is high, replacement fertility is higher than 2.1. Where the sex ratio at birth is distorted, it shifts again. India’s total fertility rate stood at 2.0 in the National Family Health Survey 5, which is below replacement.
Population Momentum
Population momentum is the continued growth of a population for decades after fertility has fallen to replacement level. It is not a paradox and it is not a lag in the data. It is a consequence of age structure.
A country with a recent history of high fertility has a very large cohort already born and moving toward reproductive age. Even if each of those people has only enough children to replace themselves, the sheer number of them produces more births than deaths for a generation or more. India’s population will continue rising into the 2060s despite fertility already being below replacement, and momentum is the entire explanation.
Fertility decides the long run. Age structure decides the next forty years.
The Three Densities
Density is the measure most often used loosely, and the three versions answer different questions.
| Measure | Divide population by | What it reveals |
|---|---|---|
| Arithmetic density | Total land area | Crude crowding; conceals uninhabitable land entirely |
| Physiological density | Cultivated area | Pressure on the productive resource |
| Agricultural density | Cultivated area, using only the agricultural population | Pressure from farming specifically, separating a crowded field from a crowded city |
Egypt is the standard demonstration: its arithmetic density is unremarkable because most of the country is desert, while its physiological density is among the highest on earth because almost everyone lives on the Nile strip. In India the same contrast appears between Rajasthan and Bihar, and between rural Kerala and rural Punjab.
Age Structure and Dependency
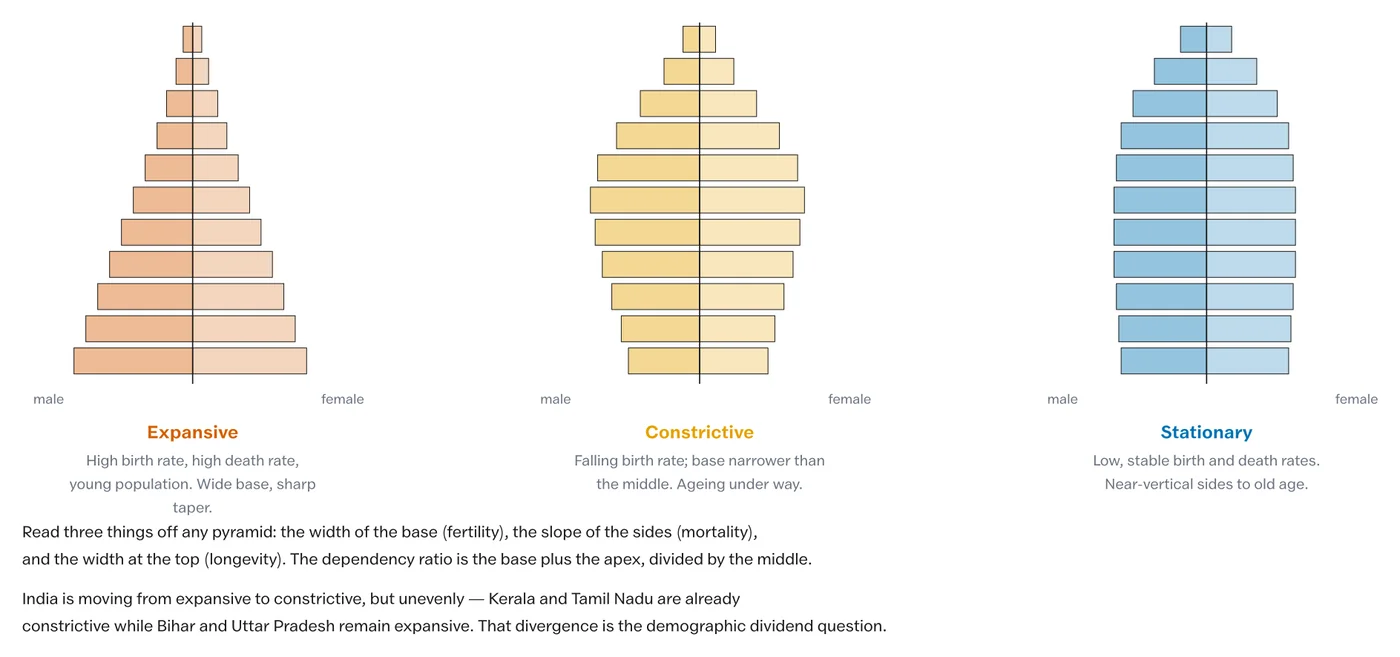
The dependency ratio sets the population below 15 and above 59, or above 64 depending on the convention, against the working-age population between. Two refinements are worth carrying.
- It separates into child dependency, which falls first during the demographic transition, and old-age dependency, which rises last. A falling total dependency ratio can conceal a rising old-age component.
- It assumes everyone of working age works, which is a poor assumption where female labour force participation is low. India’s effective dependency is therefore considerably higher than its demographic dependency ratio suggests.
The demographic dividend is the economic gain available while the working-age share is high and dependency low. It is a potential rather than an outcome: realising it requires employment, skills, health and female participation, and the window closes as the population ages.
Sex Ratio
India states the sex ratio as females per 1,000 males, which is the reverse of international practice, and getting the direction wrong inverts the entire interpretation.
- The sex ratio at birth is biologically stable at about 105 male births per 100 female. A departure indicates prenatal sex selection rather than natural variation.
- The child sex ratio, for the 0 to 6 age group, was 919 in Census 2011. It is the leading indicator, because a deficit in that cohort reappears as an adult deficit two decades later.
- The overall sex ratio was 943 in Census 2011, and it reflects sex selection, differential child mortality, differential adult mortality and, at state level, male-dominated migration.
That last factor is why a state’s sex ratio is not a clean index of gender equity: Kerala’s high figure partly reflects male out-migration, and several industrial districts show low figures for the same reason in reverse.
Practice Questions
Prelims
1. The net reproduction rate differs from the gross reproduction rate in that it accounts for
- (a) male births
- (b) migration
- (c) mortality during the reproductive span
- (d) age at marriage
Answer: (c)
2. A total fertility rate of 2.1 is described as replacement level because it corresponds to
- (a) zero population growth immediately
- (b) a net reproduction rate of 1
- (c) a crude birth rate equal to the crude death rate
- (d) a stable age structure
Answer: (b)
3. Physiological density is population divided by
- (a) total area
- (b) cultivated area
- (c) built-up area
- (d) forested area
Answer: (b)
4. Population momentum explains why
- (a) fertility falls with income
- (b) a population keeps growing after reaching replacement fertility
- (c) crude death rates rise with development
- (d) sex ratios vary between states
Answer: (b)
5. The child sex ratio recorded in Census 2011 was
- (a) 943
- (b) 933
- (c) 919
- (d) 905
Answer: (c)
Mains
- Distinguish between crude, general and age-specific fertility rates and state the advantage of each. (10 marks)
- Explain population momentum and its implications for India’s population projections. (10 marks)
- Differentiate between arithmetic, physiological and agricultural density with examples. (10 marks)
- “The demographic dividend is a potential, not an outcome.” Examine this statement for India. (15 marks)
- Discuss the factors underlying India’s sex ratio, and explain why a state’s figure is not a clean index of gender equity. (20 marks)