Poverty Rate in India: Estimates, Methods, and Policy Context
How poverty in India is measured and where it stands now — the latest World Bank, NITI Aayog MPI and HCES estimates, the debates behind them, and the schemes driving the decline, explained for UPSC.
The poverty rate in India is one of the most debated statistics in development economics, reflecting decades of growth, welfare expansion, and methodological change. Different agencies – the World Bank, NITI Aayog, and independent researchers – report different figures depending on the poverty line, the data source, and whether poverty is measured in monetary or multidimensional terms. The latest estimates point in one direction: extreme income poverty has fallen to historic lows – the World Bank now puts it at just 2.3% for 2022-23 – and multidimensional deprivation has declined faster than at any other phase in India's history. For UPSC aspirants, understanding the numbers is inseparable from understanding the measurement frameworks – and the debates around them.
Understanding Poverty and Its Measurement
Poverty is the inability to meet a minimum standard of living. India has historically used two measurement traditions.
- Income/consumption poverty: Based on a monetary threshold (poverty line).
- Multidimensional poverty: Based on deprivations across health, education, and living standards.
Key milestones in India's measurement:
- Dadabhai Naoroji first estimated poverty in his 1901 work Poverty and Un-British Rule in India.
- Planning Commission Task Force (1979) used calorie norms: 2400 kcal rural, 2100 kcal urban.
- Lakdawala Committee (1993), Tendulkar Committee (2009), and Rangarajan Committee (2014) progressively updated the methodology.
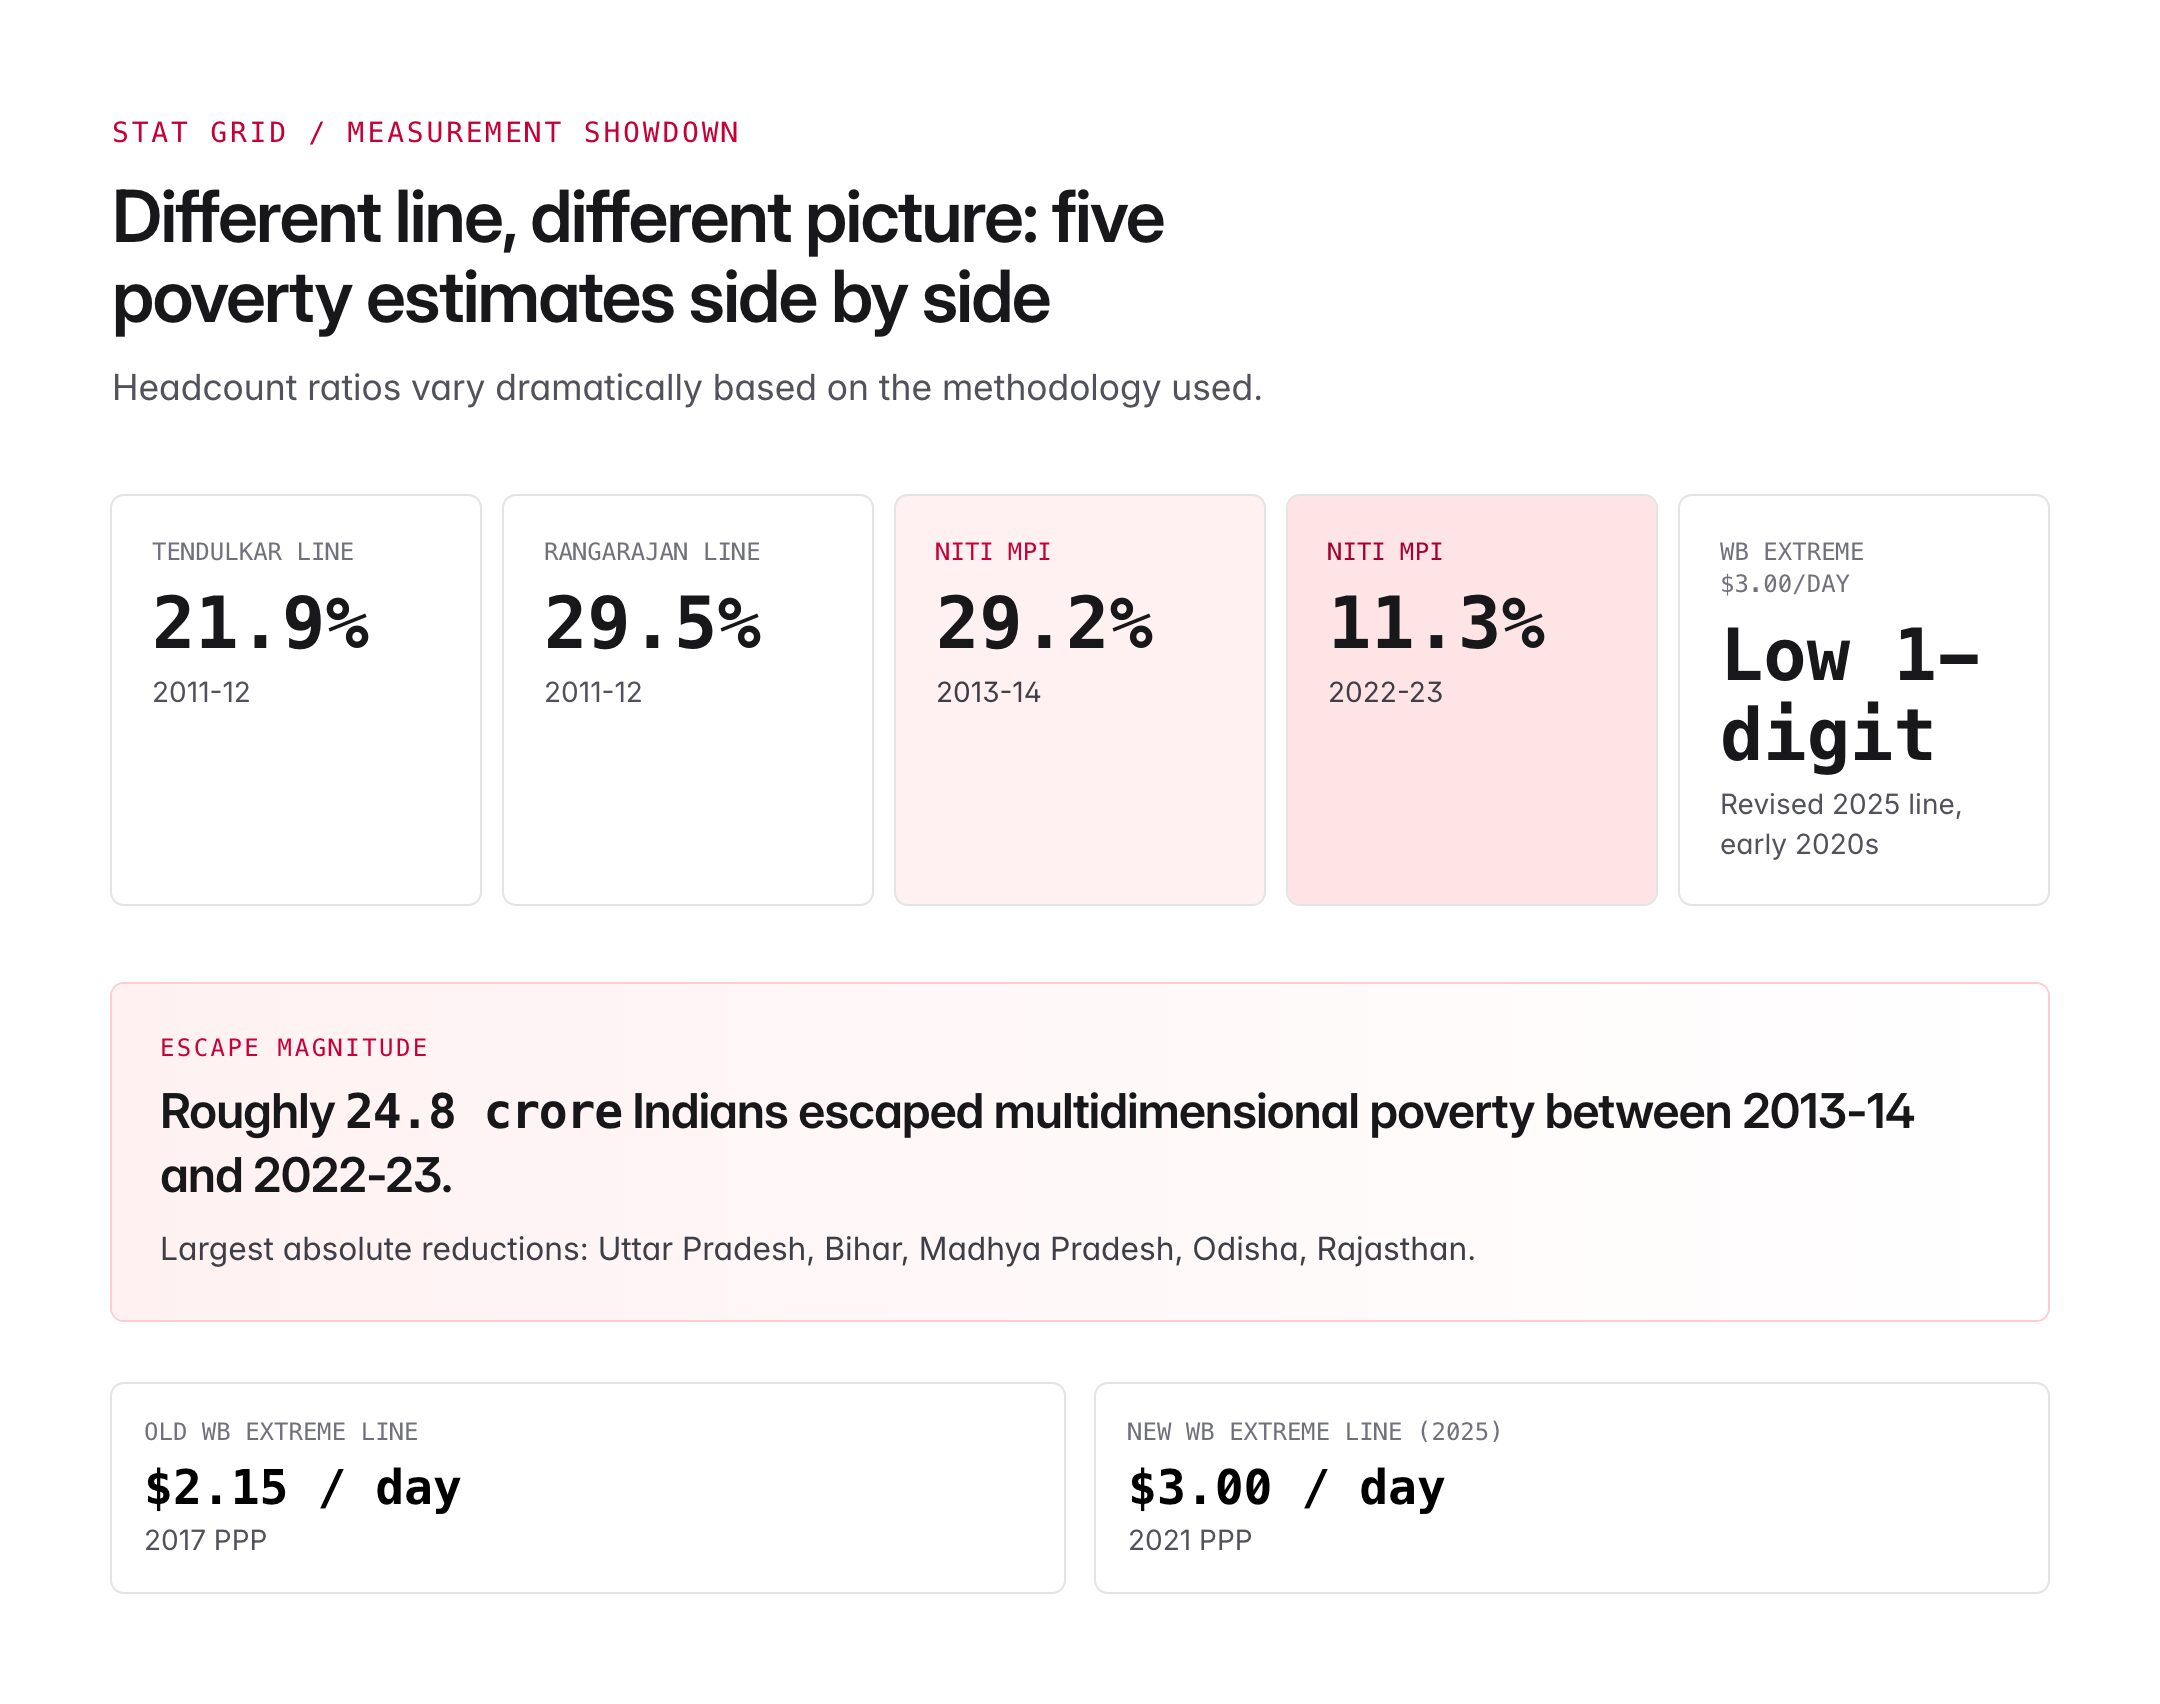
- The Tendulkar line estimated 21.9% poverty in 2011-12; the Rangarajan line put it at 29.5% for the same year.
- India's official poverty line has not been updated since, in the absence of comparable consumption expenditure surveys between 2011-12 and 2022-23.
Global and National Estimates: Where India Stands
World Bank extreme poverty
The World Bank sets international poverty lines and updates them as new price data arrive – most recently revising them to 2021 PPP.
- Extreme poverty line: $2.15/day (2017 PPP), since updated to $3.00/day (2021 PPP).
- At the older $2.15 line, the World Bank's Poverty & Equity Brief finds India's extreme poverty fell from 16.2% in 2011-12 to 2.3% in 2022-23 – roughly 171 million people lifted above the line.
- Under the new $3.00/day (2021 PPP) line, the rate works out to about 5.3% for 2022-23 (down from 27.1% in 2011-12).
- At the lower-middle-income line ($3.65/day, 2017 PPP), a much larger share remains vulnerable – about 28.1%, down from 61.8%.
- The rural-urban gap has narrowed sharply: rural extreme poverty fell from 18.4% to 2.8% and urban from 10.7% to 1.1%.
More recent work using the 2023-24 Household Consumption Expenditure Survey (HCES) points the same way: an SBI Research analysis estimated rural poverty at about 4.9% and urban poverty near 4.1% in 2023-24, and some economists now place extreme poverty close to 1%. These numbers are contested – the consumption survey changed its methodology, so cross-year comparisons should be read with care.
NITI Aayog Multidimensional Poverty Index (MPI)
India's National MPI is published by NITI Aayog in partnership with OPHI and UNDP, adapted from the global MPI.
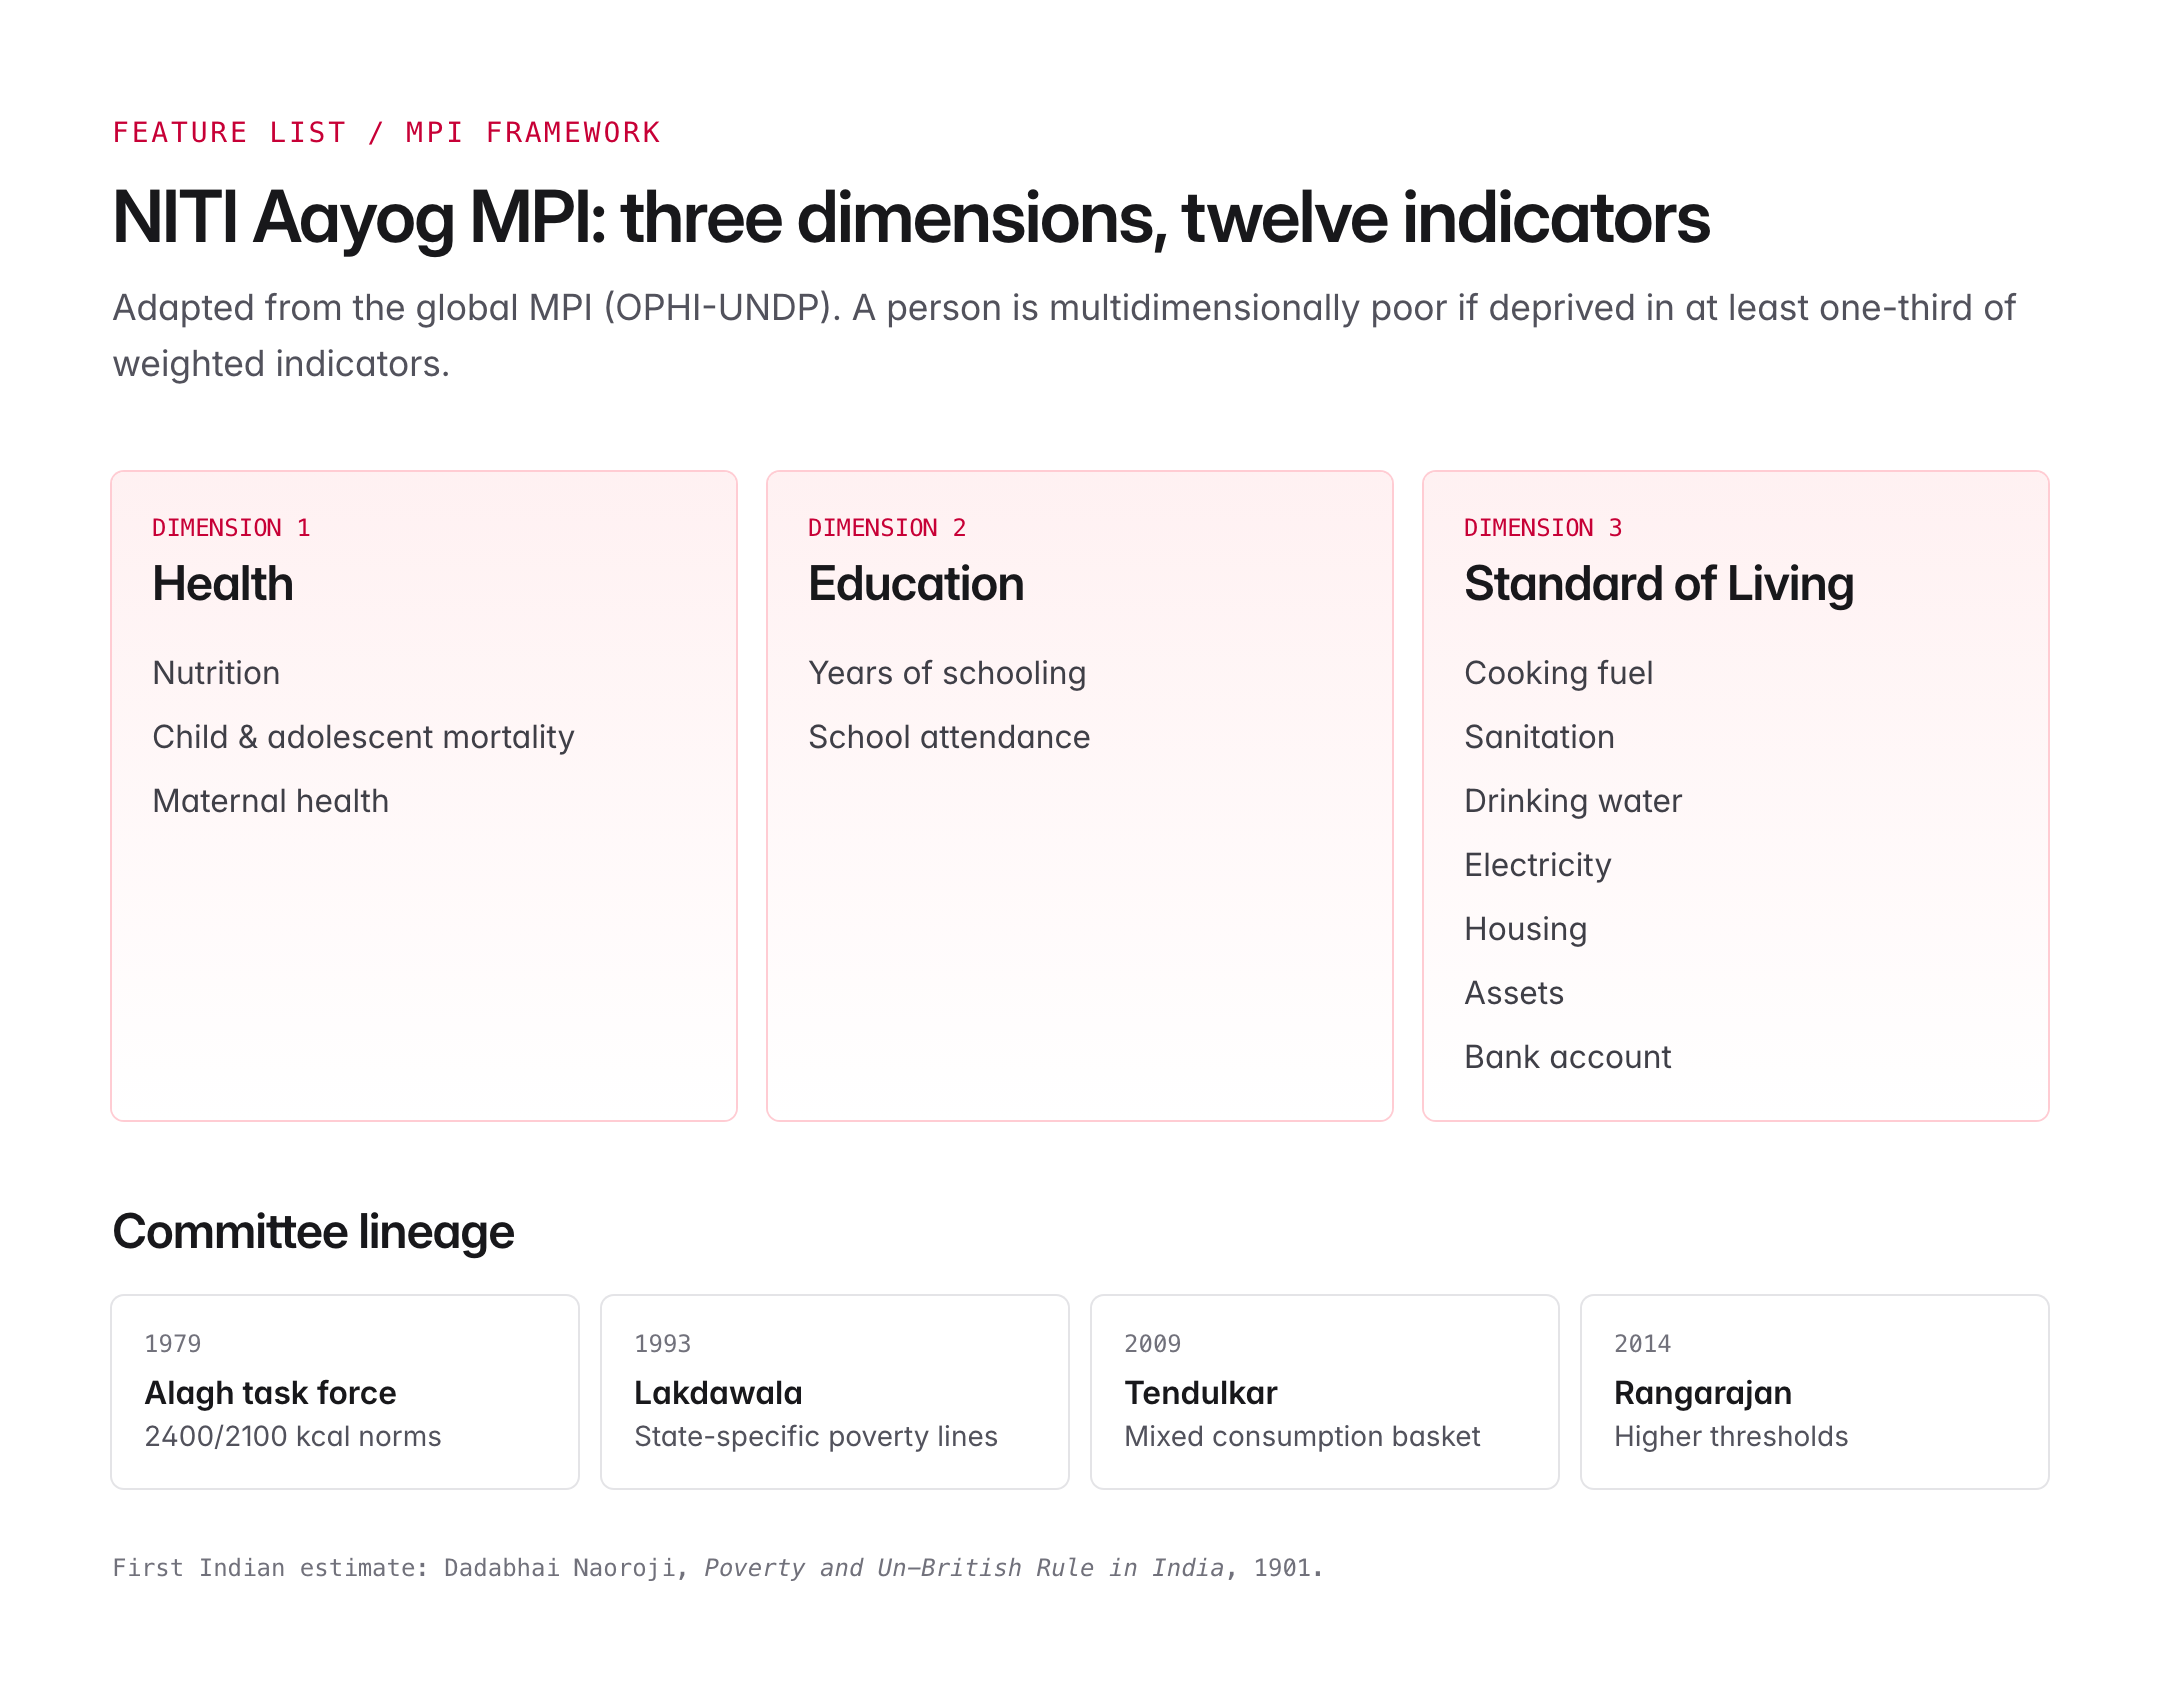
- It uses 12 indicators across three dimensions: Health, Education, and Standard of Living.
- Indicators include nutrition, child and adolescent mortality, maternal health, schooling years, school attendance, cooking fuel, sanitation, drinking water, electricity, housing, assets, and bank accounts.
- A person is multidimensionally poor if deprived in at least one-third of weighted indicators.
According to NITI Aayog discussion papers and subsequent updates:
- MPI headcount fell from about 29.2% in 2013-14 to 11.3% in 2022-23.
- Roughly 24.8 crore Indians escaped multidimensional poverty over the same period.
- States such as Uttar Pradesh, Bihar, Madhya Pradesh, Odisha, and Rajasthan recorded the largest absolute reductions.
- Subsequent NITI Aayog updates suggest the MPI headcount has continued to decline since 2022-23, on the back of the same welfare push.
Drivers of Falling Poverty
Several interconnected factors have driven the decline in poverty.
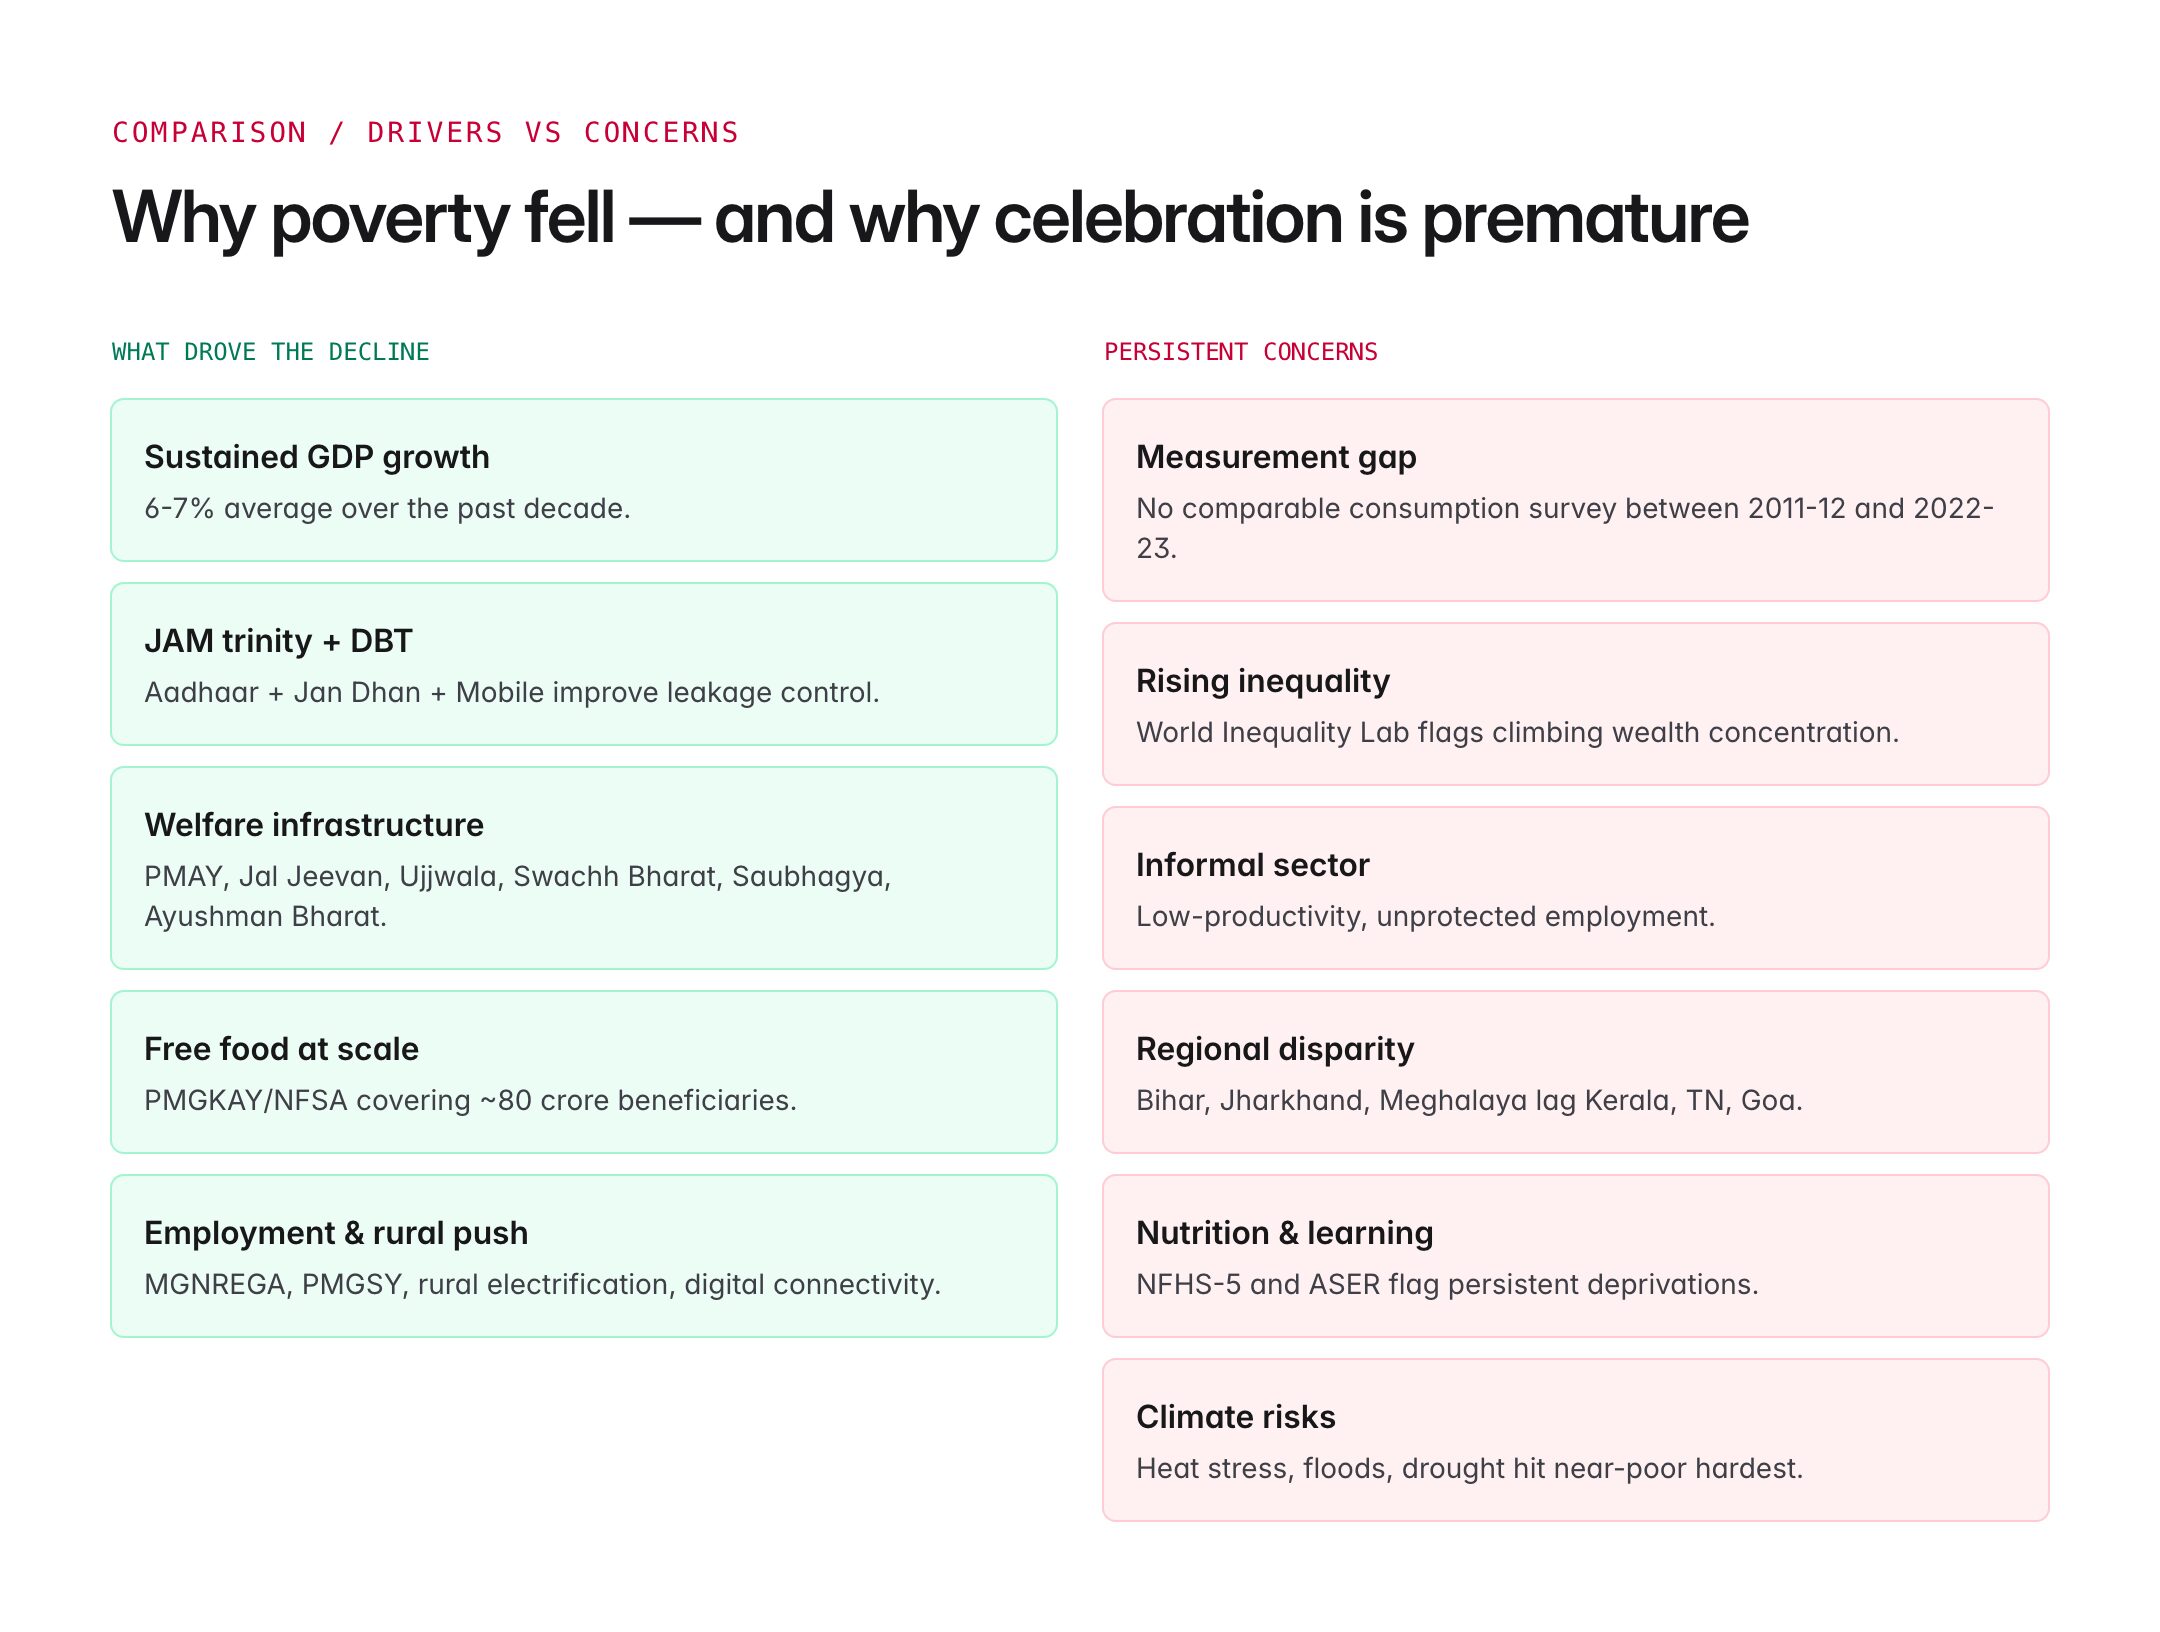
- Sustained GDP growth averaging 6-7% over the past decade.
- Expansion of welfare schemes: PMAY (housing), Jal Jeevan Mission (tap water), Ujjwala Yojana (LPG), Swachh Bharat Mission (sanitation), Saubhagya (electricity), Ayushman Bharat (health insurance).
- Direct Benefit Transfer (DBT), powered by Aadhaar, Jan Dhan accounts, and mobile penetration (the "JAM trinity"), improving leakage control.
- Free food distribution under PMGKAY/NFSA covering roughly 80 crore beneficiaries.
- Rural infrastructure: Roads (PMGSY), rural electrification, digital connectivity.
- Employment support through MGNREGA and expanded self-employment credit.
- Urbanisation and structural shift of labour from agriculture to services and construction.
Persistent Concerns
Despite the progress, several concerns cloud a purely optimistic reading.
- Measurement and comparability: The decade-long gap in consumption data between 2011-12 and 2022-23, plus the new methodology of the 2022-23 and 2023-24 Household Consumption Expenditure Surveys (HCES), makes clean comparison hard – and several economists argue the headline fall in poverty is overstated.
- Inequality: Reports by the World Inequality Lab and others show rising income and wealth inequality even as absolute poverty falls.
- Informal sector vulnerability: A large share of workers remain in low-productivity, unprotected employment.
- Regional disparity: States like Bihar, Jharkhand, and Meghalaya still report far higher MPI headcounts than Kerala, Tamil Nadu, or Goa.
- Nutrition and learning deprivations persist, as seen in NFHS-5 and ASER reports.
- Climate risks: Heat stress, floods, and droughts disproportionately hurt the poor and near-poor.
Regional and Social Dimensions
National averages hide sharp gaps. Poverty in India is concentrated by both geography and social group, which is why state- and community-level data matter as much as the headline rate.
By state (NITI Aayog MPI), the spread is enormous – from under 1% in Kerala to roughly a third of the population in Bihar:
| Highest poverty (MPI %) | Lowest poverty (MPI %) |
|---|---|
| Bihar — 33.8 | Kerala — 0.55 |
| Jharkhand — 28.8 | Tamil Nadu — 2.20 |
| Meghalaya — 27.8 | Sikkim — 2.60 |
| Madhya Pradesh — 20.6 | Goa — 3.76 |
| Uttar Pradesh — 17.4 | Punjab — 4.75 |
The BIMARU states (Bihar, Madhya Pradesh, Rajasthan, Uttar Pradesh) – joined by Jharkhand, Chhattisgarh and Odisha – still account for the bulk of India's poor.
By social group, poverty tracks the old hierarchy. MPI incidence is highest among Scheduled Tribes and falls steadily across groups:
| Group | MPI incidence (approx.) |
|---|---|
| Scheduled Tribes | ~30% |
| Scheduled Castes | ~20% |
| OBCs | ~15% |
| Others | ~6% |
Tribal poverty is disproportionately concentrated in forest and hill districts – which is why area-based and group-targeted efforts (the Aspirational Districts Programme, and PM-JANMAN for particularly vulnerable tribal groups) matter alongside the national schemes below.
Comparative Snapshot
| Estimate | Year | Approximate Headcount |
|---|---|---|
| Tendulkar poverty line | 2011-12 | 21.9% |
| Rangarajan poverty line | 2011-12 | 29.5% |
| NITI Aayog MPI | 2013-14 | 29.2% |
| NITI Aayog MPI | 2022-23 | 11.3% |
| World Bank extreme poverty ($2.15/day, 2017 PPP) | 2022-23 | 2.3% |
| World Bank extreme poverty ($3.00/day, 2021 PPP) | 2022-23 | 5.3% |
| World Bank lower-middle-income line ($3.65/day) | 2022-23 | 28.1% |
| SBI Research (HCES 2023-24) | 2023-24 | ~4-5% (rural/urban) |
(Exact figures vary by publication; students should cite the specific source, year, and methodology.)
Government Schemes and Policy Architecture
The policy architecture targeting poverty in India rests on several pillars:
- Food security: NFSA 2013, PDS, PM Garib Kalyan Anna Yojana, PM-POSHAN mid-day meals.
- Employment: MGNREGA (rural), DAY-NRLM, DAY-NULM (urban), Skill India, PMKVY.
- Housing and basic services: PMAY-G and PMAY-U, Jal Jeevan Mission, Swachh Bharat, Saubhagya, Ujjwala.
- Health and nutrition: Ayushman Bharat PM-JAY, Poshan Abhiyaan, Anaemia Mukt Bharat.
- Financial inclusion: PMJDY, MUDRA, Atal Pension Yojana, Jeevan Jyoti/Suraksha Bima.
- Education: Samagra Shiksha, NEP 2020, free textbooks, scholarships for SC/ST/OBC.
The emerging policy frontier focuses on quality of services, nutritional outcomes, learning levels, climate resilience, and formalisation of employment.
UPSC Relevance
Prelims focus:
- Major poverty committees: Dandekar and Rath, Alagh, Lakdawala, Tendulkar, Rangarajan.
- NITI Aayog MPI: 12 indicators, 3 dimensions, OPHI-UNDP framework.
- World Bank international poverty lines and recent revisions.
- JAM trinity, major welfare schemes, NFSA coverage.
Mains GS-I and GS-II angles:
- Issues related to poverty and hunger (GS-I Indian Society).
- Government schemes and their effectiveness (GS-II).
- Inclusive growth, data gaps, and measurement controversies (GS-III).
- Linking poverty with health, nutrition, education, and climate vulnerability.
Sample PYQ angle: "How do you explain the statistics that show that the Saving rate in India is rising rapidly but the Household saving rate is declining? What is its implication?" or "Despite steady economic growth, poverty and malnutrition remain persistent challenges in India. Examine." Students should anchor answers in the latest NITI Aayog MPI and World Bank data, while flagging methodological debates.