Census of India: History, Data & UPSC Notes
Census of India — history, significance, Census 2021 status, population data, key findings, Registrar General, and UPSC-relevant notes on Indian census.
Census of India: History, Data & UPSC Notes
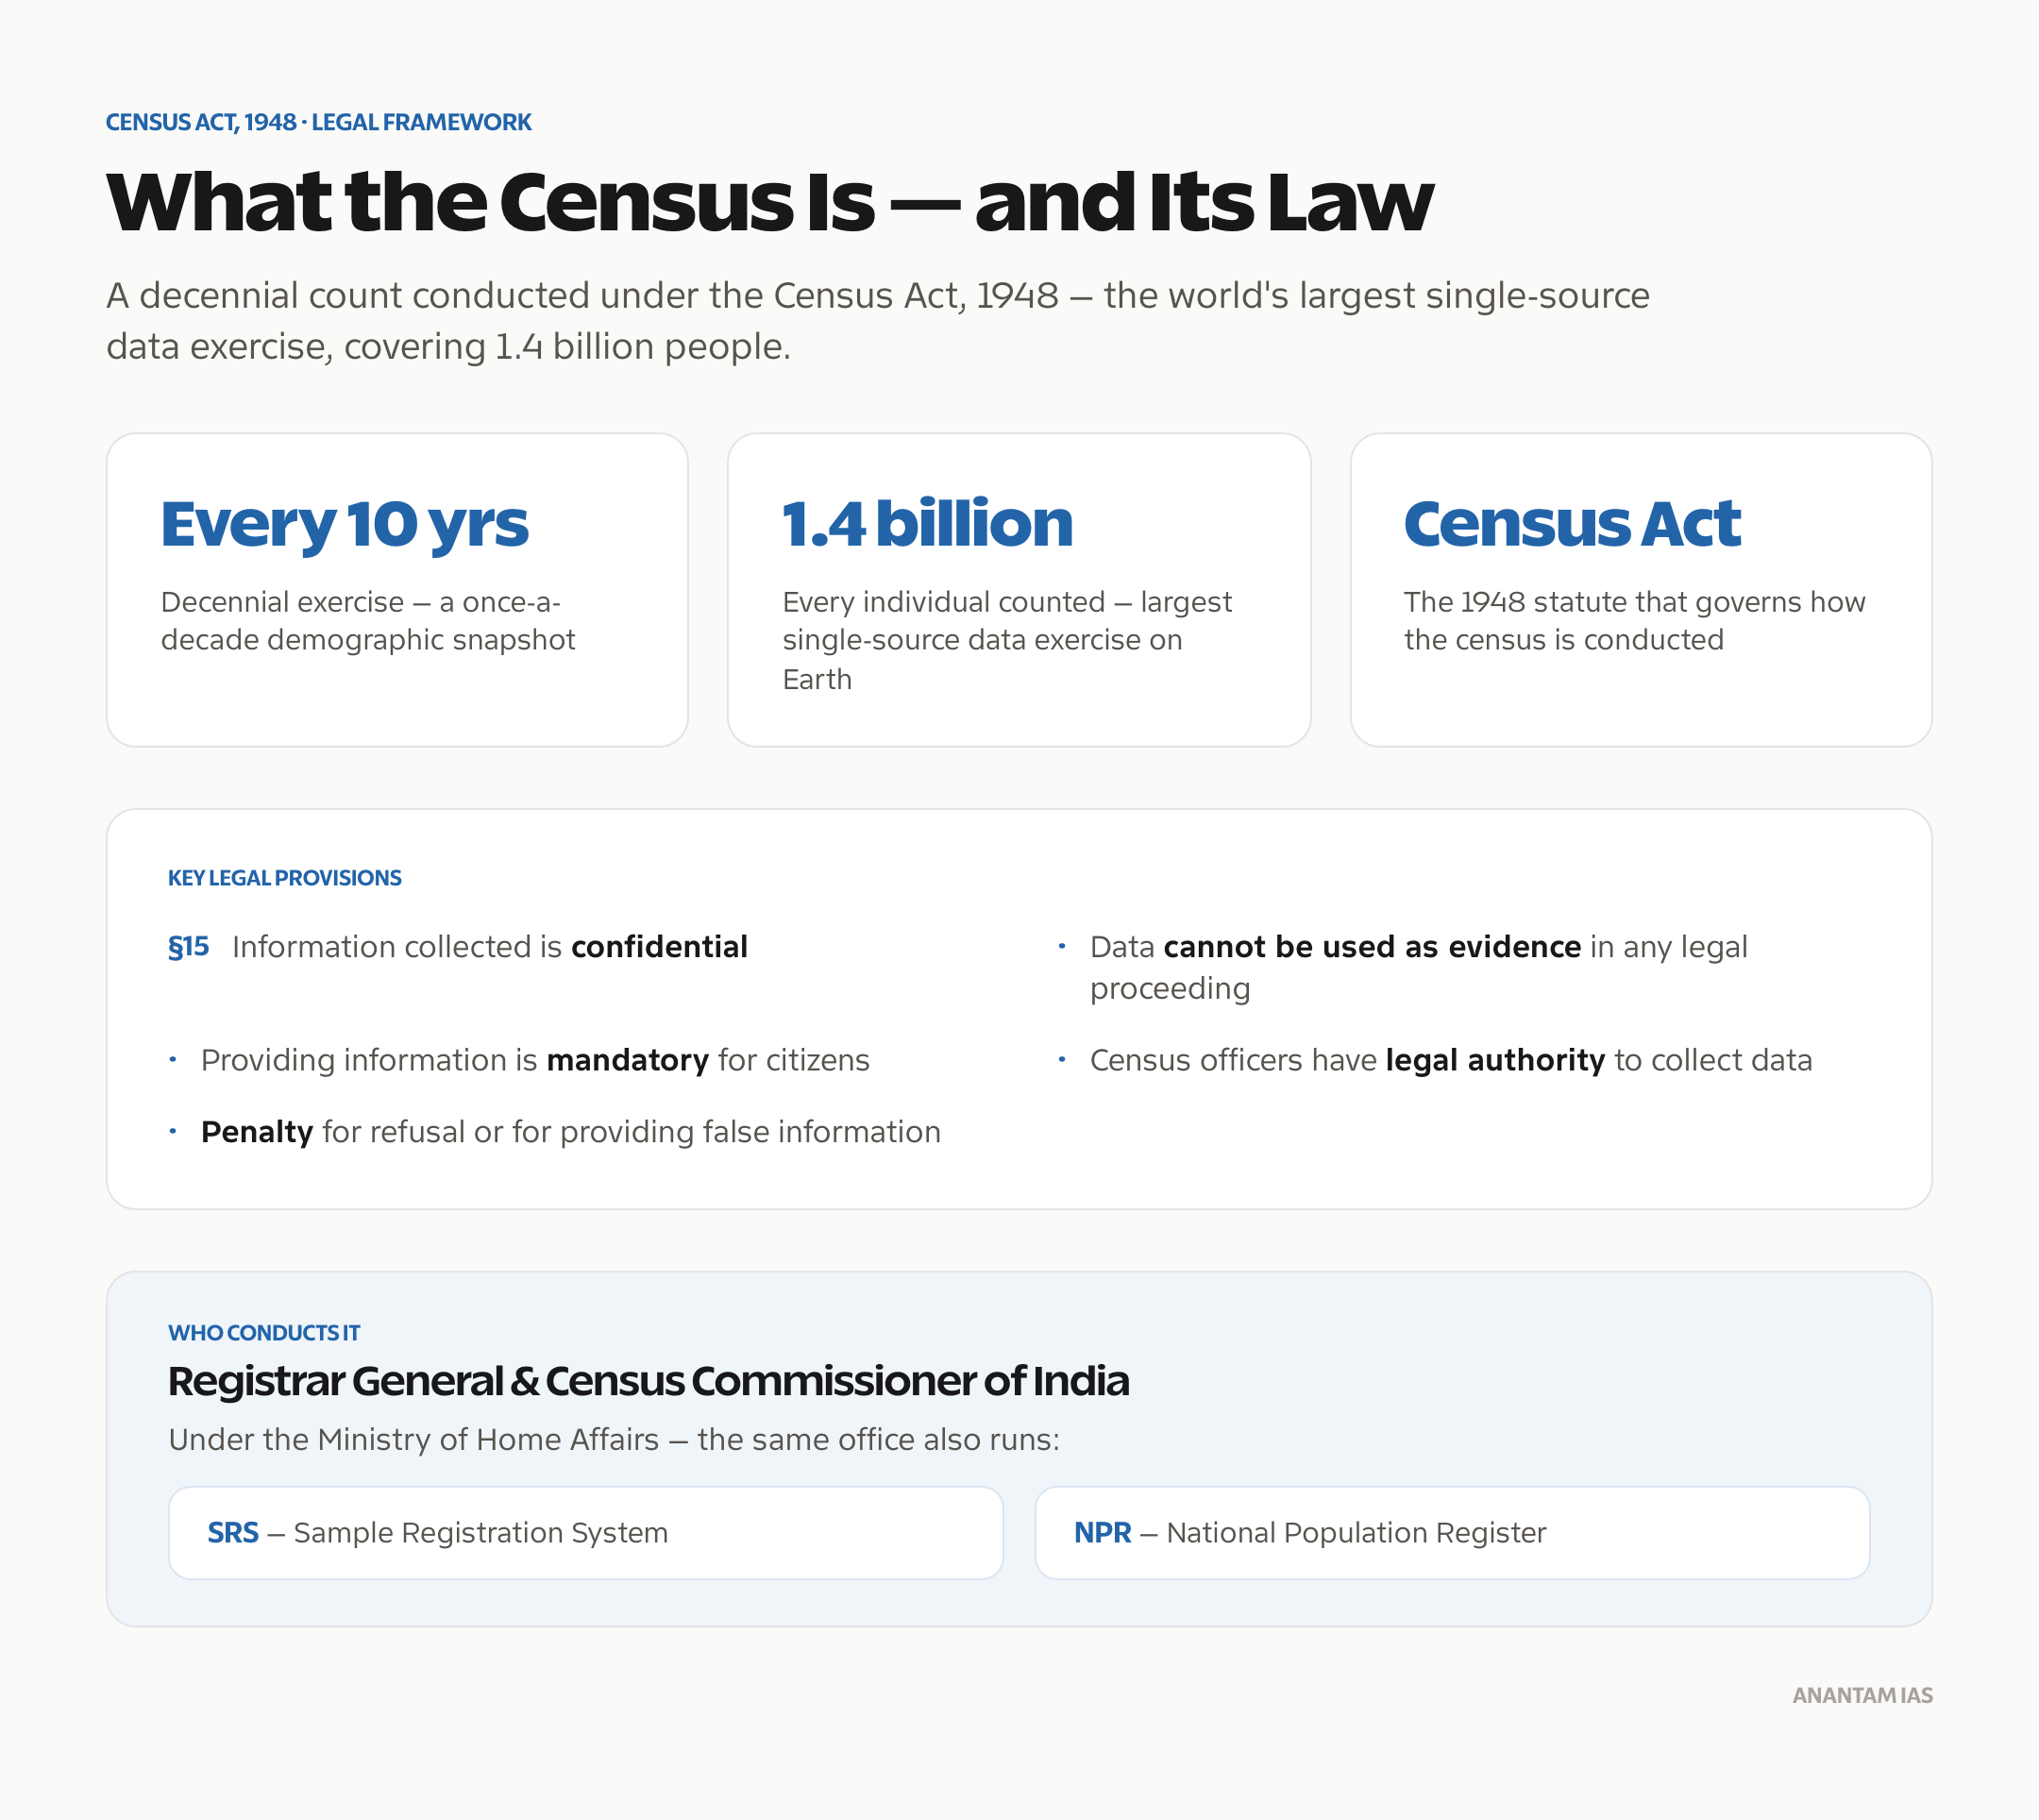
The Census of India is the largest single-source data collection exercise in the world, counting every individual across 1.4 billion people. Conducted every 10 years under the Census Act of 1948, it provides the foundational demographic, economic, and social data that drives government planning, resource allocation, and policy formulation. For UPSC, census data appears in Economy, Society, Geography, and Governance questions — making it essential reference material.
What Is the Census of India?
| Feature | Detail |
|---|---|
| Legal Basis | Census Act, 1948 |
| Frequency | Every 10 years (decennial) |
| Conducting Authority | Registrar General and Census Commissioner of India |
| Ministry | Ministry of Home Affairs |
| First Census | 1872 (non-synchronous) |
| First Synchronous Census | 1881 |
| Total Censuses | 16 (1872–2011) |
| Most Recent | Census 2011 (Census 2021 delayed) |
| Next Scheduled | Originally 2021, postponed (COVID-19 and other reasons) |
Constitutional and Legal Framework
The census is conducted under the Census Act, 1948. Key legal provisions:
- Information collected is confidential (Section 15)
- Data cannot be used as evidence in any legal proceedings
- Providing information is mandatory for citizens
- Census officers have legal authority to collect data
- Penalty for refusal to provide information or providing false information
History of the Indian Census
Timeline of Census Operations
| Census Year | Population (Crore) | Decadal Growth | Key Feature |
|---|---|---|---|
| 1872 | 25.8 | — | First census (non-synchronous) |
| 1881 | 25.4 | -1.5% | First synchronous census under W.W. Plowden |
| 1901 | 23.8 | -2.8% | Decline due to famines and plague |
| 1911 | 25.2 | 5.75% | Influenza pandemic impact |
| 1921 | 25.1 | -0.31% | “Year of Great Divide” — negative growth |
| 1931 | 27.9 | 11.0% | Positive growth resumes |
| 1941 | 31.9 | 14.22% | Wartime census |
| 1951 | 36.1 | 13.31% | First census of independent India |
| 1961 | 43.9 | 21.51% | Population explosion begins |
| 1971 | 54.8 | 24.80% | Highest decadal growth rate |
| 1981 | 68.3 | 24.66% | Emergency-era family planning impact minimal |
| 1991 | 84.6 | 23.87% | Economic liberalization year |
| 2001 | 102.9 | 21.54% | First to cross 1 billion |
| 2011 | 121.1 | 17.64% | Lowest decadal growth since independence |
The “Year of Great Divide” — 1921
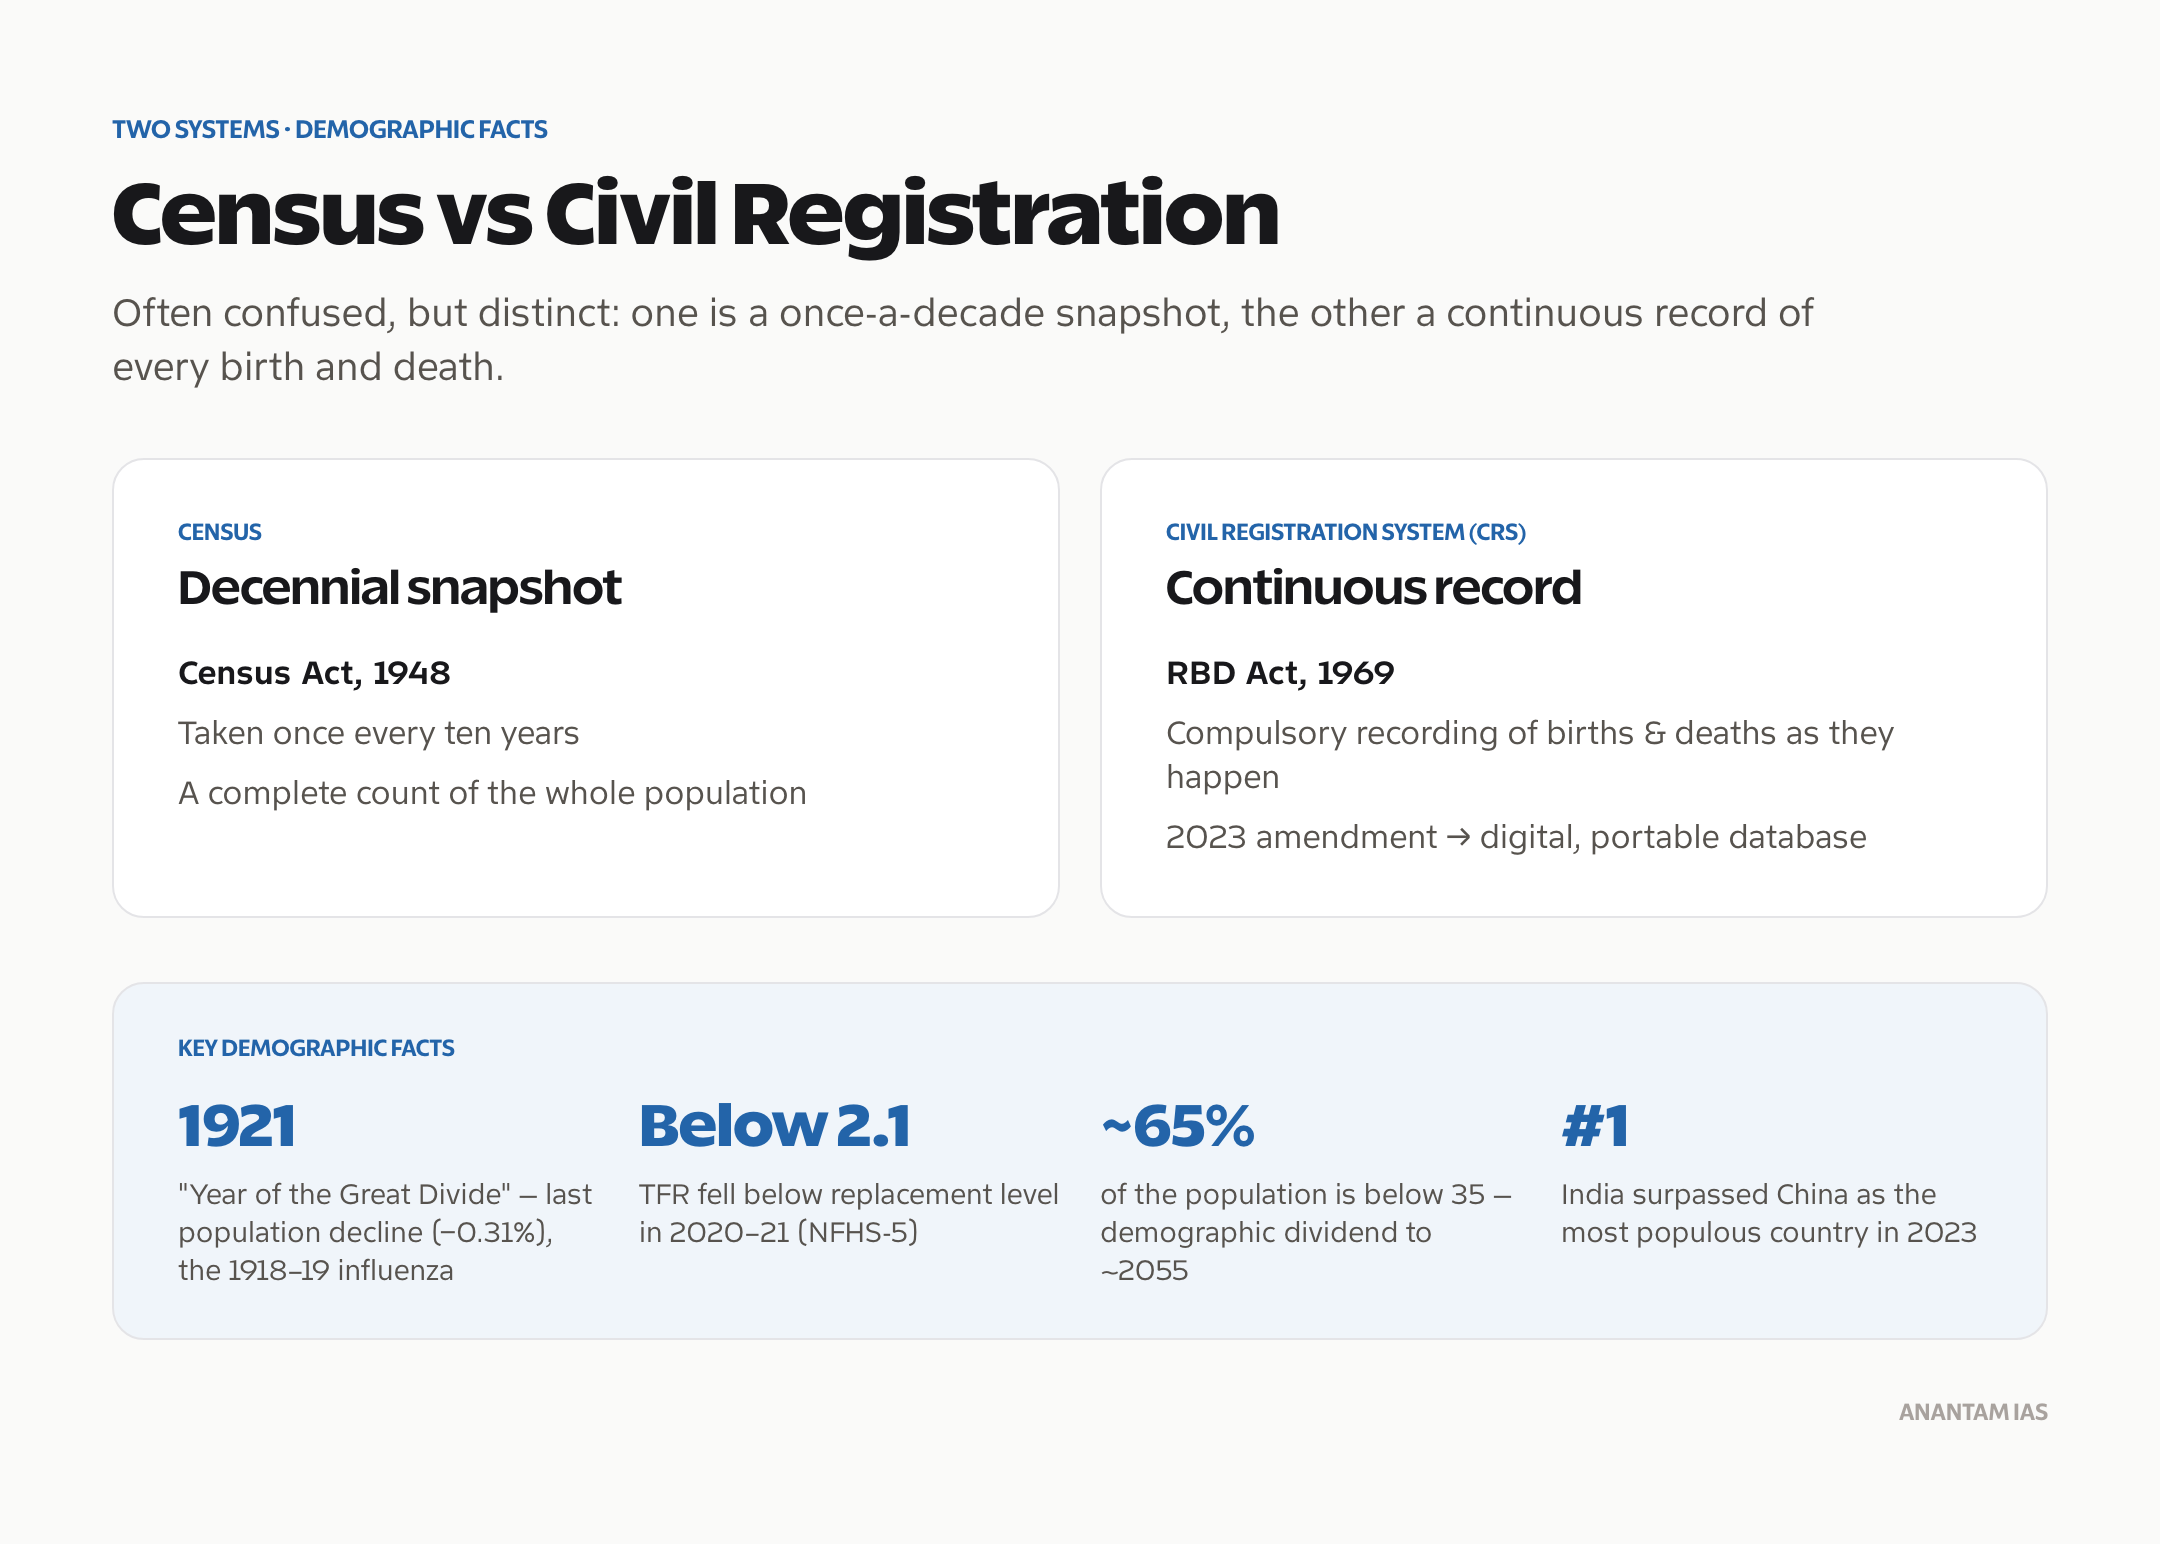
The 1921 census recorded a population decline (negative growth of -0.31%) — the last time India’s population decreased. This was caused by the 1918–19 influenza pandemic, famines, and plague. Post-1921, India’s population has grown continuously in every decade, earning 1921 the distinction of being the demographic turning point.
Census 2011: Key Findings
Census 2011 remains the most recent completed census. Its data forms the basis of most government planning and UPSC questions.
Population Data
| Indicator | Value |
|---|---|
| Total Population | 121.09 crore (1.21 billion) |
| Male Population | 62.32 crore |
| Female Population | 58.76 crore |
| Sex Ratio | 943 females per 1,000 males |
| Child Sex Ratio (0–6) | 914 females per 1,000 males |
| Population Density | 382 per sq km |
| Decadal Growth | 17.64% (2001–2011) |
| Urban Population | 31.16% |
| Rural Population | 68.84% |
Literacy Data
| Indicator | Value |
|---|---|
| Overall Literacy | 74.04% |
| Male Literacy | 82.14% |
| Female Literacy | 65.46% |
| Literacy Gap (Male-Female) | 16.68% |
| Most Literate State | Kerala (93.91%) |
| Least Literate State | Bihar (63.82%) |
State-wise Population (Top 10)
| Rank | State | Population (Crore) | % of Total |
|---|---|---|---|
| 1 | Uttar Pradesh | 19.98 | 16.51% |
| 2 | Maharashtra | 11.24 | 9.28% |
| 3 | Bihar | 10.41 | 8.60% |
| 4 | West Bengal | 9.13 | 7.54% |
| 5 | Madhya Pradesh | 7.27 | 6.00% |
| 6 | Tamil Nadu | 7.21 | 5.96% |
| 7 | Rajasthan | 6.86 | 5.66% |
| 8 | Karnataka | 6.11 | 5.05% |
| 9 | Gujarat | 6.04 | 4.99% |
| 10 | Andhra Pradesh | 4.93 | 4.07% |
Religious Composition (Census 2011)
| Religion | Population % |
|---|---|
| Hindu | 79.80% |
| Muslim | 14.23% |
| Christian | 2.30% |
| Sikh | 1.72% |
| Buddhist | 0.70% |
| Jain | 0.37% |
| Others | 0.88% |
Census 2021: Status and Delays
Census 2021, which was scheduled to begin in April 2020, has been indefinitely postponed. The COVID-19 pandemic initially caused the delay, but the exercise hasn’t resumed even after the pandemic subsided.
Implications of the Delay
| Impact Area | Consequence |
|---|---|
| Policy Planning | Government schemes use outdated 2011 data |
| Delimitation | Constituency boundaries based on 2001 census |
| Resource Allocation | Finance Commission recommendations use older data |
| OBC Enumeration | Caste census demands cannot be addressed |
| Migration Data | Post-COVID migration patterns uncaptured |
| Urban Planning | Urbanization estimates are projections, not counts |
The delay has significant governance implications. Government schemes like MGNREGA, PDS, and Ayushman Bharat rely on census data for beneficiary identification and resource allocation. Using decade-old data creates targeting inefficiencies.
Registrar General and Census Commissioner
Role and Functions
| Feature | Detail |
|---|---|
| Title | Registrar General and Census Commissioner of India |
| Under | Ministry of Home Affairs |
| Functions | Census operations, Sample Registration System, National Population Register |
| Additional Role | Civil Registration System (births and deaths) |
| Head Office | New Delhi |
The Registrar General’s office also manages:
- Sample Registration System (SRS) — provides annual estimates of birth rate, death rate, and other demographic indicators between census years
- National Population Register (NPR) — database of residents, linked to the census process
- Annual Health Survey — health and demographic data for high-focus states
Census and Governance: How Data Is Used
| Data Type | Governance Application |
|---|---|
| Population count | Delimitation of constituencies, resource allocation |
| Literacy rates | Education policy targeting (Samagra Shiksha) |
| SC/ST population | Reservation implementation, welfare programmes |
| Economic data | BPL identification, subsidy targeting |
| Housing data | PM Awas Yojana beneficiary identification |
| Migration data | Labour policy, urbanization planning |
| Disability data | Disability welfare programmes |
| Fertility/mortality | Health policy, family welfare programmes |
The Finance Commission uses census data for determining tax devolution formulas between Centre and states. The 15th Finance Commission used Census 2011 data as one of the criteria for horizontal devolution.
Demographic Transition in India
India is undergoing a demographic transition from high birth and death rates to low birth and death rates:
| Phase | Period | Characteristics |
|---|---|---|
| Phase 1 | Pre-1921 | High birth rate, high death rate, stagnant population |
| Phase 2 | 1921–1971 | High birth rate, declining death rate, population explosion |
| Phase 3 | 1971–2011 | Declining birth rate, low death rate, growth rate slowing |
| Phase 4 | 2011 onwards | Low birth rate, low death rate, stabilizing population |
India’s Total Fertility Rate (TFR) dropped below replacement level (2.1) in 2020–21 as per NFHS-5. However, population continues to grow due to demographic momentum — the large base of young people of reproductive age.
Demographic Dividend
With approximately 65% of the population below 35 years of age, India has a significant demographic dividend window — estimated to last until 2055. Capitalizing on this requires investment in education, skill development, healthcare, and job creation.
Comparing Census Data: India vs World
| Parameter | India | China | USA | World |
|---|---|---|---|---|
| Population (2024 est.) | 1.44 billion | 1.42 billion | 340 million | 8.1 billion |
| Population Rank | 1st | 2nd | 3rd | — |
| Growth Rate | ~0.9% | ~0.0% | ~0.5% | ~0.9% |
| Median Age | ~28 years | ~39 years | ~38 years | ~30 years |
| Urban Population | ~35% | ~65% | ~83% | ~57% |
India surpassed China as the world’s most populous country in 2023, according to UN estimates.
The Census vs the Civil Registration System (RBD Act, 1969)
The Census of India is sometimes confused with the Civil Registration System (CRS), but the two are distinct. The decennial Census is a snapshot taken once every ten years, whereas the CRS is the continuous, compulsory recording of vital events — births, deaths and stillbirths — as and when they happen. The CRS is governed by the Registration of Births and Deaths (RBD) Act, 1969, which made registration of these events mandatory across the country and is administered through a hierarchy of Registrars-General and Chief Registrars in the States. The 2023 amendment to the Act moved the system towards a digital, centrally portable birth-and-death database that can be used as a single document for school admission, voter rolls and other services. Because public health and vital statistics fall in the Concurrent List, both the Centre and the States legislate on this subject, while the Registrar General of India (under the Ministry of Home Affairs) coordinates both the Census and the CRS, alongside the Sample Registration System (SRS) that supplies India’s birth-rate, death-rate and infant-mortality estimates between Censuses.
Frequently Asked Questions
When was the first census conducted in India?
The first census in India was conducted in 1872 during the British period, but it was non-synchronous (conducted at different times in different regions). The first synchronous census — where the entire country was counted simultaneously — was conducted in 1881 under Census Commissioner W.W. Plowden.
Why is Census 2021 delayed?
Census 2021 was initially delayed due to the COVID-19 pandemic, which made large-scale door-to-door enumeration unsafe. Even after pandemic restrictions eased, the census hasn’t resumed. The government hasn’t announced a definitive timeline, leading to concerns about governance implications of using outdated 2011 data for planning and policy.
What is the significance of 1921 in Indian census history?
The 1921 census recorded a population decline (negative growth of -0.31%), making it the last year India’s population decreased. This was caused by the 1918–19 influenza pandemic. Since 1921, India’s population has grown in every subsequent decade. Demographers call 1921 the u0022Year of the Great Divideu0022 or the demographic divide.
What is the difference between census and NPR?
The Census counts every individual and collects demographic, economic, and social data. The National Population Register (NPR) creates a comprehensive identity database of every usual resident. While both are conducted by the Registrar General, they serve different purposes — the census for statistical planning and the NPR for identity verification and governance.
Which state has the highest population density in India?
According to Census 2011, Bihar has the highest population density among states at 1,106 persons per sq km. Delhi, as a Union Territory, has an even higher density at 11,320 per sq km. Among states, West Bengal (1,028) and Kerala (860) follow Bihar. Arunachal Pradesh has the lowest density at 17 per sq km.