Public Education Financing: Reading the Union Budget Share Correctly
Why in News?
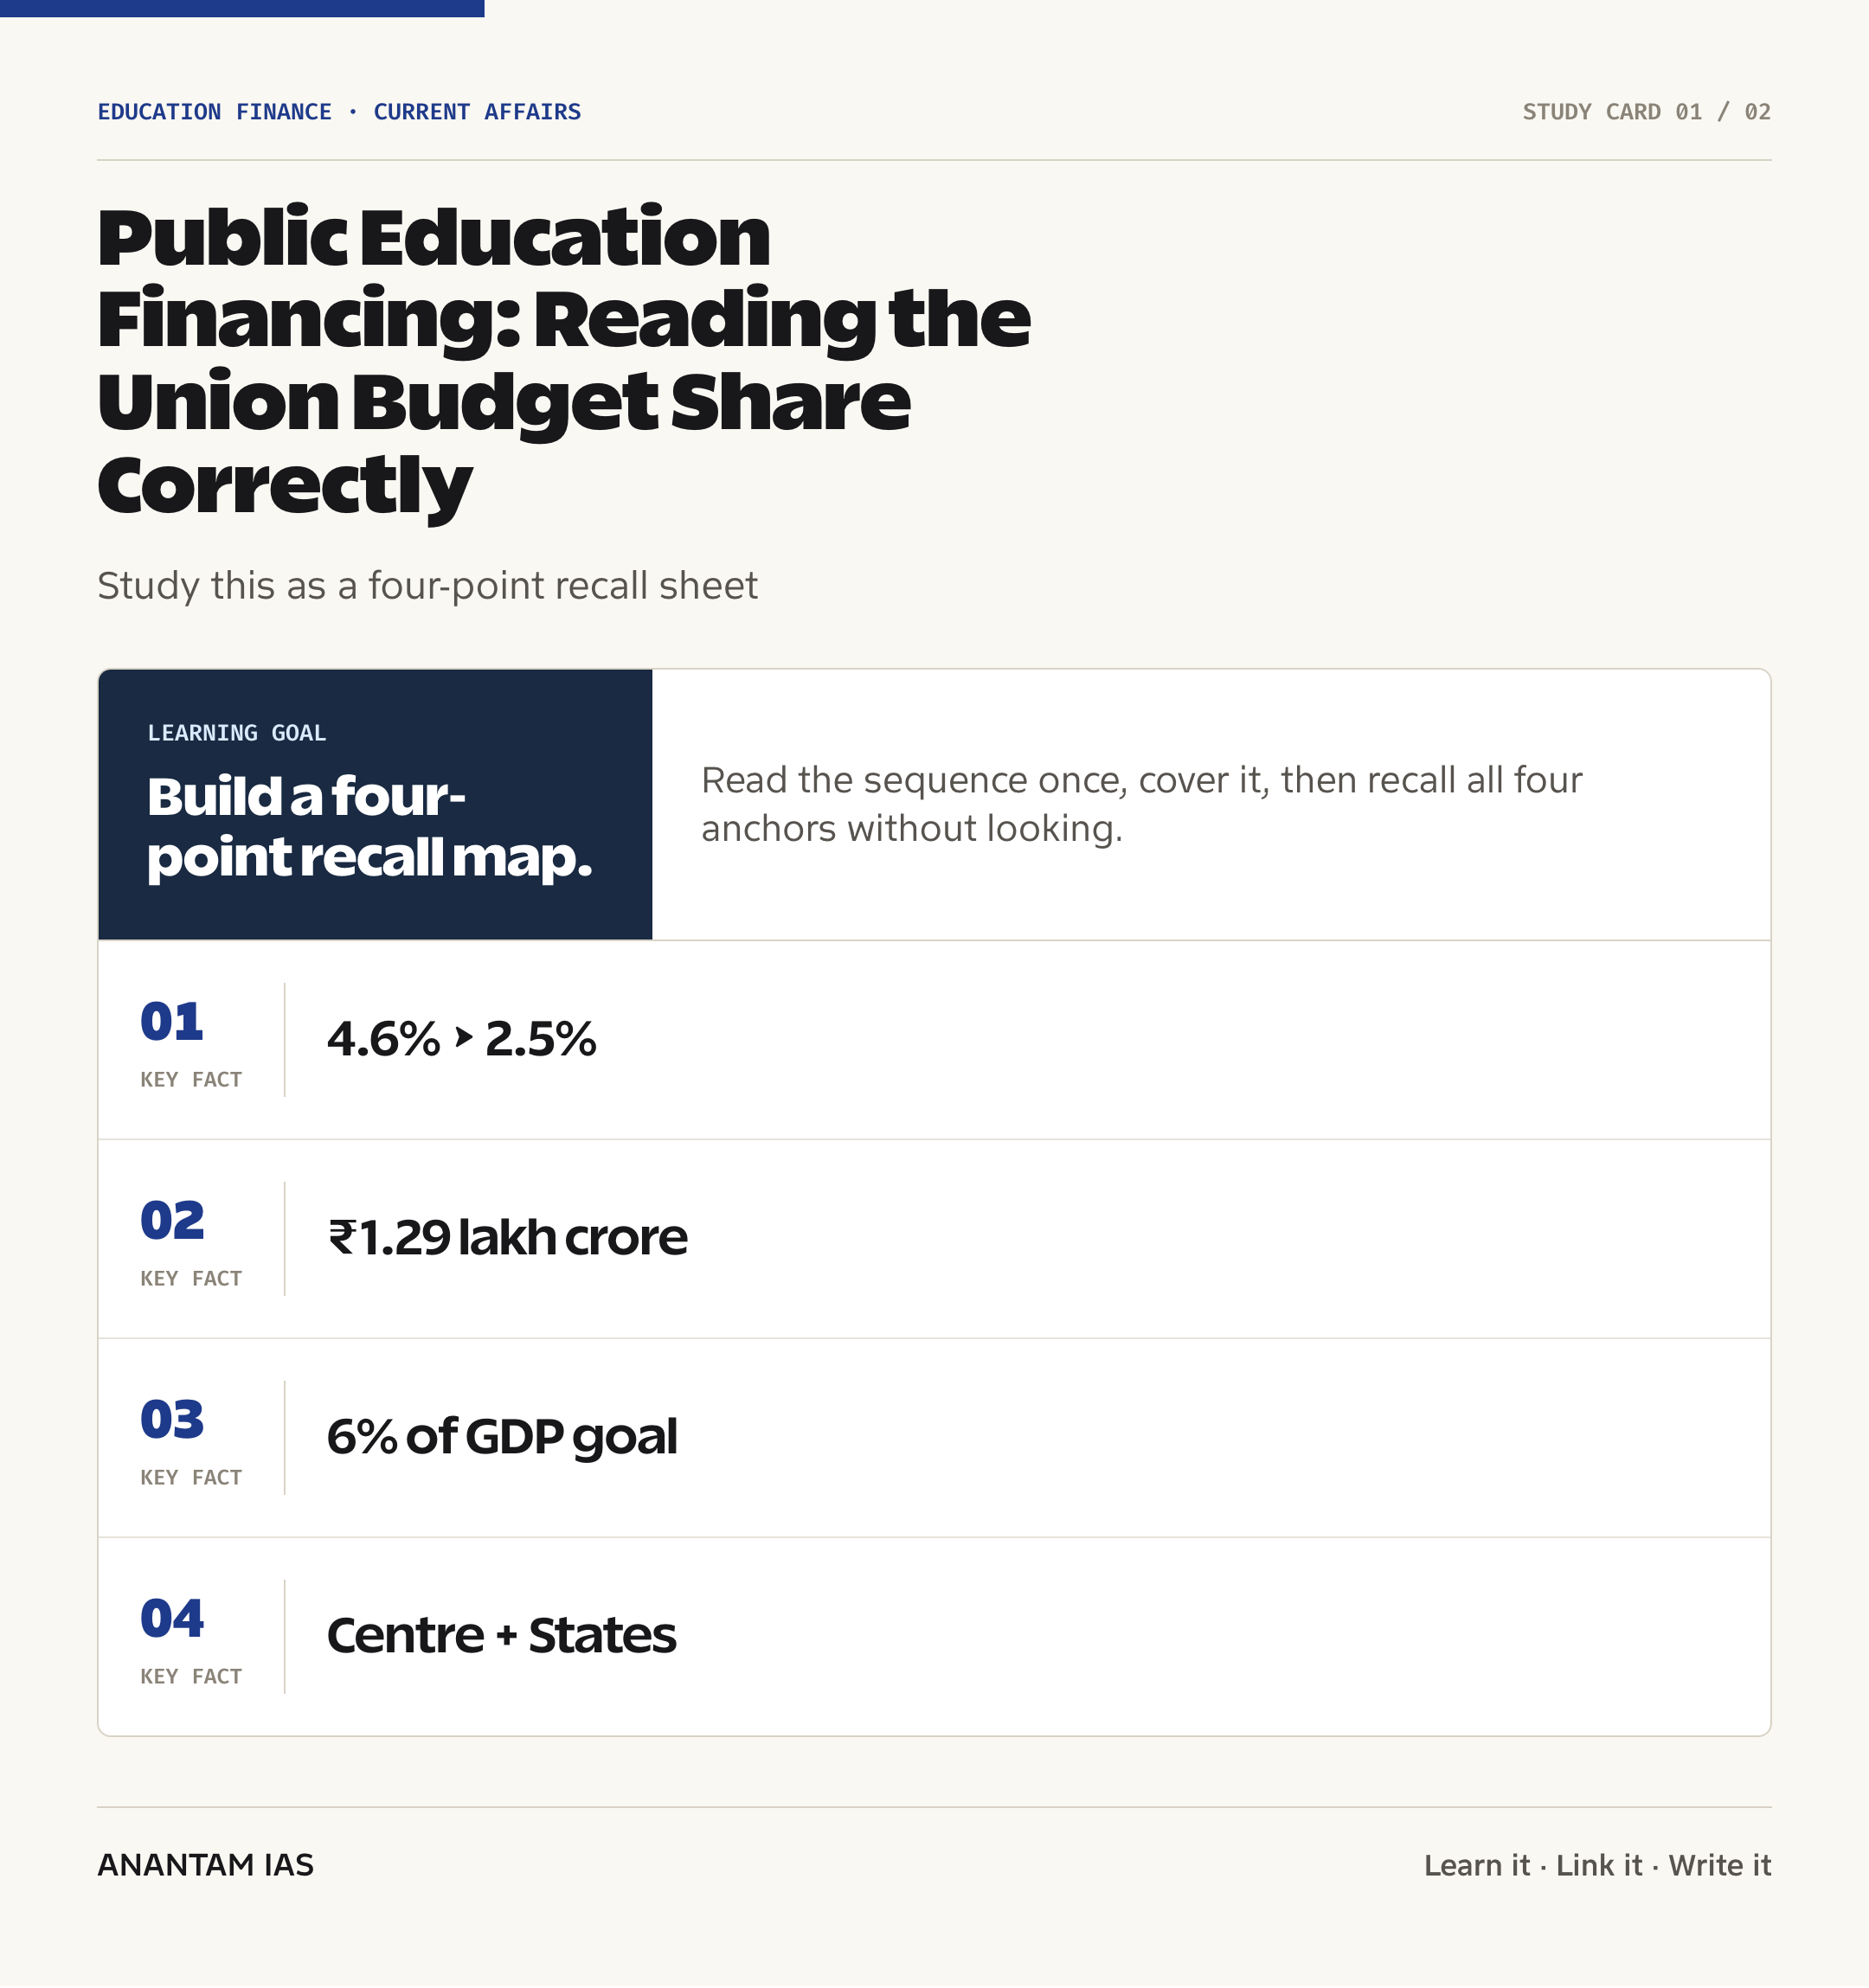
An Indian Express analysis published on 21 July 2026 renewed debate on public education financing by tracking the Ministry of Education’s share in Union expenditure. It placed that share at about 4.6% in 2013-14 and 2.5% in 2025-26.
The comparison matters because an allocation can rise in rupee terms while losing relative weight in an expanding Budget. Official documents put the Ministry’s 2025-26 Budget Estimate at ₹1,28,650.05 crore against total Union expenditure of ₹50,65,345 crore, which works out to about 2.54%.
- The article used a series beginning in 2009-10 and focused on a ministry’s share of overall Union expenditure, not merely the annual change in its nominal allocation.
- The Ministry of Education consists of the Department of School Education and Literacy and the Department of Higher Education.
- The official 2026-27 Budget Estimate raises the Ministry’s allocation to ₹1,39,289.48 crore; against total Union expenditure of ₹53,47,315 crore, its share is about 2.61%.
- The small movement from roughly 2.54% to 2.61% does not erase the longer decline identified in the 2013-14 to 2025-26 comparison, but estimate categories must be matched before drawing a trend line.
- The debate is especially relevant to the National Education Policy 2020, which asks the Centre and states together to take public investment in education to 6% of GDP.
The development matters in the context of:
- This matters in the context of state capacity: classrooms, teachers, scholarships, laboratories and regulators need predictable multi-year financing, not only one-time announcements.
- It also matters in the context of educational accountability: more money is an input, while access, retention, learning and integrity of examinations are outcomes.
- The Union Ministry’s share is only one lens because state governments finance a large part of school and higher education expenditure.
UPSC Relevance
Prelims Relevance
- Under the Seventh Schedule, education is in the Concurrent List, so both Parliament and state legislatures can make laws on the subject.
- The Ministry of Education has two departments: School Education and Literacy and Higher Education.
- A Budget Estimate (BE) is the amount proposed for the coming financial year; a Revised Estimate (RE) updates the likely expenditure during that year.
- An Actual records expenditure after the financial year closes and can differ from both BE and RE.
- The 6% of GDP goal in NEP 2020 applies to combined public investment by the Centre and states, not only to the Union Ministry of Education.
- The Ministry’s share in the Union Budget uses total Union expenditure as the denominator; education expenditure as a share of GDP uses a different denominator and often a wider set of governments.
- The Right of Children to Free and Compulsory Education Act, 2009 operationalises the entitlement under Article 21A for children aged six to fourteen years.
- Samagra Shiksha is an integrated centrally sponsored school-education scheme spanning pre-school to Class XII.
- PM POSHAN supports nutritional provision in eligible schools, linking education finance with attendance, health and equity.
Mains Relevance
GS Paper 2
- Assess education as a public good and as a means of substantive equality, social mobility and human-capital formation.
- Examine how fiscal federalism affects delivery when the Union sets national goals but states run most school systems and many universities.
- Connect financing with Article 21A, the RTE Act, inclusion of disadvantaged groups and accountability for learning outcomes.
GS Paper 3
- Link education spending to demographic dividend, productivity, employability, research capacity and long-run growth.
- Discuss expenditure quality through outcome budgeting, fund-release timing, absorption capacity and evaluation.
Essay
- A nation reveals its development priorities through the balance between physical infrastructure and human capabilities.
- Public money creates opportunity only when adequate inputs are joined with accountable institutions and equitable access.
- Education is both an individual ladder of mobility and a collective democratic investment.
Background and Context
The denominator changes the story
Budget debates often mix absolute allocations, expenditure shares and GDP ratios even though each answers a different question.
- A rise from one rupee amount to another shows nominal growth; it does not by itself show whether education gained priority relative to all Union spending.
- The ratio Ministry allocation ÷ total Union expenditure measures the Ministry’s relative claim on the Union Budget.
- The ratio public education expenditure ÷ GDP is broader: it can include spending by both the Centre and states and compares that spending with the size of the economy.
- A per-student measure answers yet another question by relating expenditure to the number and needs of learners.
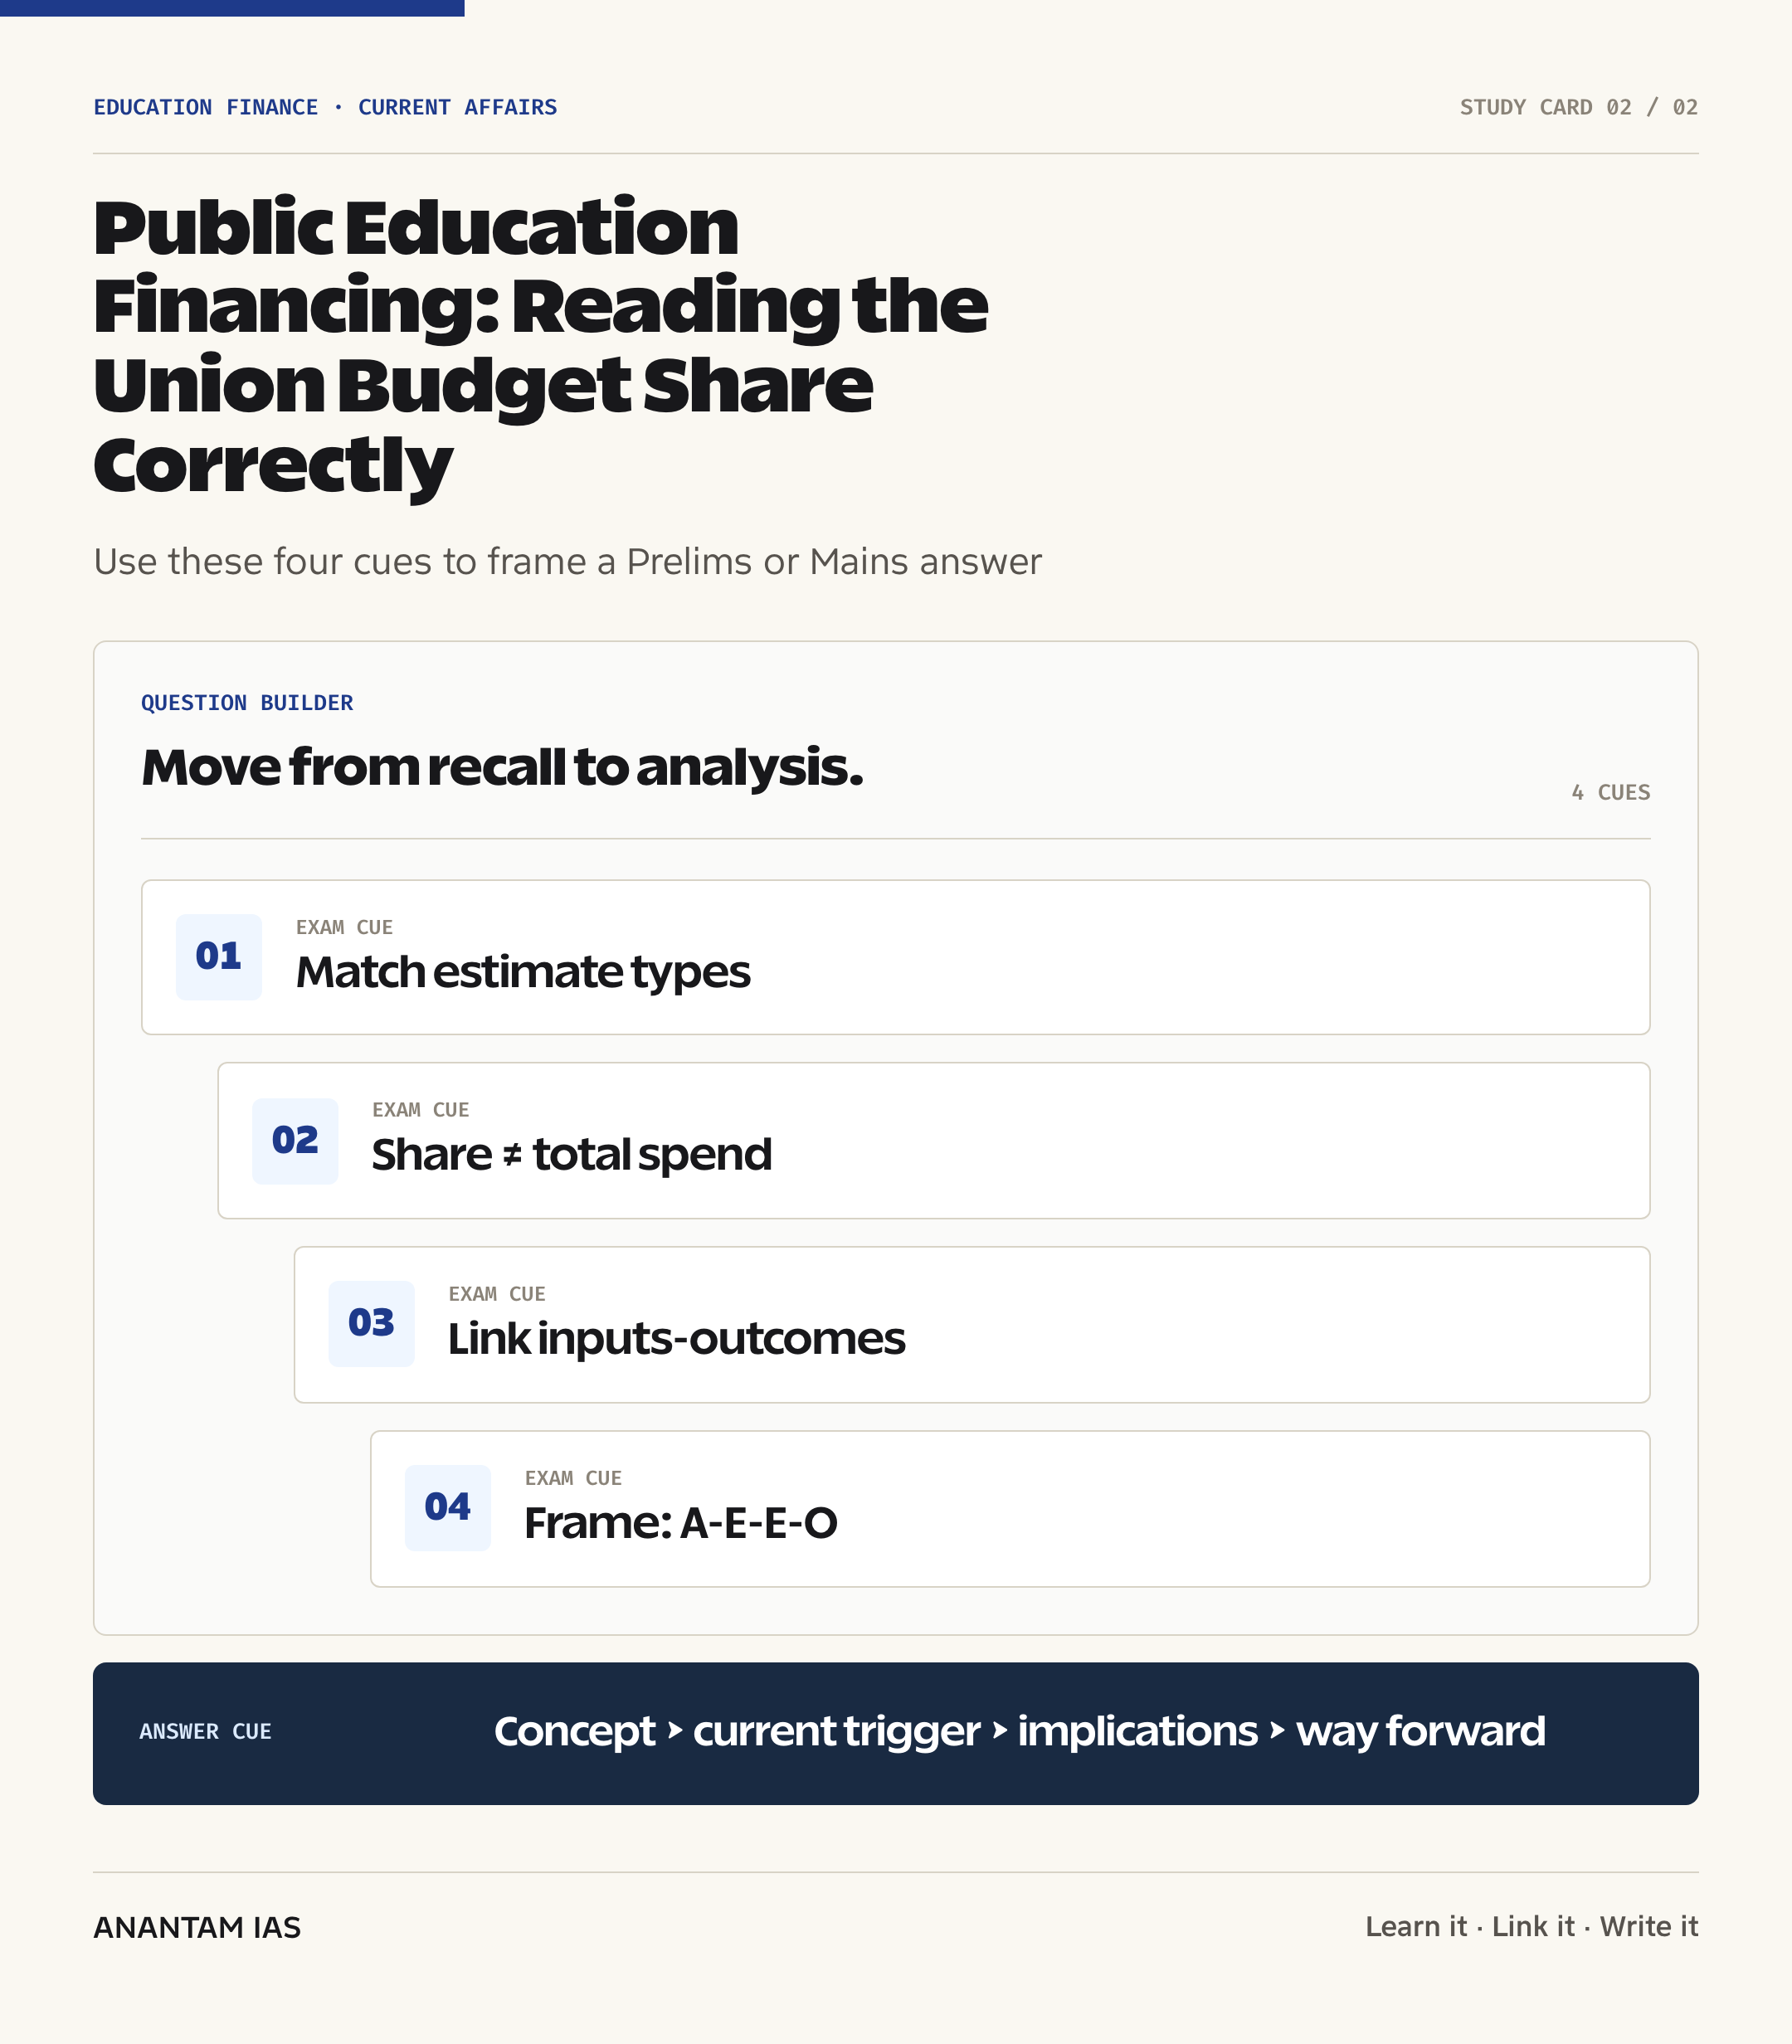
- For a defensible comparison, use the same scope, price basis and estimate stage across years; mixing BE, RE and Actuals can create a false rise or fall.
- A current-price series includes inflation, while a constant-price series attempts to measure real purchasing power. Fast nominal growth can coexist with a weak real increase.
- A Budget share can also fall when education spending rises but the denominator grows faster. This is why both the numerator and total expenditure must be shown.
What the verified Budget numbers show
The official totals confirm the recent share calculation while the longer series supplies the historical warning.
- The 2025-26 BE allocated ₹78,572.10 crore to School Education and Literacy and ₹50,077.95 crore to Higher Education, totalling ₹1,28,650.05 crore.
- The 2025-26 Budget at a Glance put total Union expenditure at ₹50,65,345 crore; the Ministry’s calculated share was about 2.54%.
- For 2026-27 BE, the Ministry’s official total is ₹1,39,289.48 crore, split between ₹83,562.26 crore for school education and ₹55,727.22 crore for higher education.
- Total Union expenditure in 2026-27 BE is ₹53,47,315 crore, making the Ministry’s calculated share about 2.61%.
- The Indian Express-CMIE series places the comparable longer-run share at about 4.6% in 2013-14 and 2.5% in 2025-26; this is a decline in relative Budget weight, not a claim that rupee spending fell.
- The Ministry’s 2026-27 BE is 8.27% above its 2025-26 BE in nominal terms, according to the Ministry of Education, while its calculated Union Budget share changes only modestly.
- One year’s uptick can mark a welcome correction, but a priority claim needs a consistent multi-year series and eventual Actuals rather than a comparison of announcements alone.
Union allocation is not India's total education bill
The federal structure makes a ministry-only ratio useful but incomplete.
- Education’s place in the Concurrent List permits national legislation and programmes while leaving major delivery responsibilities with states.
- States finance teacher salaries, state universities, school buildings and many recurring costs, so the Union Ministry’s share cannot stand in for general-government education spending.
- Centrally sponsored schemes such as Samagra Shiksha also use shared financing and state implementation, making the release and matching of funds important.
- A sound answer should use both lenses: the Union Budget share for central priority, and combined Centre-state expenditure for progress toward the national financing goal.
- For a detailed conceptual companion, see India’s education spending and the 6% promise.
- Union support reaches education through ministry schemes, statutory or discretionary transfers and tax devolution that enlarges state fiscal space; not every education-relevant rupee appears under one demand for grants.
- State capacity varies sharply, so equal national goals can produce unequal services unless the transfer system recognises fiscal capacity and educational need.
The 6% goal and its correct use
The 6% benchmark is a public-investment ambition, not a guaranteed measure of educational quality.
- The National Education Policy 2020 asks the Centre and states to work together to raise public investment in education to 6% of GDP at the earliest.
- The benchmark was not invented by NEP 2020; the policy notes its roots in the Education Policy of 1968, reiteration in 1986 and review in 1992.
- The Ministry of Education reported combined public education expenditure at 4.64% of GDP in 2020-21; the year and coverage must accompany the figure because later estimates may differ.
- Aspirants should not compare the Ministry’s roughly 2.5-2.6% share of Union expenditure directly with the 6% of GDP goal; the numerators and denominators differ.
- Read NEP 2020 structure and reforms alongside financing data to connect money with policy commitments.
- The 6% benchmark is a policy commitment rather than an automatically enforceable annual appropriation; budgets still pass through constitutional and legislative processes each year.
- Reaching an aggregate percentage would not settle distribution questions. The composition between early childhood, schools, higher education, vocational learning, research and adult literacy remains a separate policy choice.
Why adequacy still matters
Funding cannot guarantee learning, but chronic under-provision can make quality and equity targets unattainable.
- Schools need recurrent financing for teachers, training, textbooks, digital access, maintenance and inclusive facilities; capital announcements alone cannot keep these services running.
- Higher education needs stable support for faculty, laboratories, scholarships, libraries and research, where stop-start grants weaken institutional planning.
- Poor households face higher exclusion when public capacity is weak because private spending on fees, devices, coaching and transport becomes an informal substitute.
- Adequate public financing can reduce gaps by gender, disability, caste, tribe, income and geography when allocations follow measured need.
- The latest school-system evidence should be read with the UDISE+ 2025-26 report, which helps connect fiscal inputs to access and system indicators.
- Education assets carry life-cycle costs: a new classroom needs teachers, electricity, water, repairs and learning materials. Funding construction without recurrent support creates visible assets but weak services.
- Underinvestment can compound over time. Unfilled posts, deferred maintenance and learning gaps become more expensive to repair, while affected students cannot recover lost years simply through a later Budget increase.
Why expenditure quality matters just as much
A larger allocation produces value only when funds arrive on time, reach the intended level and address the binding constraint.
- Track the chain from allocation to release to expenditure to output to outcome; a Budget announcement is only the first stage.
- Low spending against allocation may reflect delayed approvals, procurement bottlenecks, vacancies or weak local capacity, not a lack of educational need.
- Spending near the financial year’s end can weaken planning and value for money; predictable releases allow schools and universities to sequence hiring, procurement and maintenance.
- Outcome indicators should cover foundational learning, attendance, transition, completion, inclusion and employability, while avoiding incentives to manipulate a single metric.
- Independent audits, parliamentary scrutiny and public dashboards can make fiscal transparency useful to citizens rather than merely procedural.
- Outputs and outcomes should not be confused: distributing devices is an output, while improved attendance or learning is an outcome that depends on connectivity, training and classroom use.
- Disaggregated data can expose whether an average gain hides exclusion. Budget reviews should test results across districts and social groups, not only report one national total.
A balanced UPSC evaluation
The strongest answer neither treats spending as a magic cure nor dismisses it as irrelevant.
- The case for more resources rests on positive externalities: education raises productivity, public health awareness, civic participation and intergenerational mobility.
- The case for reform rests on evidence that funds can be weakened by vacancies, fragmented schemes, poor targeting and limited evaluation.
- Inter-sectoral comparisons require care because roads, health and education have different capital profiles, time horizons and spillovers; a larger share for one does not mechanically prove waste in another.
- The right analytical frame is adequacy + equity + efficiency + outcomes, supported by comparable data across Union and state governments.
- Public education financing is best judged over a medium-term path, not through one headline year or one scheme announcement.
- Budgeting always involves opportunity cost, but human-capability spending has long gestation and broad spillovers that annual construction or revenue metrics can understate.
- A democratic government may choose its priorities; the accountability test is whether it explains the trade-offs, supplies comparable evidence and protects the minimum conditions for equal educational opportunity.
Way Forward
Adopt a transparent medium-term financing path
- Publish a phased Centre-state roadmap toward the NEP financing commitment, with separate baselines for school, higher, vocational and research education.
- Report BE, RE and Actuals together so that higher announcements can be distinguished from realised expenditure.
- Present inflation-adjusted and per-student series beside nominal allocations to reveal changes in purchasing power.
Fund need and equal opportunity
- Use formulas that recognise poverty, remoteness, disability, gender gaps, tribal concentration and school size rather than relying only on enrolment totals.
- Protect high-impact recurrent spending on teachers, scholarships, nutrition, accessibility and maintenance from abrupt compression.
- Give local institutions bounded flexibility with transparent safeguards, because the binding constraint differs across districts.
Link finance to capability and results
- Fill sanctioned vacancies and strengthen procurement, data and financial-management capacity before blaming low spending solely on institutions.
- Use outcome budgets that connect money to service standards, but combine quantitative targets with classroom observation and independent assessment.
- Evaluate schemes for additional learning, retention and equity, and redesign programmes that repeatedly fail to convert outlay into outcomes.
Strengthen cooperative fiscal federalism
- Create a common Centre-state education-finance dashboard with comparable definitions, timely releases and district-level visibility.
- Use forums such as the Central Advisory Board of Education for negotiated priorities instead of treating national targets as unilateral instructions.
- Let Parliament, state legislatures, audit institutions and school communities review both spending gaps and learning consequences.
Conclusion
The fall from about 4.6% to 2.5% in the reported historical series is a signal about the Education Ministry’s relative place in Union expenditure. It deserves scrutiny even though the Ministry’s nominal allocation has risen and the 2026-27 BE produces a small increase in the recent share.
The policy test is wider than one ratio. India needs enough public money, fair Centre-state burden sharing and institutions capable of turning allocations into access, learning, integrity and mobility. A good answer keeps all four in view.
UPSC Practice Questions
Prelims MCQ 1
With reference to public education financing in India, consider the following statements:
- The 6% of GDP goal in National Education Policy 2020 concerns combined public investment by the Centre and states.
- The Ministry of Education’s share in the Union Budget is identical to total public education expenditure as a share of GDP.
- A Budget Estimate may differ from both the Revised Estimate and the final Actual expenditure.
How many of the above statements are correct?
(a) Only one (b) Only two (c) All three (d) None
Answer: (b) Only two
Explanation:
Statements 1 and 3 are correct. Statement 2 is incorrect because the Union Ministry share and the GDP ratio use different government coverage and different denominators.
Prelims MCQ 2
Which denominator is used to calculate the Ministry of Education’s share in the Union Budget?
(a) India’s nominal GDP (b) Total Union government expenditure (c) Combined expenditure of all state governments (d) Total expenditure of the social sector
Answer: (b) Total Union government expenditure
Explanation:
The ministry-share measure divides the Ministry of Education’s allocation or expenditure by total Union expenditure for the same year and estimate stage.
UPSC Mains Questions
- The declining share of the Ministry of Education in Union expenditure raises questions of priority, but it does not capture India’s complete education-finance effort. Examine this statement through the lenses of fiscal federalism, estimate quality, equity and educational outcomes. (250 words)
- National Education Policy 2020’s 6% of GDP ambition is an adequacy benchmark, not an outcome guarantee. Discuss how India can combine higher and more predictable public financing with institutional capacity, transparent expenditure tracking and accountability for learning. (250 words)
Sources: Union Budget 2025-26, Ministry of Finance and Indian Express Explained.
Frequently Asked Questions
What does the education Budget share measure?
It measures the Ministry of Education’s allocation or expenditure as a percentage of total Union government expenditure for the same financial year. It shows relative Budget priority. It does not measure all education spending in India, because states finance a large share and the GDP ratio uses a different denominator.
Did education spending fall in rupee terms?
No. The Ministry’s nominal allocation rose over the long period discussed. The concern is that total Union expenditure expanded faster, so the Ministry’s relative share declined. Nominal growth, real growth after inflation, per-student expenditure and share of the Budget are separate indicators and should not be used interchangeably.
Why compare BE, RE and Actuals separately?
BE is the initial proposal, RE is the in-year revision and Actuals record spending after closure of accounts. A ministry may receive a high BE but spend less, or receive a higher RE. Comparing BE in one year with Actuals in another can produce a misleading trend.
Does NEP require 6% of Union expenditure?
No. NEP 2020 calls for combined public investment by the Centre and state governments to reach 6% of GDP. It is not a target for the Union Ministry’s share in total Union expenditure. The two ratios cover different governments and use different denominators.
Why do states matter in education finance?
Education is in the Concurrent List, and states operate most government schools and many public higher-education institutions. They bear major recurring costs such as salaries and maintenance. A complete assessment must combine Union support, state budgets, intergovernmental transfers and actual local delivery.
Can higher spending guarantee better learning?
Higher spending cannot guarantee learning on its own, but severe input gaps can block improvement. Results depend on timely releases, capable institutions, teachers, sound procurement and monitoring. The useful framework joins adequacy and equity with efficiency and outcomes instead of choosing money or reform as competing answers.