A country that has promised the same number for nearly sixty years and never delivered it has a problem worth examining. The number is 6% of GDP on education. The Kothari Commission proposed it in 1966, three national policies reaffirmed it, and India is still well short of it. So far, this looks like a simple story of underfunding. But that’s the trap. The harder truth, the one ASER 2024 forced into the open when Pratham released it on 28 January 2025, is that even the money India already spends isn’t buying the learning it should.
That’s the tension you have to hold in one hand. India spends too little on education by its own long-stated benchmark. And what it does spend too often fails to teach a child to read. Both can be true at once, and a serious answer refuses to pick only one. The 6% promise matters. So does the question of what each rupee actually delivers in a classroom.
The Issue, Framed
The debate goes wrong in its first sentence, because most people argue about a percentage without saying which percentage they mean. So let’s fix the vocabulary first, the way you’d want it fixed before walking into an exam hall.
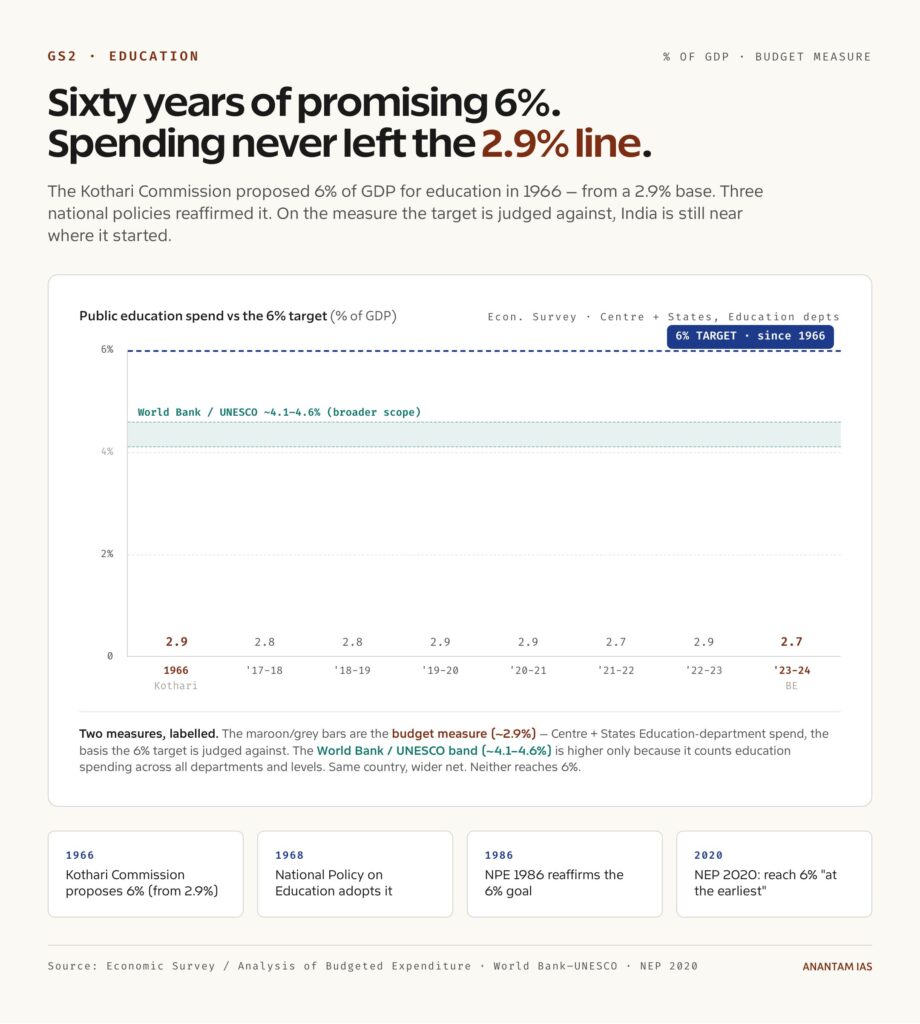
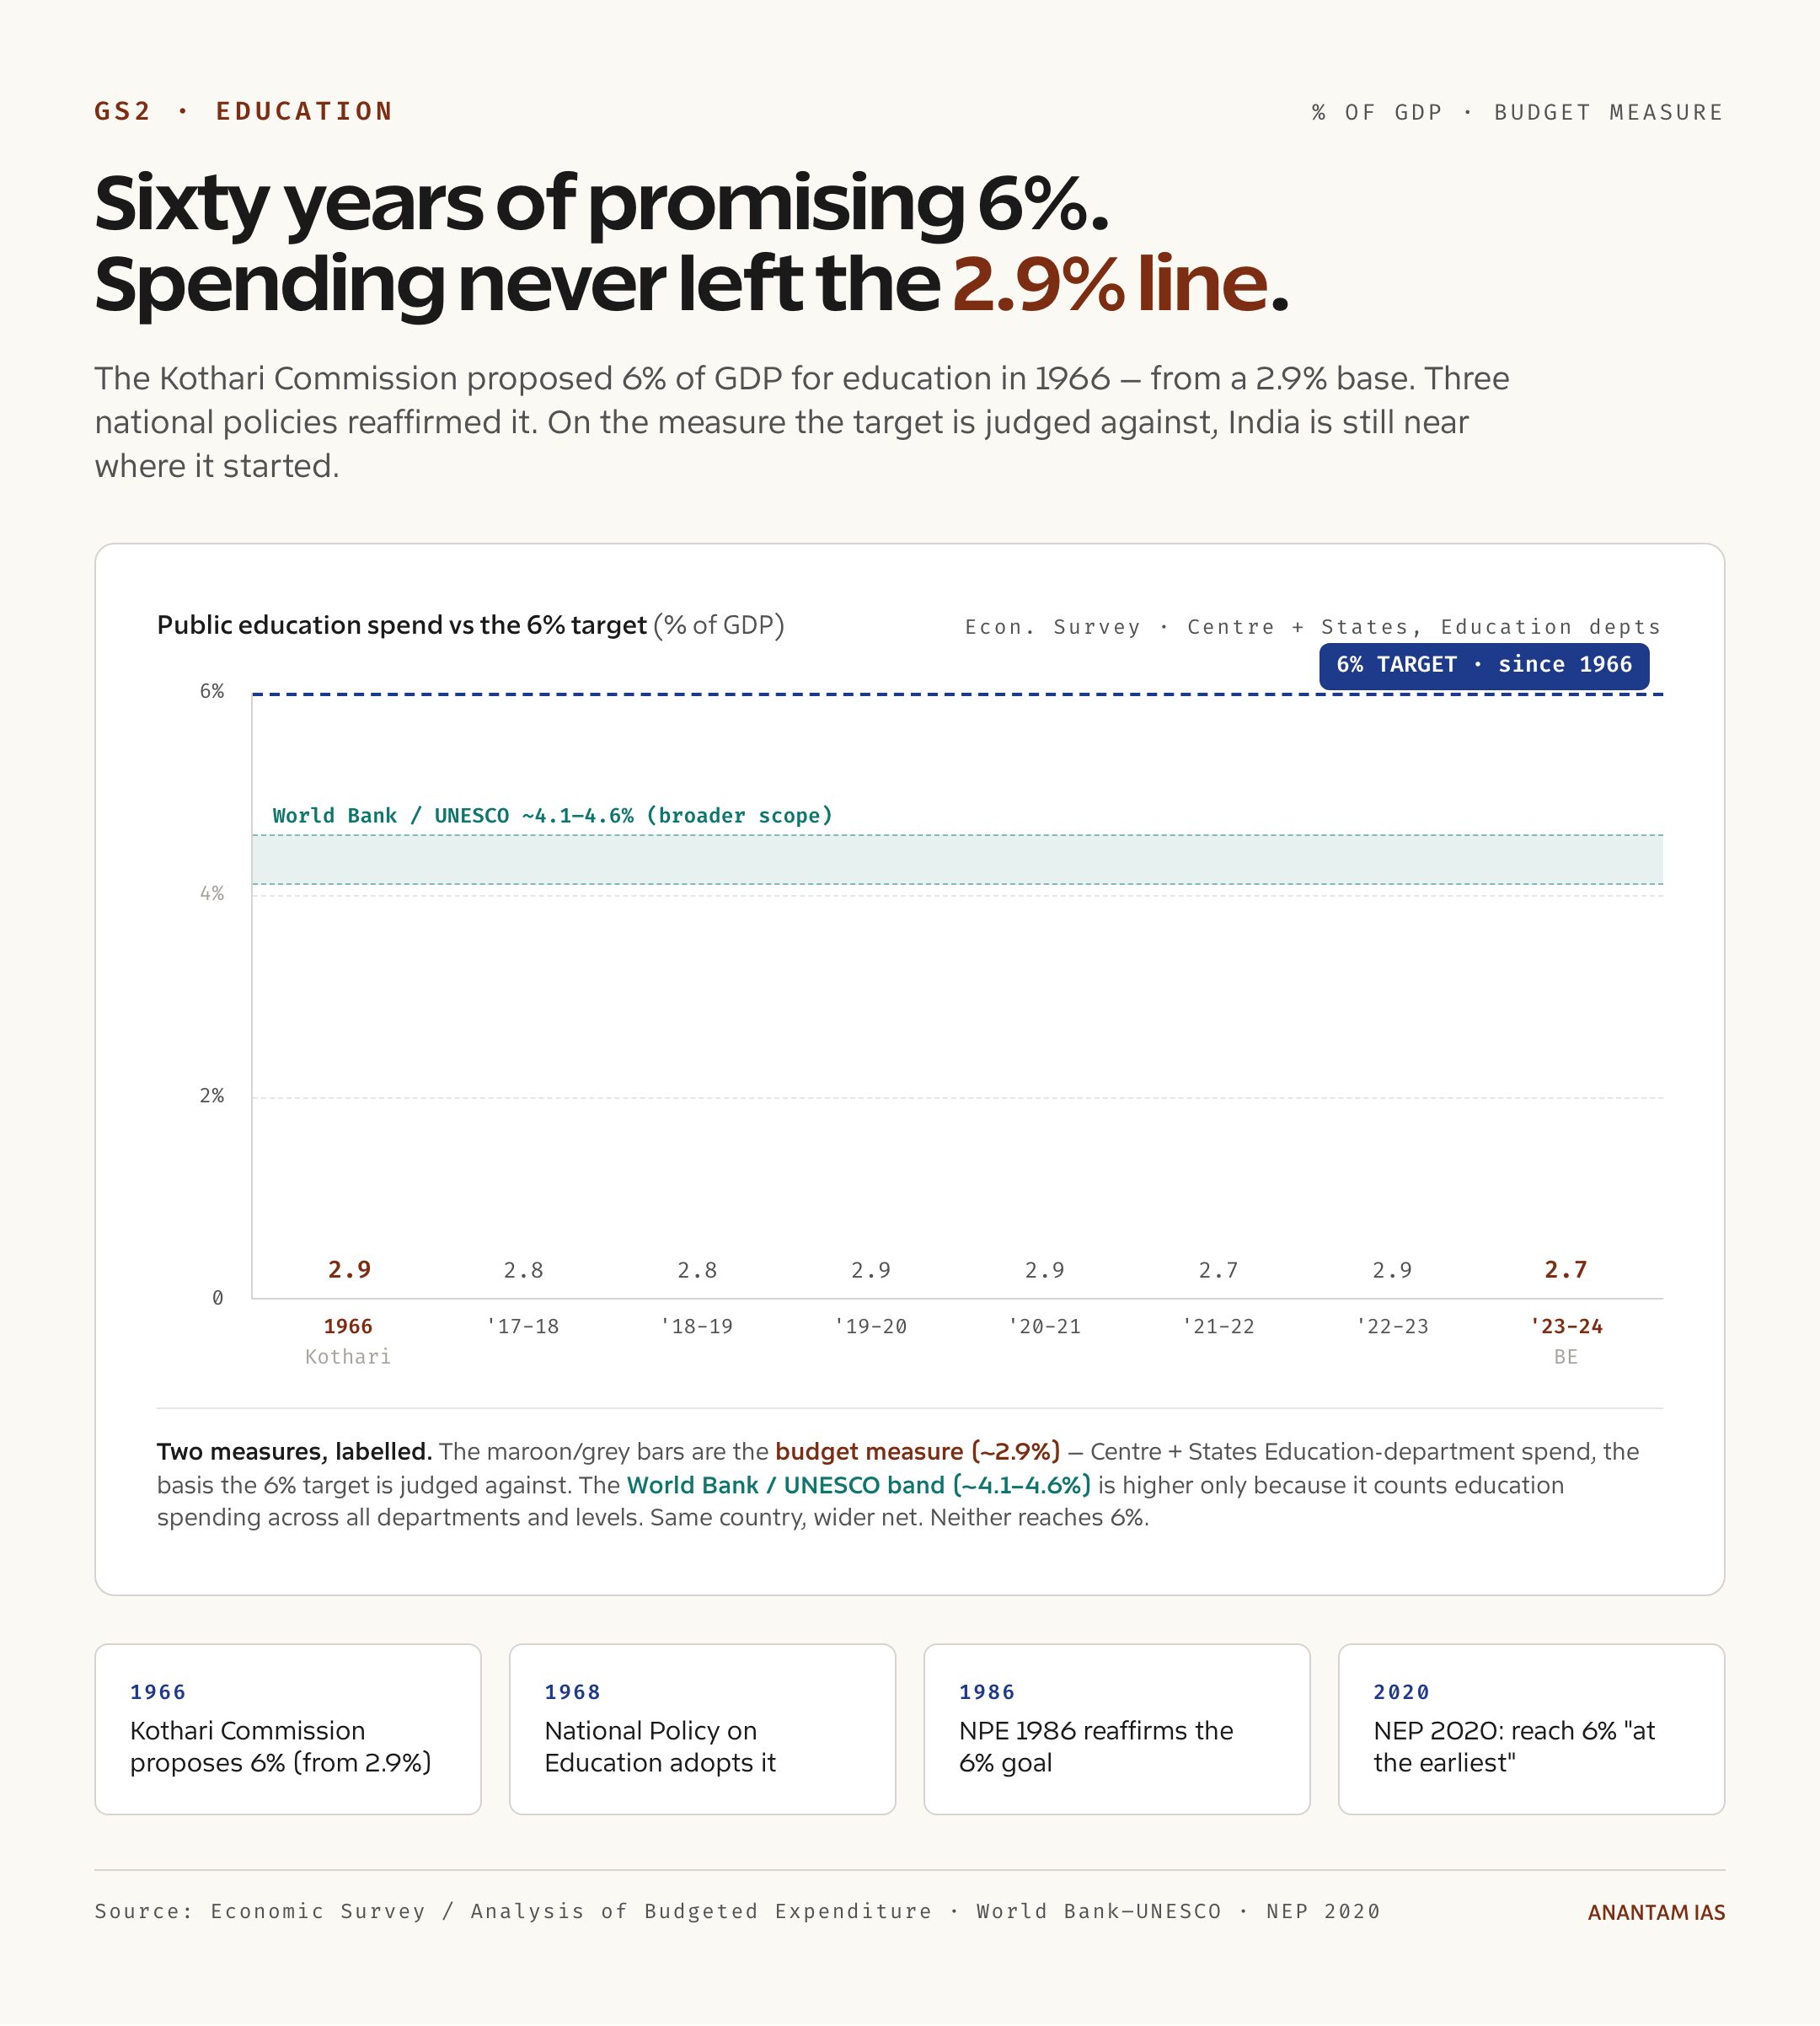
There are two different “education spend as a share of GDP” numbers in circulation, and they don’t contradict each other. They measure different things. The first is the one Indian policy actually argues over. The Economic Survey and the Ministry of Education’s own “Analysis of Budgeted Expenditure on Education” track what the Education and HRD departments of the Centre and the states spend, and that figure sits at roughly 2.7% to 2.9% of GDP. It’s been stuck in that band for years. The Economic Survey’s trend runs 2.8% in 2017-18, 2.9% around 2019-20 and 2020-21, then 2.7% in 2021-22, back to 2.9% in 2022-23, and 2.7% again in the 2023-24 budget estimate. That’s the number that gets held up against the 6% target, and rightly so, because it’s the one Indian governments use on themselves.
The second number is broader. The World Bank, drawing on UNESCO’s statistics institute, reports India’s “government expenditure on education” at around 4.1% to 4.6% of GDP – 4.64% in 2021, easing to about 4.1% in 2022, its most recent available year. So why is it so much higher? Because it counts education spending across all government departments and levels, not just the Education-department line, and it follows international UNESCO definitions. Same country, wider net, bigger number. The World Bank figure isn’t proof that India secretly spends more than the Survey admits. It’s a different scope.
Here’s the line to carry into any answer: the 4% figure is real, the 2.9% figure is real, and the honest move is to name which one you’re using and why. For the 6%-target debate, the Economic Survey’s roughly 2.9% is the right benchmark, because that’s the measure the target was always meant to be judged against.
So the gap is large by India’s own accounting. That’s the input side of the story. The learning side is where it gets uncomfortable.
What the Data Says
Start with the target itself, because the history is the whole point. The Kothari Commission, India’s Education Commission of 1964 to 1966, recommended raising educational expenditure from 2.9% of GDP to 6%, to be reached by 1985-86. India’s first National Policy on Education in 1968 adopted that ambition, the 1986 policy repeated it, and the National Education Policy 2020 wrote it again almost word for word, committing the Centre and states to “increase the public investment in Education sector to reach 6% of GDP at the earliest.” Four endorsements across more than fifty years. Zero years at 6%.
Sit with the irony. Kothari’s starting point in 1966 was 2.9% of GDP. On the Economic Survey’s comparable measure, India is still hovering around 2.7% to 2.9% today. Six decades, and the input share has barely moved off the line the commission wanted India to leave behind.
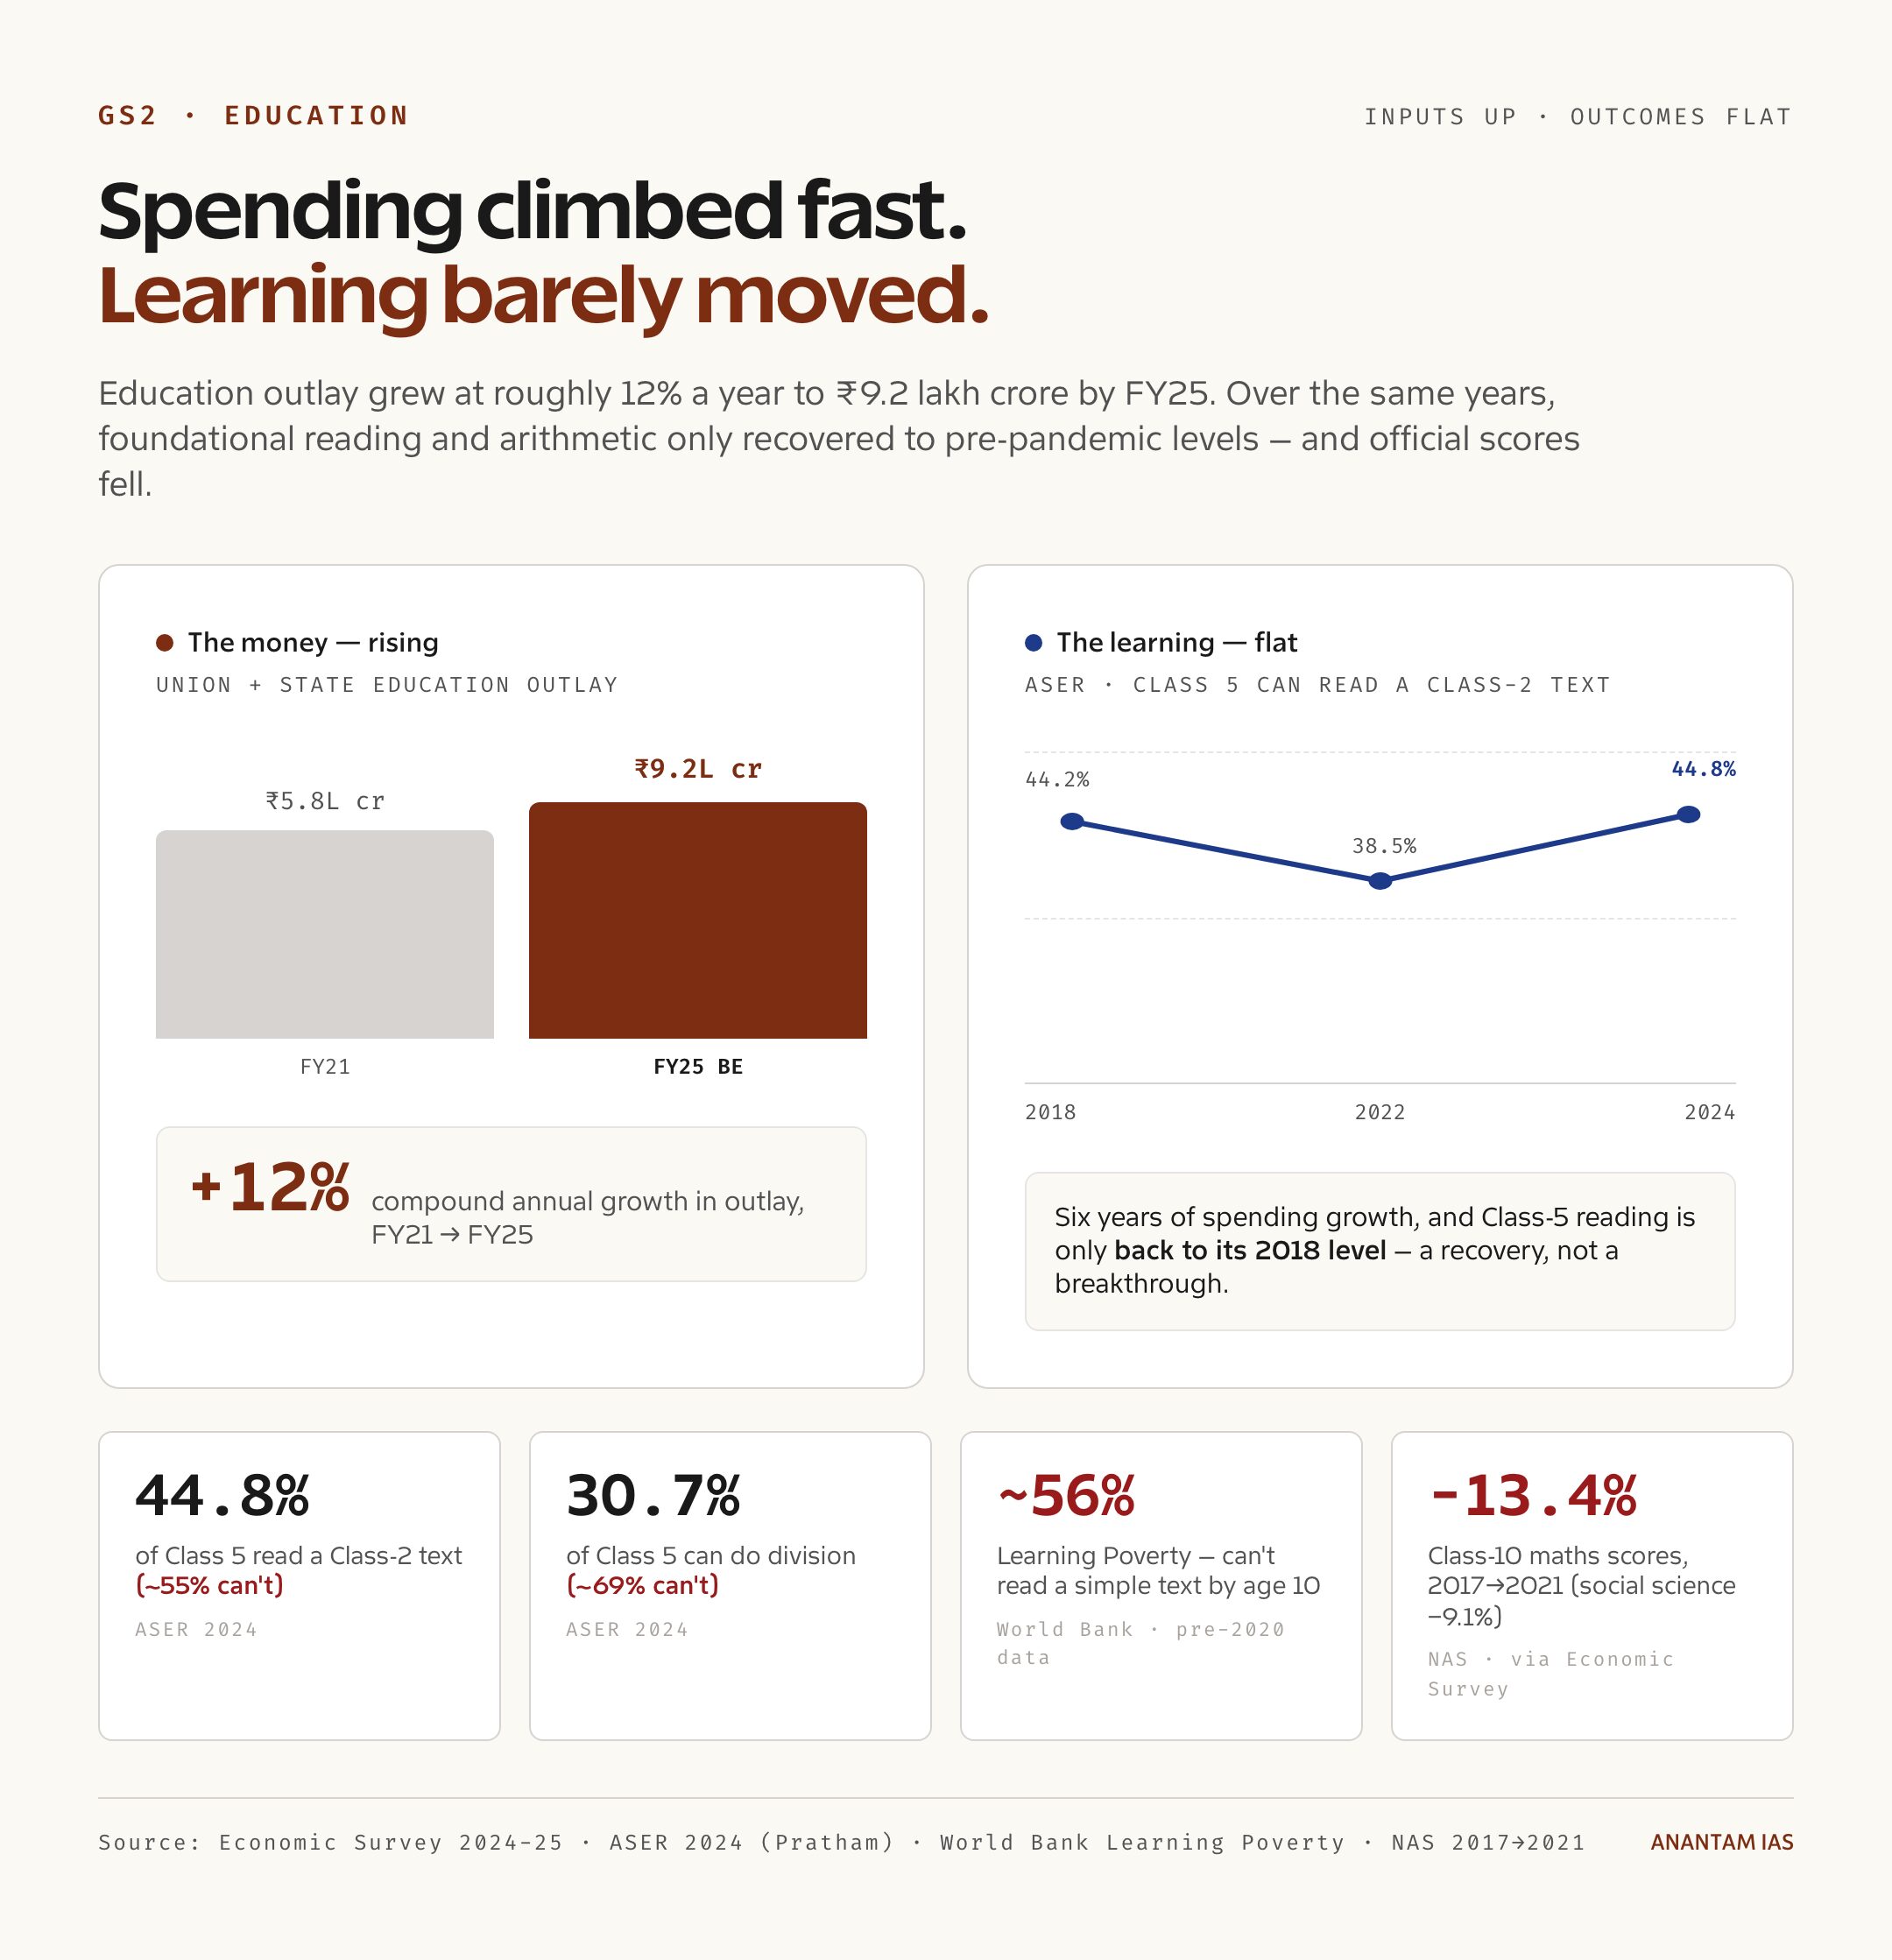
Now, the spending isn’t flat in absolute terms – that’s a separate point worth keeping straight. The Economic Survey 2024-25 records education spending growing at about a 12% compound annual rate to ₹9.2 lakh crore in the FY25 budget estimate, up from ₹5.8 lakh crore in FY21. So the rupees climbed fast. The share of GDP didn’t, because the economy grew alongside it. Rising rupees, stuck percentage. That distinction trips up a lot of answers.
There’s a federal fact underneath all of this. States carry the bulk of public education spending, roughly 80% to 85% of it, with the Centre contributing the rest through schemes. One 2022-23 estimate puts the split as sharp as 89% states to 11% Centre. Education sits on the Concurrent List, a shared Centre-state subject, so reaching 6% isn’t something Delhi can deliver alone. It needs both tiers to lift outlays together, which is exactly why NEP 2020 phrased it as the Centre and states “working together.” The central allocation by itself is only about 0.3% to 0.4% of GDP.
And the latest allocation is genuinely the largest yet. The Union Budget 2025-26 gave the Ministry of Education ₹1,28,650 crore, split into ₹78,572 crore for school education and literacy and ₹50,078 crore for higher education, with ₹7,500 crore for PM SHRI model schools inside that. Highest-ever in nominal terms. But here’s the catch a parliamentary panel flagged: only about 55% of the Samagra Shiksha allocation had actually been spent up to February of FY26. Money allocated isn’t money spent. Hold that thought, because it returns later.
Then comes the part that should stop you. ASER 2024, Pratham’s rural survey of 6,49,491 children across 17,997 villages in 605 districts, found that only 44.8% of Class 5 children can read a Class-2-level text. So about 55% can’t. Only 30.7% of Class 5 children can do simple division, which means roughly 69% can’t. Reading and arithmetic did recover from the pandemic dip, and that recovery is real. But 2024’s levels are barely back to where they sat in 2018. A bounce-back, not a breakthrough.
The World Bank’s “Learning Poverty” measure tells the same story from a different angle. It defines learning poverty as being unable to read and understand a short, age-appropriate text by age 10, and it pegs India at about 56% – over half of late-primary children not reading proficiently. That figure rests on pre-pandemic 2017 data published in an April 2024 brief, so treat it as a structural snapshot rather than a fresh reading. India’s official assessment, the National Achievement Survey, points the same way: comparing 2017 to 2021, Class 10 mathematics scores fell about 13.4% and social science about 9.1%. Outcomes slipped during years when spending rose.
One more for scale at the top end. The Gross Enrolment Ratio in higher education, the share of the 18-to-23 age group actually enrolled, stood at 28.4% in 2021-22 per AISHE, up from 23.7% in 2014-15. Progress, but it still means roughly 7 in 10 young Indians in that band aren’t in higher education at all, against NEP 2020’s target of 50% by 2035.
The Case For
The case for spending more is strong, and an answer that brushes it aside reads as lazy. So let’s state it at full strength.
Six decades and India never hit 6%. The promise has been made by the Kothari Commission, the 1968 policy, the 1986 policy, and NEP 2020, and it has never been kept. On the Economic Survey’s measure, India is still near 2.9%, almost exactly where Kothari started in 1966. A target that survives four endorsements and zero deliveries isn’t aspirational anymore. It’s a structural failure to fund, and the gap to 6% is roughly three percentage points of GDP that the country keeps promising and not finding.
The system leans on states with uneven pockets. Because states fund 80% to 85% of public education and the Centre only around 15%, with the central share alone near 0.3% to 0.4% of GDP, a poorer state simply can’t match a richer one’s per-child spend. So under-resourced states and the first-generation learners in them need more public money to catch up, not less. Equity isn’t a slogan here. States that spend more per child tend to post better ASER results, which means money, spent where it’s scarce, does move outcomes.
Real access gaps still cost money to close. The Economic Survey itself records computers in schools rising from 38.5% in 2019-20 to 57.2% in 2023-24, and internet access from 22.3% to 53.9%. That’s progress. It also means roughly 4 in 10 schools still lacked computers as recently as 2023-24. You don’t close that with exhortation. You close it with capital.
And the top of the pyramid is thin. A Gross Enrolment Ratio of 28.4% against a 50%-by-2035 target means India needs far more quality seats, faculty, and institutions, plus the research funding that underpins a knowledge economy. That’s sustained outlay, year after year. So the input case is genuine: by its own benchmark, India underfunds education, and the bill to fix access, equity, and higher-ed capacity is real.
The Case Against
Here’s what the “just spend 6%” case walks past. More money, poured into a system that already wastes a chunk of what it gets, doesn’t automatically reach a child. The binding constraint in India isn’t only how much goes in. It’s how little learning comes out per rupee.
Spending rose, learning didn’t keep pace. Education outlay grew at roughly 12% a year to ₹9.2 lakh crore by FY25, yet NAS scores fell between 2017 and 2021 and ASER still shows under half of Class 5 reading at a Class-2 level. Inputs up, outcomes flat to down. If money alone fixed learning, the curve would already have bent.
The foundational crisis is a quality problem, not a quantity one. A World Bank Learning Poverty rate near 56% means more than half of India’s 10-year-olds can’t read a simple text with understanding. You can’t build secondary schooling, skilling, or a higher-ed pipeline on children who never learned to read in the early grades. So the failure is upstream of the budget line, sitting in pedagogy, teacher capacity, and assessment.
Allocated money isn’t spent money. Come back to that parliamentary finding: only about 55% of the Samagra Shiksha allocation was used up to February of FY26. That’s an absorption gap, a delivery failure, not a funding shortfall. Raising the allocation while half of it goes unspent is pouring water into a leaking bucket and calling for a bigger tap.
The debate fixates on the wrong target. India’s policy conversation obsesses over the 6% input figure while the harder metric, learning per rupee, gets less airtime. Efficiency, teacher quality, accountability, honest assessment through NAS and the PARAKH centre – those move outcomes. A round number on a budget chart doesn’t, on its own. So the case against isn’t “don’t spend more.” It’s “don’t pretend spending more is the whole answer, because the evidence says it isn’t.”
The Deeper Structural Read
Step back and the real fault line isn’t “spend more” versus “spend better.” It’s that India has spent fifty years measuring the wrong thing. The 6% target is an input metric. Learning is the outcome. And a system that polices its input while ignoring its output will keep doing exactly what India’s data shows: lifting rupees while reading scores barely twitch.
The two spending measures expose the same blind spot. When the World Bank’s broader 4% figure and the Survey’s 2.9% figure float around the debate, the argument becomes about which percentage is “true.” But notice what nobody’s measuring in that fight: whether the children learned. You can win the accounting argument and still lose the classroom. So the deeper read is that the 6% promise, for all its history, trained policy attention on the budget line and away from the desk where a child is supposed to read.
There’s a federalism layer that makes this worse. Education on the Concurrent List means the spending power and the delivery capacity sit largely with states, while the headline 6% target is set nationally. So the Centre can announce the goal, but the states have to fund and run the schools, and their capacity to absorb and deliver varies enormously. That ₹55-out-of-₹100 utilisation gap on Samagra Shiksha isn’t a one-off scandal. It’s the predictable result of asking a thin state administration to absorb a centrally designed scheme without the people to spend it well. More allocation without more delivery capacity just widens the gap between sanctioned and spent.
And here’s the part that should bother a future administrator most. The learning crisis is concentrated in the early grades, exactly where the cheapest, highest-return spending lives. Getting a child reading by age 8 costs far less than remediating a 15-year-old who never learned. Yet foundational literacy and numeracy, run through NIPUN Bharat under Samagra Shiksha, is where the absorption gaps and capacity shortfalls bite hardest. So the system under-delivers precisely where each rupee would buy the most learning. That’s not a money problem. That’s a priorities-and-capacity problem wearing a money problem’s clothes.
The honest diagnosis, then, is dual. India does underfund education against its own sixty-year benchmark. And India under-converts the funding it has into learning. Treat it as one problem or the other and the prescription comes out half-right, which in policy terms means wrong.
What Should Be Done
So what does a serious fix look like? Not a slogan about “balance,” but a set of moves that lift the money and the learning together. Seven of them, and they reinforce each other.
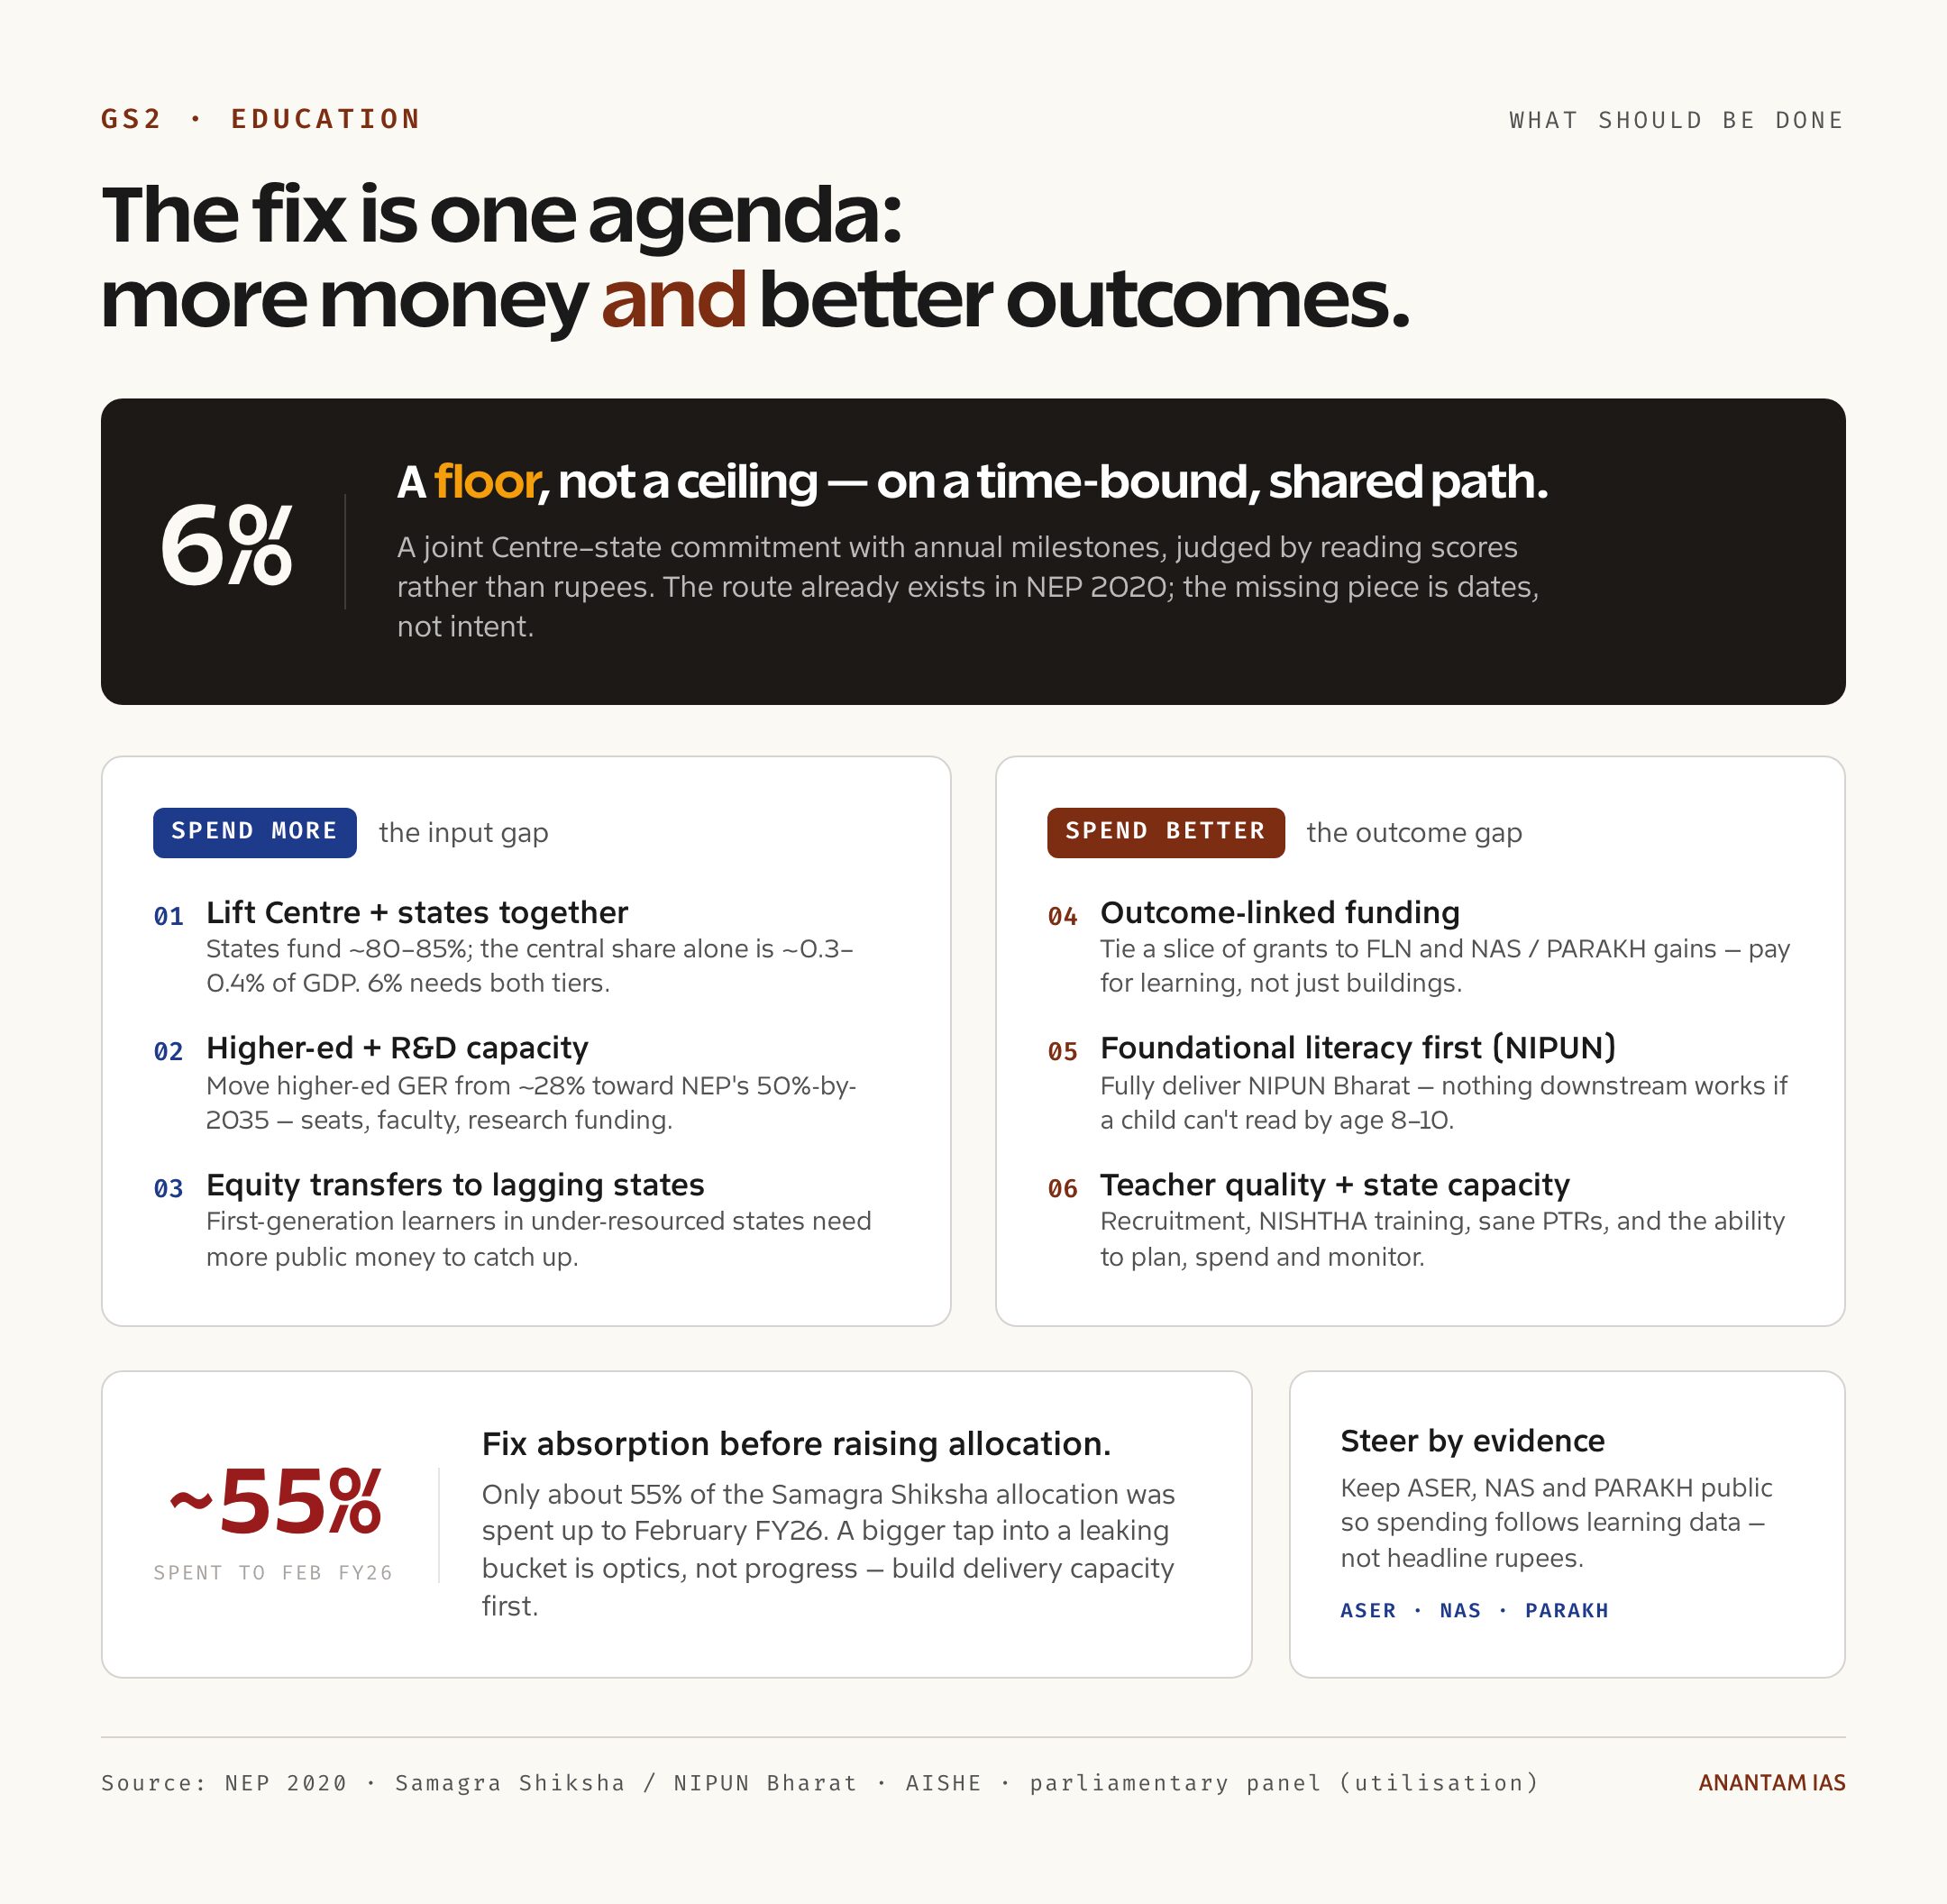
- Treat 6% as a shared floor on a time-bound path. Make it a joint Centre-state commitment with annual milestones, the way NEP 2020 already frames it, so the goal stops being a sixty-year aspiration and starts being a schedule. The reform machinery is laid out in the National Education Policy 2020 – the missing piece is dates, not intent.
- Tie a slice of grants to learning, not just buildings. Outcome-linked funding means paying partly for measurable FLN gains and NAS or PARAKH results, not only for enrolment counts and construction. Reward the states that move reading scores, and the incentive finally points at the classroom.
- Fund foundational literacy and numeracy first, and deliver it. Fully resource NIPUN Bharat and extend it through Class 5, because nothing downstream works if a child can’t read by age 8 to 10. The Learning Poverty logic is blunt: fix the base, or everything built on it stays shaky. The mission’s design sits within Samagra Shiksha, so the route already exists.
- Spend the leverage point: teachers. Recruitment, training through NISHTHA, sane pupil-teacher ratios, and real on-ground accountability are the highest-return uses of any new rupee. A good teacher beats a new building for raising outcomes, and the data on stalled learning says the teaching-quality loop isn’t yet closing.
- Fix absorption before raising allocation. Close the roughly 55% Samagra Shiksha utilisation gap by building state-level capacity to plan, spend, and monitor. A bigger allocation into a system that can’t spend the current one is optics, not progress. Strengthen the delivery machine first.
- Expand higher-ed and research capacity. Move the Gross Enrolment Ratio from about 28% toward the 50%-by-2035 target with more quality seats, faculty, and research funding, so the knowledge economy has people and ideas to draw on. This is where sustained capital outlay genuinely matters.
- Steer by evidence, not optics. Keep both the independent citizen survey, ASER, and the official assessments, NAS and PARAKH, running and public, so spending decisions follow learning data rather than headline rupees. You can read the live snapshot on India’s education spending and learning outcomes and judge the 6% promise against what children actually know.
Every one of these lifts either the money or the learning, and several lift both. A 6% that’s spent well, judged by reading scores rather than rupees, is a promise worth finally keeping. A 6% spent the way ₹55-of-₹100 gets spent now would just be a more expensive version of the same failure.
For Your Mains Answer
This is a clean GS2 topic that doubles as GS3 and essay material. It links social-sector funding, federalism, government schemes, and human-capital policy in one frame, and it rewards a candidate who can hold “more money” and “better outcomes” together without collapsing into one.
GS paper mapping: GS2: development and management of the social sector and services relating to education; government policies and interventions and their design and implementation; Centre-state relations and the Concurrent List. With a GS3 crossover on public expenditure, fiscal federalism, and human capital, and an essay or GS4 crossover on accountability in public spending.
Likely question frames:
- India has pursued a 6%-of-GDP education target since 1966 without achieving it. Critically examine whether the binding constraint is the quantity of spending or its quality.
- “More money is necessary but not sufficient to fix Indian school education.” Discuss in light of recent learning-outcome data.
- Education is on the Concurrent List, yet the 6% target is set nationally. Analyse how this federal design shapes both funding and outcomes.
Quotable data points:
- The 6%-of-GDP target dates to the Kothari Commission (1966), reaffirmed by NPE 1968, NPE 1986, and NEP 2020, and never achieved.
- India’s Centre-plus-states budgeted education spend sits near 2.7% to 2.9% of GDP on the Economic Survey measure; the broader World Bank/UNESCO measure is about 4.1% to 4.6% because it counts all departments and levels.
- Kothari’s 1966 starting point was 2.9% of GDP; India is roughly there still, six decades on.
- States fund about 80% to 85% of public education; the central allocation alone is near 0.3% to 0.4% of GDP.
- Union Budget 2025-26 gave the Ministry of Education ₹1,28,650 crore (₹78,572 crore school, ₹50,078 crore higher) – yet only about 55% of Samagra Shiksha was spent up to February FY26.
- ASER 2024: 44.8% of Class 5 children can read a Class-2 text, and only 30.7% can do division.
- World Bank Learning Poverty for India is about 56%, drawn from pre-pandemic 2017 data.
- NAS 2017 to 2021: Class 10 maths down about 13.4%, social science down about 9.1%.
- Higher-education GER is 28.4% on AISHE’s 2021-22 reading, against NEP 2020’s 50%-by-2035 target.
Keywords to use: education expenditure as a share of GDP, the two spending measures, 6% target, Concurrent List, Centre-state fiscal sharing, foundational literacy and numeracy, learning poverty, outcome-linked funding, fund-utilisation gap, learning per rupee.
Syllabus linkages: social-sector development and services, government policies and their implementation, federalism and the Concurrent List, human-resource and capacity-building, public expenditure and fiscal federalism.
Balanced conclusion line: The 6% promise is worth keeping, but only if India stops treating it as the finish line; a rupee that doesn’t reach a reading child fails the target even when it’s counted toward it.
How to Build the Answer
Open with the conflict, not a definition. The sharp first sentence is that India has both an underfunding problem and an under-learning problem, and the 6% debate hides the second behind the first. That tells the examiner you see past the headline number. Save the definition of the measures for the second sentence, where it does real work.
Bring data in early and ration it. One strong opening body paragraph can carry three figures: stuck near 2.9% against a 6% target since 1966, ASER’s 44.8% of Class 5 reading at a Class-2 level, and only 55% of Samagra Shiksha spent. Then say what each proves. The figure is the anchor; the “this means” is the mark.
Steelman both sides before you judge. If you argue for more spending, first concede the absorption gap and the flat learning curve. If you argue that money isn’t the issue, first concede that 80% to 85% state-funding leaves poorer states genuinely short. That’s how an answer reads balanced without going mushy.
Group the way forward, don’t scatter it. Cluster the reforms into “spend more” and “spend better,” then show they’re one agenda: a shared 6% floor, outcome-linked grants, FLN first, teacher quality, fixing absorption, higher-ed capacity, evidence-led steering. Use the topic’s own vocabulary so it reads as policy analysis, not news recap.
Close on the syllabus link and on judgment, not summary. The reliable pattern is “the goal is not X alone, but X delivered as Y,” which lets you balance funding with outcomes. The last line should not echo the introduction. It should show you’ve decided what the data means.
Common Mistakes to Avoid
- Don’t cite “% of GDP” without naming the measure. Saying India spends 4% or 2.9% without labelling which basis is the single fastest way to look unprepared on this exact topic.
- Don’t treat the two figures as a contradiction. The World Bank’s 4% and the Survey’s 2.9% measure different scopes. Explain it; never imply one is a cover-up.
- Don’t argue only “spend more.” The strongest counter, that allocated money goes unspent and learning still falls, has to appear, or the answer is one-sided.
- Don’t drown the answer in numbers. Three well-explained figures beat ten dumped ones. Pick the national scale, the learning gap, and the absorption gap.
- Don’t end on a slogan. Close with an implementable principle, like outcome-linked funding or a time-bound shared floor, not a flourish about “the future of the nation.”
A Compact Answer Spine
- Introduction: Open with the dual problem, underfunding and under-learning; clarify the two spending measures in the next sentence.
- The promise: 6% since Kothari 1966, reaffirmed three times, never met; India still near its 1966 starting point.
- Evidence: Pair a spending figure with a learning figure, ASER 44.8% and NAS declines, and add the 55% utilisation gap.
- Two sides: The case for more money (equity, access, GER); the case that money alone won’t fix it (absorption, foundational crisis).
- Structural diagnosis: Input target versus outcome reality; Concurrent List splits funding and delivery.
- Way forward: Grouped reforms, “spend more” and “spend better,” shown as one agenda.
- Conclusion: Adapt the balanced line to the exact question wording.
Diagram or Flowchart Idea
For a 15-marker, draw one causal chain rather than a decorative web. The cleanest here: 6% target set nationally → states fund 80% to 85% with uneven capacity → allocation rises but only about 55% is spent → foundational learning stays weak, as ASER and the World Bank’s Learning Poverty measure show → fix needs both higher outlay and outcome-linked delivery. An examiner reads that logic in five seconds.
For a 10-marker, skip the diagram and use a two-column table instead: “Spend more (the input gap)” against “Spend better (the outcome gap),” with three rows each. It does more work under time pressure and is faster to evaluate.
Ethics and Governance Angle
Add one line of governance ethics even in a GS2 answer. The unspent 55% of a scheme meant for poor children isn’t a neutral accounting fact. It’s a question of administrative responsibility: who answers for money sanctioned in a child’s name and never delivered to her classroom? Naming that accountability gap sharpens the answer beyond economics.
Then convert the concern into design. Don’t just say “improve accountability.” Say how: tie grants to learning gains, publish utilisation data, build state delivery capacity before raising allocations. That’s the move from moral language to administrative maturity, and it’s exactly what the examiner rewards on a public-spending question.
A sentence pattern that travels well: “The objective is legitimate, but its legitimacy depends on delivery, not on the size of the allocation.” It accepts the 6% goal without handing the system a blank cheque.
How to Use Data Without Sounding Mechanical
Use fewer numbers than you know. Lead with one big anchor, the 6% target unmet since 1966, follow with one contrast, ASER’s 44.8% of Class 5 reading at a Class-2 level, and add one implementation gap, the 55% Samagra Shiksha utilisation. One target, one outcome, one delivery failure is usually enough for a paragraph.
Never leave a statistic standing alone. Follow it with “this means” or “the policy implication is.” That small move turns a fact sheet into analysis. In Mains, facts are raw material; the inference is the finished answer.
Always label the measure. On this topic especially, a number without its basis is worse than no number, because it signals you don’t understand the debate. “On the Economic Survey measure, about 2.9%” reads as control. A bare “4%” reads as guesswork.
One last sweep: cut any line that sounds impressive but does no work, and replace it with a fact, a cause, a consequence, or a reform. That habit separates an answer that feels informed from one that feels memorised.
FAQ
Why does India report two different figures for education spending as a share of GDP?
Because they measure different things. The Economic Survey and the Ministry’s “Analysis of Budgeted Expenditure” track spending by the Education and HRD departments of the Centre and states, which comes to about 2.7% to 2.9% of GDP. The World Bank and UNESCO use a broader definition that captures education spending across all government departments and levels, so it reports a higher figure of roughly 4.1% to 4.6%. Neither is wrong; for the 6%-target debate, the Economic Survey’s roughly 2.9% is the right benchmark.
Where does the 6%-of-GDP target come from, and has India ever met it?
The Kothari Commission first proposed 6% in 1966, aiming to reach it by 1985-86. India’s National Policy on Education in 1968 adopted it, the 1986 policy repeated it, and NEP 2020 reaffirmed it. India has never achieved it; on the Economic Survey’s measure, public education spending is still near 2.7% to 2.9% of GDP, almost exactly Kothari’s 1966 starting point of 2.9%.
If spending has been rising, why are learning outcomes still weak?
Because spending more isn’t the same as spending well or spending fully. Education outlay grew at about 12% a year to ₹9.2 lakh crore by FY25, yet ASER 2024 found only 44.8% of Class 5 children can read a Class-2 text, NAS scores fell between 2017 and 2021, and only about 55% of the Samagra Shiksha allocation was spent up to February FY26. The binding constraints are foundational learning, teacher quality, and the gap between money allocated and money delivered.
Why can’t the Centre simply raise spending to 6% on its own?
Because education is on the Concurrent List and states fund roughly 80% to 85% of public education, with the central allocation alone near 0.3% to 0.4% of GDP. Reaching 6% needs both the Centre and the states to lift outlays together, which is why NEP 2020 frames it as the Centre and states “working together.” It’s a coordination problem as much as a budgeting one.
Tell Google you want more of this.
Add Anantam IAS as a preferred sourceOne tap, and this site shows up more often in your own Top Stories, AI Overviews and AI Mode. Remove it any time.