Energy Poverty in India: Causes, Schemes, and 2024-26 Roadmap (UPSC Economy)
Energy poverty stalls human development. Master India's per-capita gap, Ujjwala, Saubhagya, KUSUM, PM Surya Ghar and 2024-26 reforms for UPSC GS-III.
Energy poverty is the inability to access affordable, reliable, and modern energy services — electricity for lights and appliances, clean cooking fuel for kitchens, motive power for productive activity. It is a silent driver of multidimensional poverty because without energy, education, healthcare, livelihoods, and dignity all suffer. Despite housing 17.7 percent of the world's population (2024), India consumes only around 6-7 percent of global primary energy, and per-capita energy consumption is one-third of the global average. SDG 7 calls on countries to ensure affordable, reliable, sustainable, and modern energy for all by 2030. India has made remarkable strides — near-universal household electrification through Saubhagya, 10+ crore LPG connections under Ujjwala, and 1 crore rooftop solar households under PM Surya Ghar — but the quality of access (frequent power cuts, refill burden, kerosene reliance) remains the deeper challenge. This guide unpacks the data, schemes, and 2024-26 roadmap for UPSC GS-III on inclusive growth, infrastructure, and environment.
What Energy Poverty Means
Energy poverty has three dimensions:
- Access — having a connection to electricity, clean cooking fuel, or modern transport energy.
- Affordability — being able to pay for actual usage (refills, tariff bills, fuel costs).
- Quality — reliability of supply, hours of availability, voltage stability, supply continuity.
A household with a working electric meter but only 6 hours of supply at unstable voltage, or an Ujjwala connection but only 1-2 refills a year because of cost, is still energy-poor.
Why Energy Poverty Matters
The World Bank and IEA establish a direct positive correlation between per-capita energy consumption and Human Development Index (HDI). Access to clean, affordable, safe energy automatically enables:
- Education — lighting for evening study, electronic learning, internet.
- Health — refrigeration of vaccines, oxygen plants, cold-chain medicines, indoor air quality.
- Livelihoods — irrigation pumps, food processing, cottage industries, MSMEs.
- Gender equity — women freed from fuel collection, cleaner kitchens, reduced indoor pollution-related deaths.
- Climate adaptation — fans and ACs to cope with heat waves, water pumping during droughts.
The Indian Energy Poverty Picture
Per-Capita Energy Consumption Gap
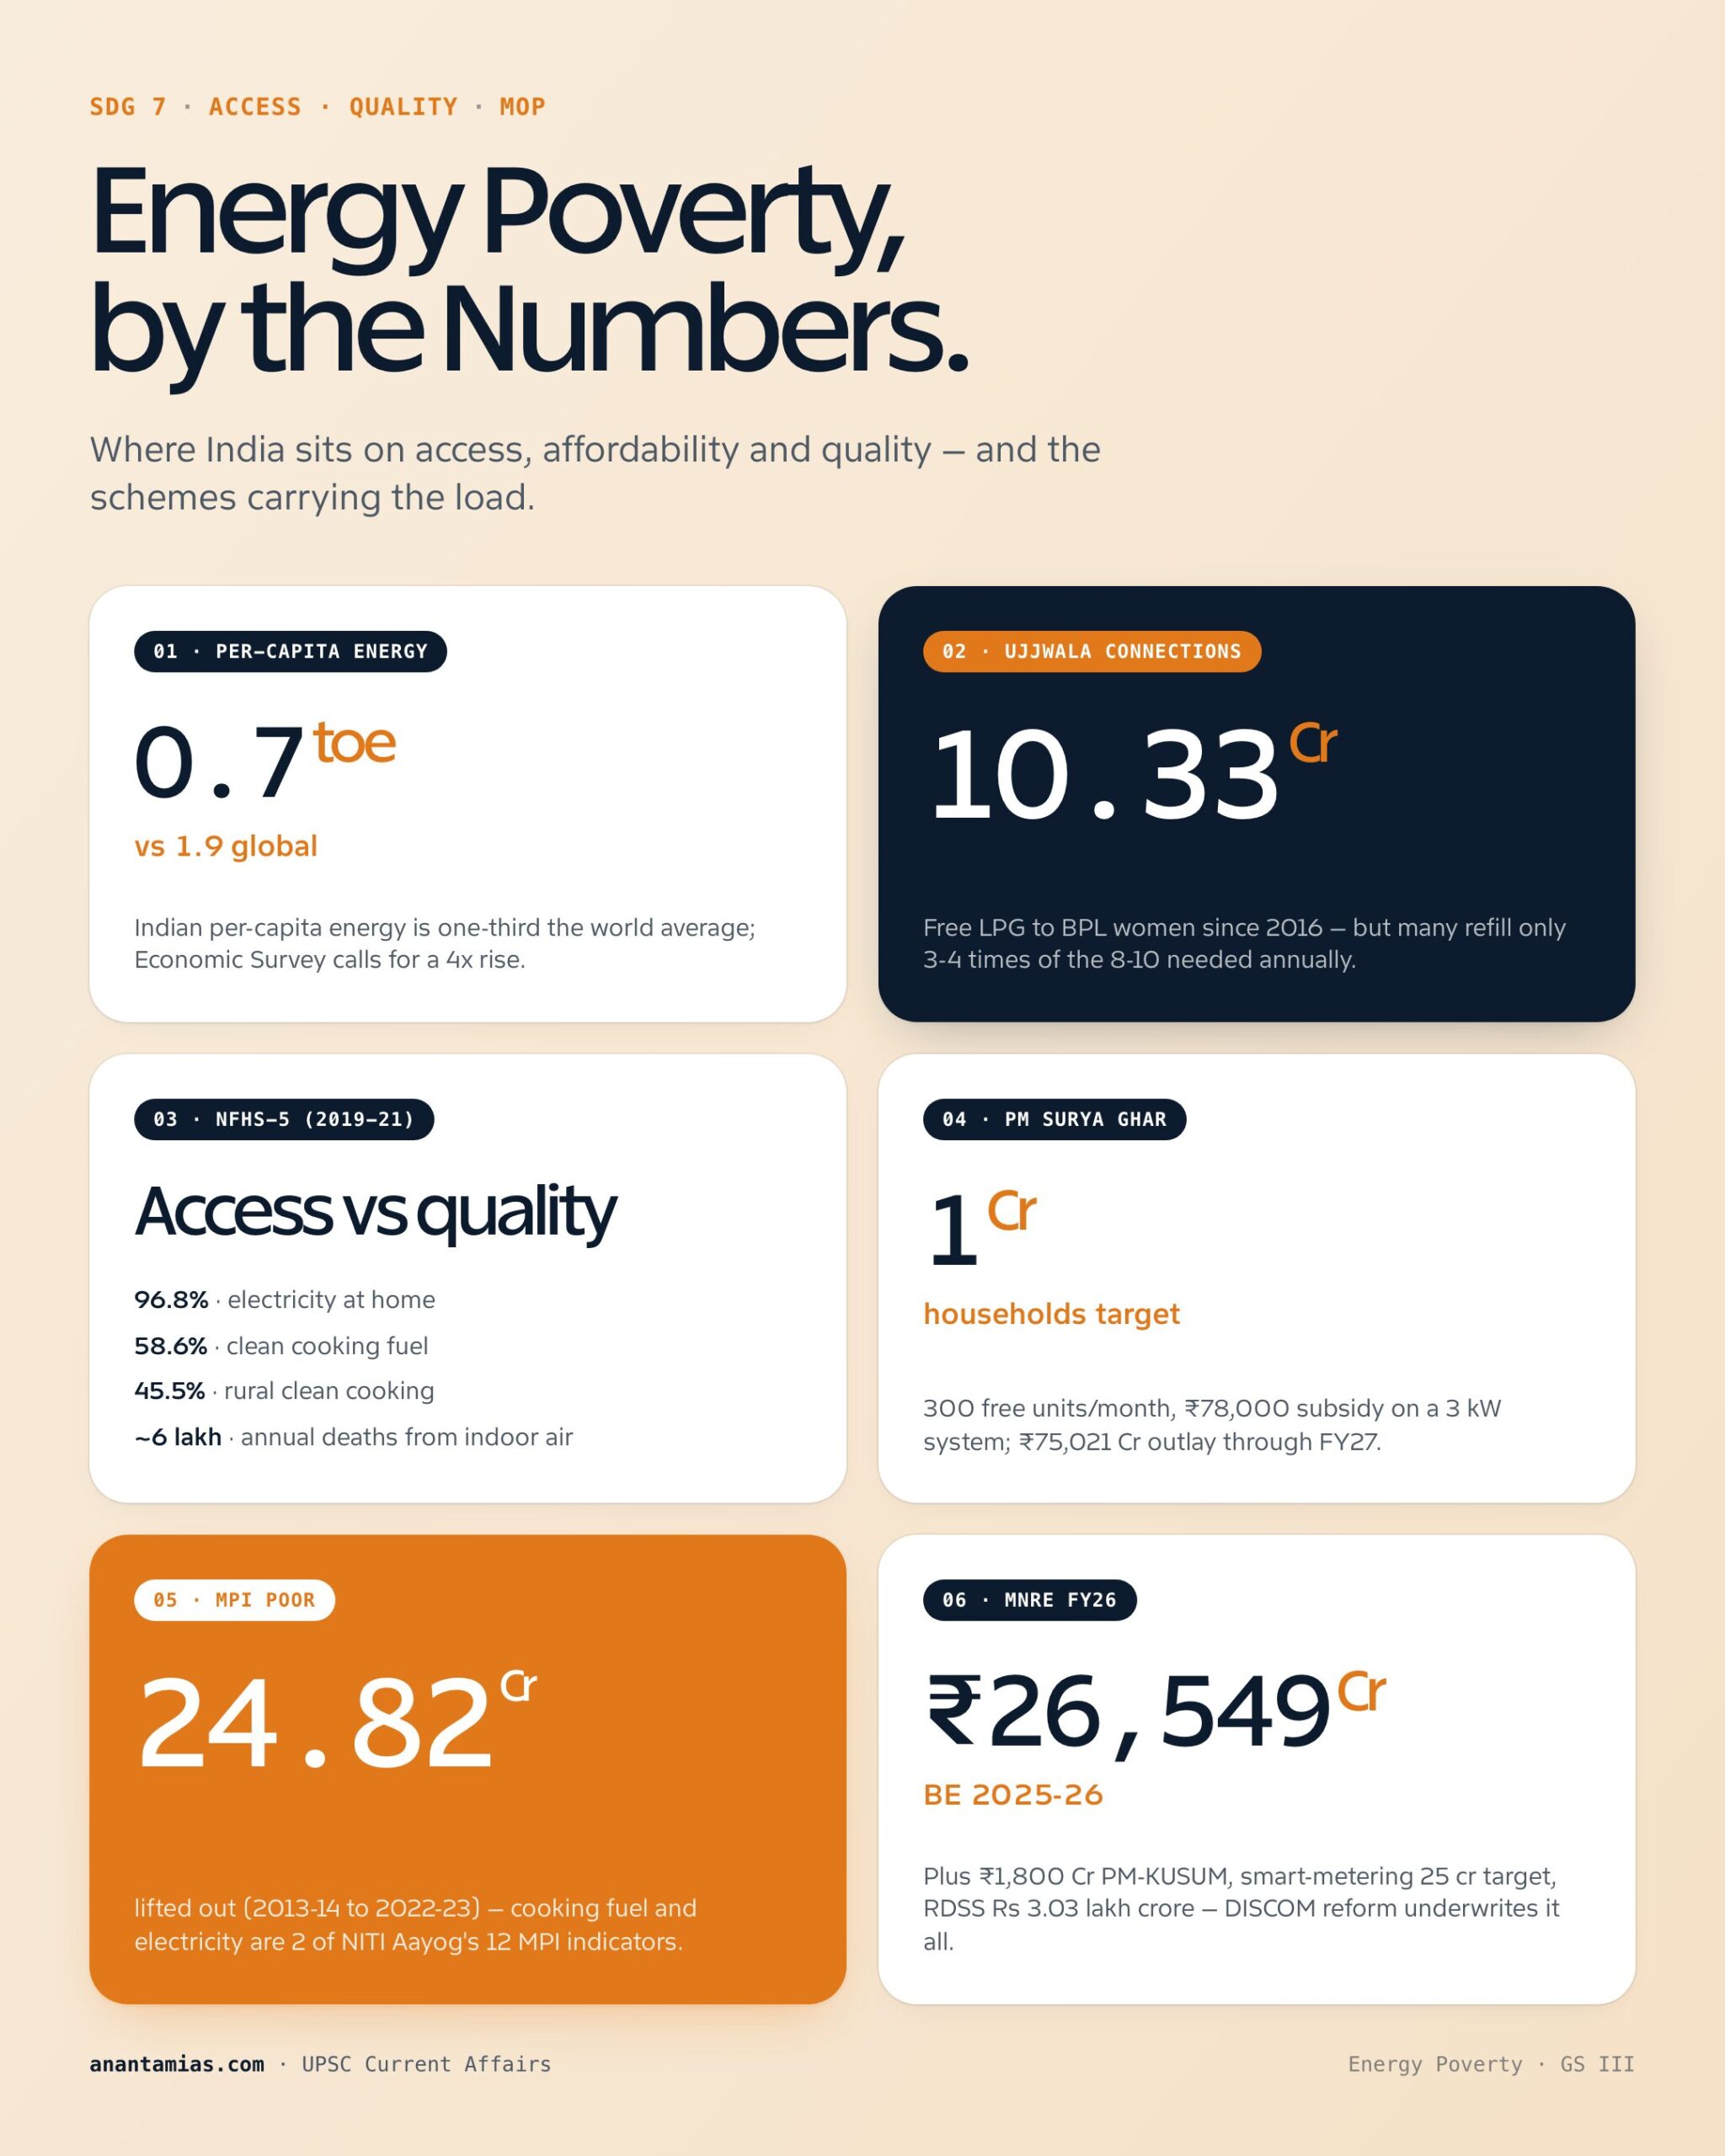
- India: ~0.7 toe (tonnes of oil equivalent) per capita.
- Global average: ~1.9 toe.
- Advanced economies: 4-7 toe.
- China: 2.7 toe.
India must increase per-capita energy use by 4x over the long run to attain advanced HDI levels — flagged by the Economic Survey 2018-19 and reiterated in subsequent surveys.
Urban-Rural Divide
- Electricity coverage: NFHS-5 (2019-21) showed 96.8 percent households had electricity connections; rural at 95.7 percent, urban at 99.0 percent.
- Daily power supply: Rural areas average 20-22 hours; urban areas 22-24 hours, but quality varies sharply across states.
- Clean cooking fuel: NFHS-5 showed 58.6 percent of households used clean cooking fuel; urban 86.6 percent, rural 45.5 percent.
- Refill rates: Many Ujjwala beneficiaries refill only 3-4 times a year versus the 8-10 cylinders needed for a fully fuel-switched kitchen.
Income Poverty vs Energy Poverty
A household above the income poverty line can still be energy-poor — affordability of refills, tariff hikes, or transport fuel is sticky. Energy poverty has its own dynamics that income statistics miss.
Major Schemes to Reduce Energy Poverty
Pradhan Mantri Ujjwala Yojana (PMUY)
- Launched May 2016; Ujjwala 2.0 in August 2021.
- Deposit-free LPG connection for women from BPL households; later expanded.
- Cumulative connections: 10.33 crore by 2024-25.
- Ujjwala 2.0 simplified eligibility — migrant workers, Antyodaya households eligible.
- Subsidy of Rs 300 per cylinder (up to 12 refills/year) restored in 2023, scaled.
Pradhan Mantri Sahaj Bijli Har Ghar Yojana (Saubhagya)
- Launched September 2017.
- Free electricity connection to all un-electrified households.
- Achievement: 2.86 crore connections by March 2021; near-universal household electrification declared.
Pradhan Mantri Kisan Urja Suraksha evam Utthaan Mahabhiyan (PM-KUSUM)
- Launched 2019.
- Three components:
- Component A: Solar power plants (500 kW-2 MW) on barren farmland.
- Component B: Solar pump-sets for irrigation.
- Component C: Solarisation of existing grid-connected pumps.
- Target: 30.8 GW of solar capacity by 2026, including 20 lakh standalone pumps.
Pradhan Mantri Surya Ghar Muft Bijli Yojana
- Launched February 2024.
- Rooftop solar for 1 crore households.
- 300 units of free electricity per month.
- Subsidy: up to Rs 78,000 per household (for 3 kW system).
- Outlay: Rs 75,021 crore for FY24-FY27.
PAHAL Scheme (DBTL)
- Direct Benefit Transfer for LPG — subsidy paid into bank accounts.
- Saved Rs 50,000+ crore by eliminating diversion (CAG audit).
National Mission on Enhanced Energy Efficiency (NMEEE)
- Under National Action Plan on Climate Change.
- PAT scheme (Perform, Achieve, Trade) for industry.
- Ujala scheme — over 36.86 crore LED bulbs distributed by EESL.
- S&L (Standards & Labelling) programme for appliances.
Recent Developments (2024-26)
PM Surya Ghar Scale-Up
- Over 20 lakh applications received within first year of launch.
- Subsidy disbursement under DBT mode; processing through PSU banks and DISCOMs.
- Net metering harmonised across states by 2024.
Ujjwala 2.0 Expansion
- 75 lakh additional connections announced in Budget 2023; consumed by 2024-25.
- Targeted subsidy continued at Rs 300/cylinder for PMUY beneficiaries.
PM-KUSUM Update
- By 2024, 6.5 lakh standalone solar pumps installed; component B and C scaling.
- Madhya Pradesh, Rajasthan, Maharashtra, Gujarat lead in deployment.
Smart Metering and DISCOM Reform
- Revamped Distribution Sector Scheme (RDSS) — Rs 3.03 lakh crore for smart metering, AT&C loss reduction.
- 25 crore smart meters target; 5+ crore installed by mid-2025.
- ToD (Time-of-Day) tariffs being rolled out across states (mandatory for commercial/industrial users by April 2024; for residential by April 2025).
National Green Hydrogen Mission
- Rs 19,744 crore outlay; targets 5 MMT/year capacity by 2030.
- Indirectly supports decentralised energy with rural pilots.
Budget 2024-25 and 2025-26
- PM Surya Ghar: Rs 6,250 crore (BE 2024-25); scaled up in 2025-26.
- MNRE allocation: Rs 26,549 crore in BE 2025-26.
- PM-KUSUM: Rs 1,800 crore in BE 2025-26.
NITI Aayog and Multidimensional Poverty
- NITI Aayog MPI 2023 (released 2023): cooking fuel and electricity are two of the 12 indicators; significant improvement noted.
- Multidimensional poor fell from 24.85 percent (2015-16) to 14.96 percent (2019-21) as per NFHS-5.
Strategy: How to Reduce Energy Poverty
1. Improve Quality of Access
Universal connections are achieved on paper; the gap is in 24×7 reliable supply, especially in rural and tribal regions. DISCOM reform under RDSS is critical — without solvent DISCOMs, supply quality cannot be sustained.
2. Increase Ujjwala Subsidy and Behavioural Nudges
- Higher subsidy quantum for refills.
- Behavioural nudges — gas pipelines for community kitchens, demonstration in self-help groups.
- Free first 4-5 refills for poorest households.
3. Address Power Cuts under Saubhagya Households
Many newly-electrified households still report frequent power cuts. Solutions:
- Feeder separation, dedicated agriculture feeders.
- Smart meters and ToD tariffs.
- Distribution transformer upgrades and line losses reduction.
4. Promote Electric Cooking
- Induction cookstoves as supplementary or primary cooking.
- Free cookware with PMUY connections.
- EESL programmes for bulk procurement of induction units.
5. Improve DISCOM Financial Health
- Tariff rationalisation, cross-subsidy elimination.
- Privatisation of distribution franchises in Tier-2 cities (e.g., Tata Power-DDL, BSES Delhi, Adani Mumbai, Tata Power Odisha).
- Smart metering and prepaid meters.
6. Decentralised Renewable Energy
- Micro-grids and mini-grids in remote tribal hamlets.
- PM-KUSUM scaled up.
- Rooftop solar under PM Surya Ghar.
7. Energy Subsidies as DBT
- LPG subsidy already DBT (PAHAL).
- Electricity subsidy increasingly via DBT (Punjab, Telangana variants); end consumer pays full bill, gets refund.
International Comparisons
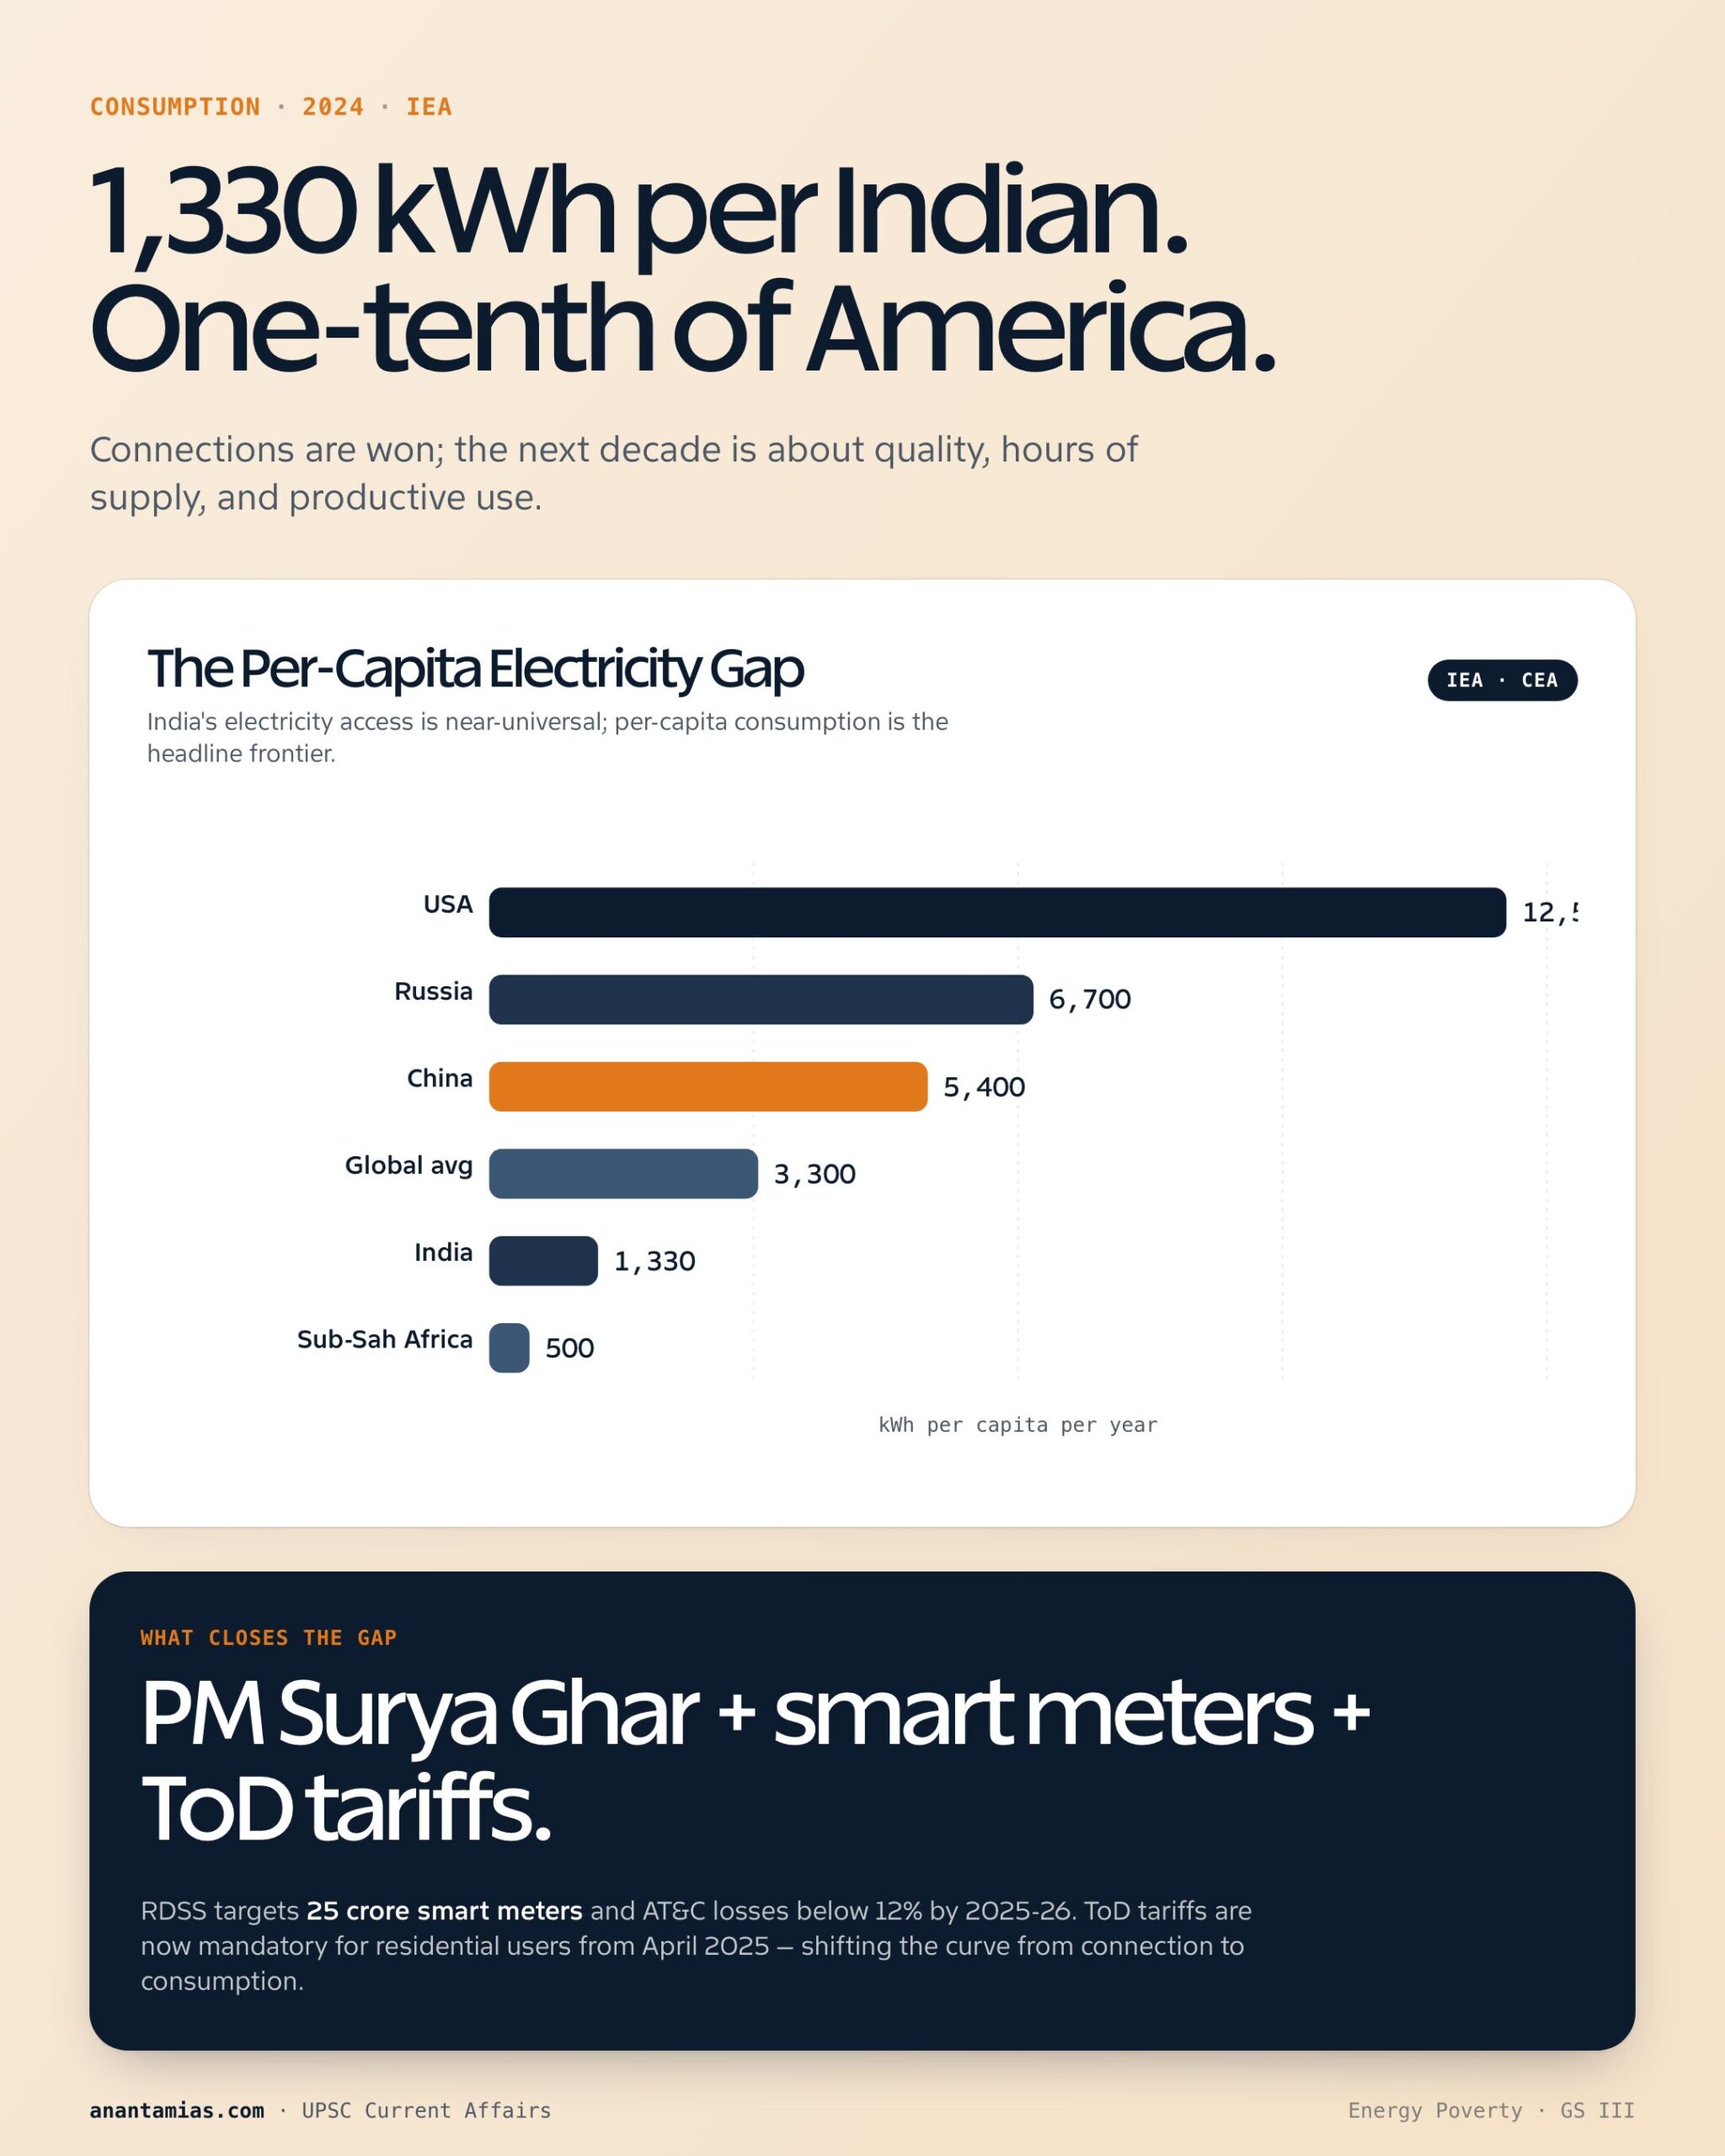
| Country | Electricity Access | Clean Cooking | Per Capita Electricity (kWh) |
|---|---|---|---|
| USA | 100% | 100% | ~12,500 |
| China | 100% | ~80% | ~5,400 |
| India | ~99% | ~60% | ~1,330 |
| Sub-Saharan Africa | ~50% | ~20% | ~500 |
India's electricity access is comparable to China and well above the global average; clean cooking fuel access still has work to do; per-capita consumption is the headline gap.
UPSC Relevance
GS-III Mapping
- Infrastructure: Energy, Ports, Roads, Airports, Railways.
- Inclusive growth and issues arising from it.
- Welfare schemes for vulnerable sections — PMUY, Saubhagya.
- Conservation, environmental pollution and degradation — clean cooking, indoor air pollution.
GS-II Mapping
- Welfare schemes for vulnerable sections of the population by the Centre and States.
Prelims Pointers
- SDG 7 — Affordable, reliable, sustainable, modern energy for all by 2030.
- PMUY — May 2016; Ujjwala 2.0 — August 2021.
- Saubhagya — September 2017.
- PM-KUSUM — 2019; 30.8 GW target.
- PM Surya Ghar Muft Bijli Yojana — February 2024; Rs 75,021 crore outlay; 1 crore households.
- Per-capita electricity (India) — ~1,330 kWh.
- NFHS-5 — 96.8 percent household electrification; 58.6 percent clean cooking fuel.
Mains Hooks
- "Energy poverty is a key driver of multidimensional poverty in India. Discuss the schemes and reforms needed to address it." (GS-III)
- "Evaluate the achievements and shortcomings of Pradhan Mantri Ujjwala Yojana in reducing kitchen-level energy poverty." (GS-II)
- "Examine the role of decentralised renewable energy (PM-KUSUM, PM Surya Ghar) in tackling energy poverty in rural India."
- "Discuss the linkages between energy access and human development with reference to SDG 7."
India is on the home stretch of universal electrification and clean cooking access. The remaining frontier is quality, affordability, and per-capita consumption. Schemes are aligned: Saubhagya for connections, Ujjwala for clean fuel, PM-KUSUM for productive uses, PM Surya Ghar for self-generation, RDSS for distribution reform. For UPSC, master the scheme acronyms, their dates, NFHS-5 statistics, and the 2024-26 outlays to write structured answers on inclusive growth, infrastructure, and environment.
The Health Cost of Energy Poverty
Indoor air pollution from biomass and kerosene cooking is the second-largest environmental health risk in India (after ambient air pollution).
- Household air pollution is implicated in ~6 lakh premature deaths annually in India (State of Global Air 2024).
- Acute respiratory infections (ARI) disproportionately affect women and children.
- Eye disorders, low birth weight, and tuberculosis are also linked to indoor smoke.
- Each Ujjwala connection that sees regular refills is estimated to save the household Rs 5,000-7,000 per year in health costs alone, beyond fuel savings.
The Productive Use Dimension
Energy access is not only about lights at night — it is about productive uses:
- Solar pumps (PM-KUSUM) enable a second crop in rainfed regions.
- Solar dryers, mills, oil expellers raise cottage-industry productivity.
- Cold storage at FPO/SHG scale reduces post-harvest losses.
- Reliable rural electricity enables MSMEs, garment units, food processing.
- DISCOM-supported industrial feeders in tier-3 towns drive non-farm rural employment.
Without productive use, energy access remains welfare-only rather than growth-creating.
Comparing PMUY With State Schemes
| Scheme | State / Centre | Key Features | Coverage |
|---|---|---|---|
| PMUY | Centre | Free LPG connection, Rs 300 refill subsidy | 10.33 crore connections |
| Maharashtra LPG Subsidy | State | Top-up on PMUY refill | Selected districts |
| Tamil Nadu Annamarumalarchi Thittam | State | Free LPG cylinders to certain BPL women | State-wide |
| Uttarakhand Mukhya Mantri Annapurna Yojana | State | Free 3 cylinders to vulnerable households | State-wide |
State schemes complement PMUY where central refill subsidy alone does not move usage from monthly to weekly.
Aspirational Districts and Energy Poverty
The NITI Aayog Aspirational Districts Programme (2018) uses electricity, LPG, and renewable energy access as part of its 49 indicators. Of the 112 aspirational districts, those that have shown the largest improvement in MPI (Bihar, Jharkhand, Odisha) have done so partly through energy access gains.
Sustained focus on bottom-quintile households in aspirational districts for free refills, voucher schemes, and decentralised RE can compress energy poverty faster than uniform schemes.