State Food Safety Index (SFSI): FSSAI’s Annual Ranking of States Explained
A complete UPSC GS-III explainer on the State Food Safety Index. Covers FSSAI's six-parameter methodology, the 6th edition (2023-24) rankings, Kerala's lead, the small-state and union-territory tables, and what the index reveals about food testing capacity in India.
The State Food Safety Index, abbreviated SFSI, is the closest thing India has to a public scoreboard for the safety of what its citizens eat. The Food Safety and Standards Authority of India, FSSAI, releases the index every year on June 7, World Food Safety Day, and ranks every state and union territory on a fixed set of parameters. The index is not a laboratory result. It is an audit of the institutional plumbing that protects food safety, the testing labs, the inspectors, the prosecutions, the awareness drives, the training programmes.
The 6th edition, covering 2023-24, was released in 2024 and once again placed Kerala at the top of the large-state table. The small-state ranking went to Goa, the union-territory ranking to Jammu and Kashmir. The numbers behind those headlines tell a richer story about which states have built credible food-safety regulators and which are still catching up.
For UPSC GS-III, the SFSI sits at the intersection of public health, federalism, and regulatory capacity. It also crosses into biotechnology, agricultural processing, and consumer rights. This guide unpacks what the index measures, how the rankings are produced, what the latest edition shows, and what UPSC examiners typically draw from it.
Quick Facts on the State Food Safety Index
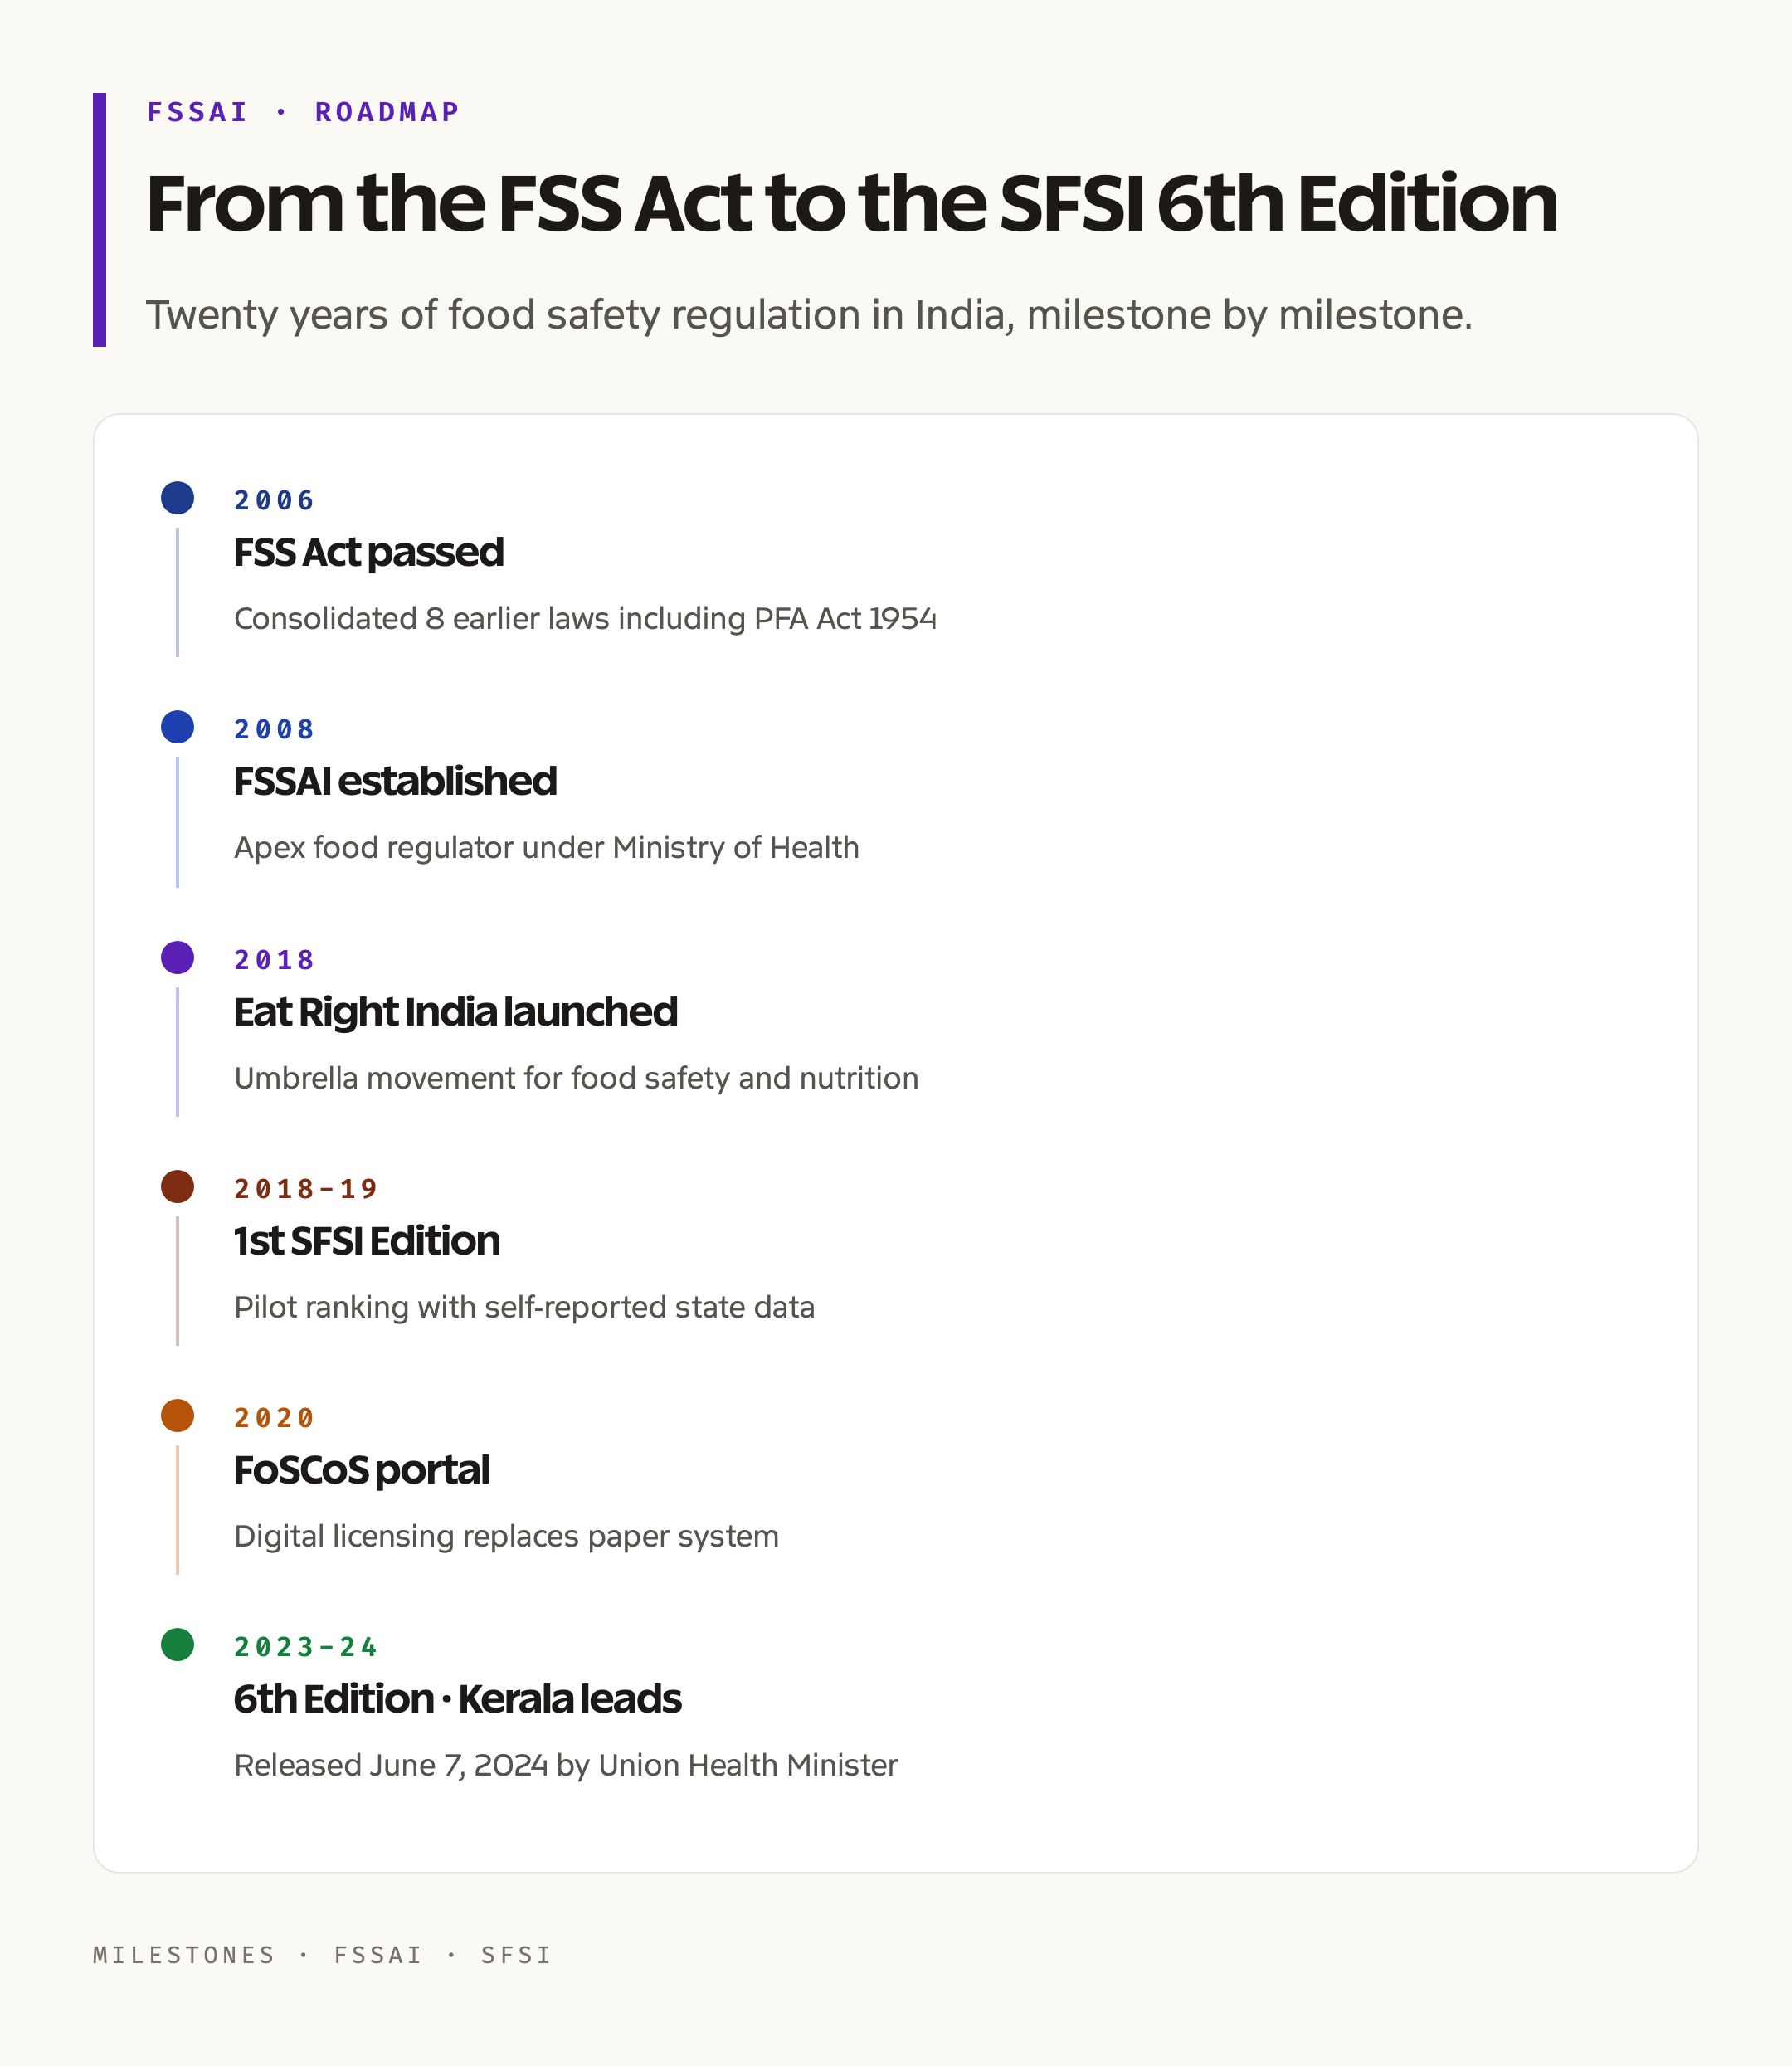
The SFSI is an annual assessment that measures the performance of states and union territories on food-safety parameters. It is released by FSSAI, the apex food regulator established under the Food Safety and Standards Act, 2006. The first edition was launched in 2018-19. The 6th edition, covering the year 2023-24, was released in 2024 by the Union Health Minister.
The index covers all 28 states and 8 union territories, but groups them into three categories so that comparisons are like-for-like. Large states are ranked separately from small states, and union territories form their own table. A state is scored out of 100 on six weighted parameters, and the final ranking is based on the composite score.
Kerala has held the top spot in the large-state category in the 5th and 6th editions. It is also the only state in the most recent edition to have hit 100 percent of its food-inspection target. Tamil Nadu and Gujarat round out the top three among large states. Goa leads small states, and Jammu and Kashmir leads the union territories.
What the SFSI Actually Measures
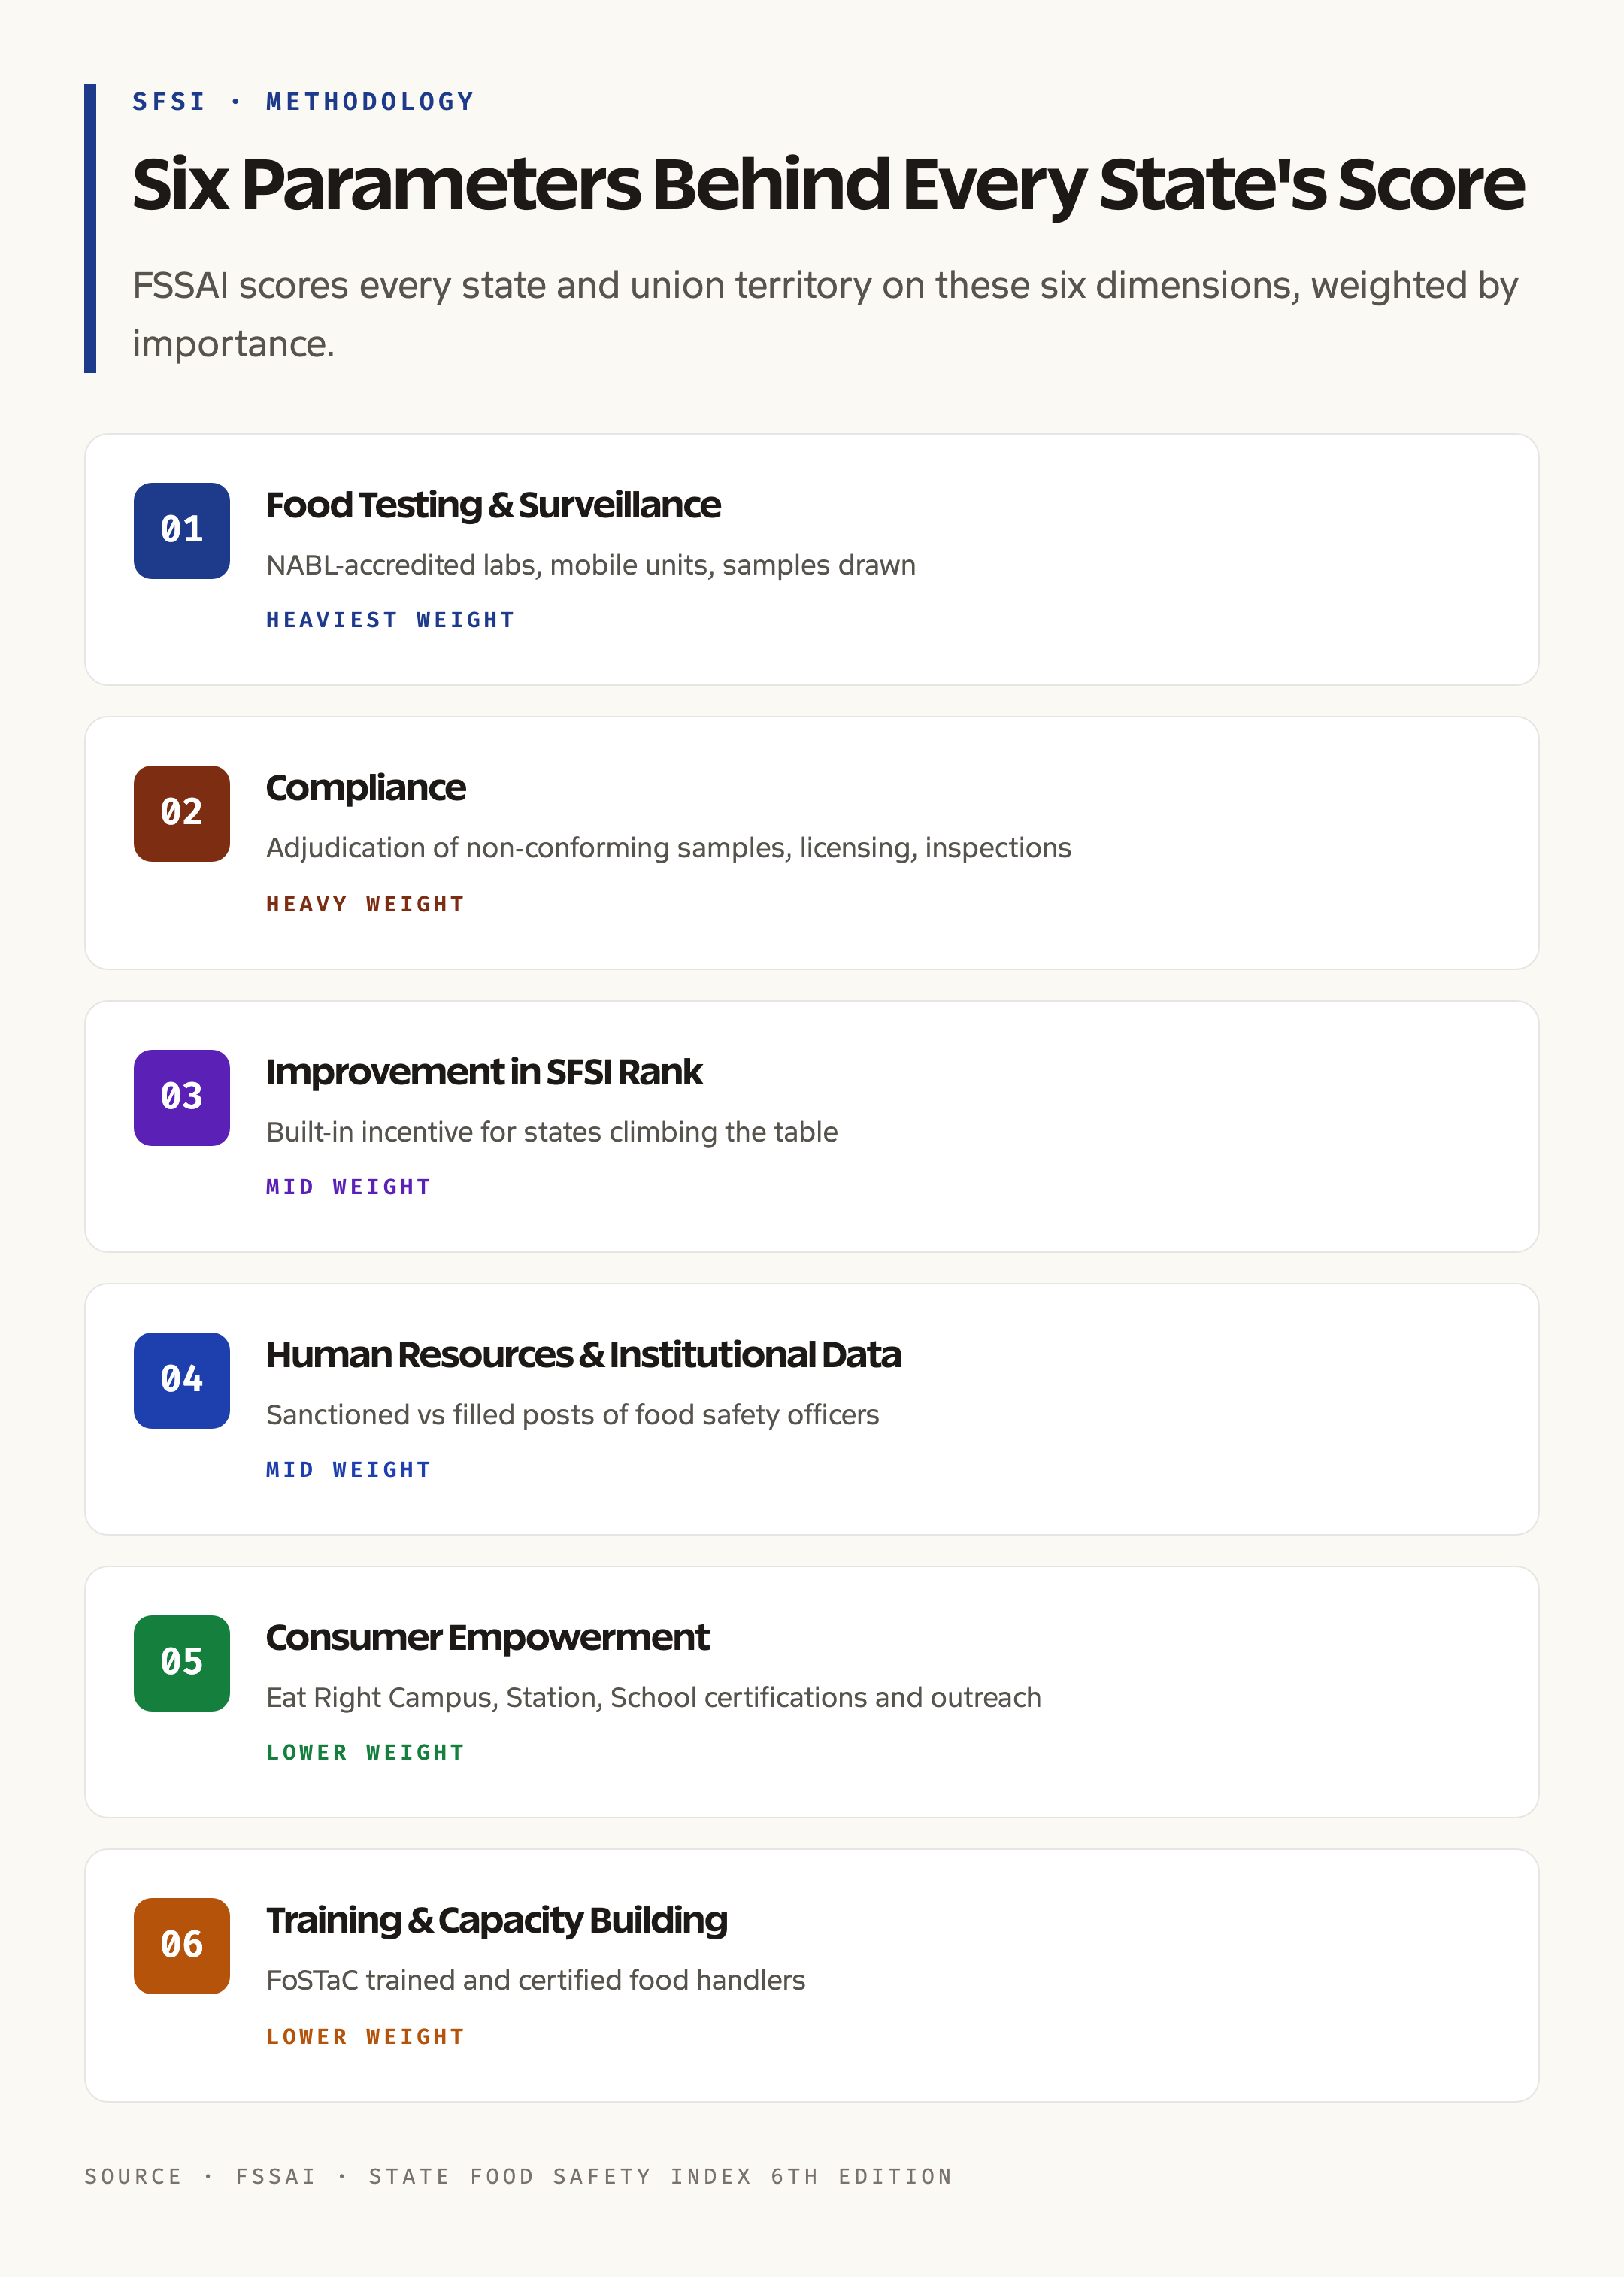
The SFSI scores each state on six parameters, each weighted to reflect what FSSAI considers most important for ground-level food safety. Treating the parameters as a checklist is the easiest way to remember them.
The first parameter is food testing infrastructure and surveillance. This carries the heaviest weight. It looks at how many state food-testing labs are notified, how many are NABL accredited, how many mobile labs the state runs, and how many surveillance samples the state collects in the year. A state without a working lab cannot prove food is safe, no matter how confident the state machinery sounds.
The second parameter is compliance, which measures how the state acts on the samples it draws. Are non-conforming samples followed by adjudication? Are licences and registrations issued in time? Are food businesses inspected at the right frequency? This parameter rewards states that complete the loop from sampling to enforcement.
The third parameter is improvement in SFSI rank, a built-in incentive for states that were near the bottom. A state that climbs three places earns more points than one that holds at the top. This is FSSAI’s way of pushing weaker states to invest in capacity.
The fourth parameter is human resources and institutional data, which counts food-safety officers, designated officers, and the proportion of sanctioned posts that are actually filled. Vacant posts in food-safety departments are a chronic problem, and this parameter is how the index calls them out.
The fifth parameter is consumer empowerment, which scores the state on awareness drives, the number of training programmes for street-food vendors, and how visibly food-safety information reaches the public. Eat Right Campus, Eat Right Station, and Eat Right School certifications all feed into this score.
The sixth parameter is training and capacity building under the Food Safety Training and Certification programme, FoSTaC. This counts how many food handlers in the state have been formally trained and certified.
How FSSAI Builds the Ranking
Every state submits data to FSSAI through a structured online portal at the end of the financial year. FSSAI verifies the inputs against its own central databases, the FoSCoS licensing platform, the InFoLNet lab management system, and the FoSTaC training records. Self-reported numbers that are not corroborated centrally are not counted.
The verified data feeds a weighted formula. Food testing and compliance carry the largest weights, typically 25 to 30 percent each, while consumer empowerment and training carry around 10 to 15 percent. The composite score is normalised to 100 and the states are ranked within their size category.
FSSAI publishes the methodology document and the underlying scoresheet for each state on its website. This transparency is unusual for an Indian central regulator and is one reason the index has gained traction with state health departments, which now treat their SFSI rank as a political performance metric.
Rankings in the 6th Edition (2023-24)
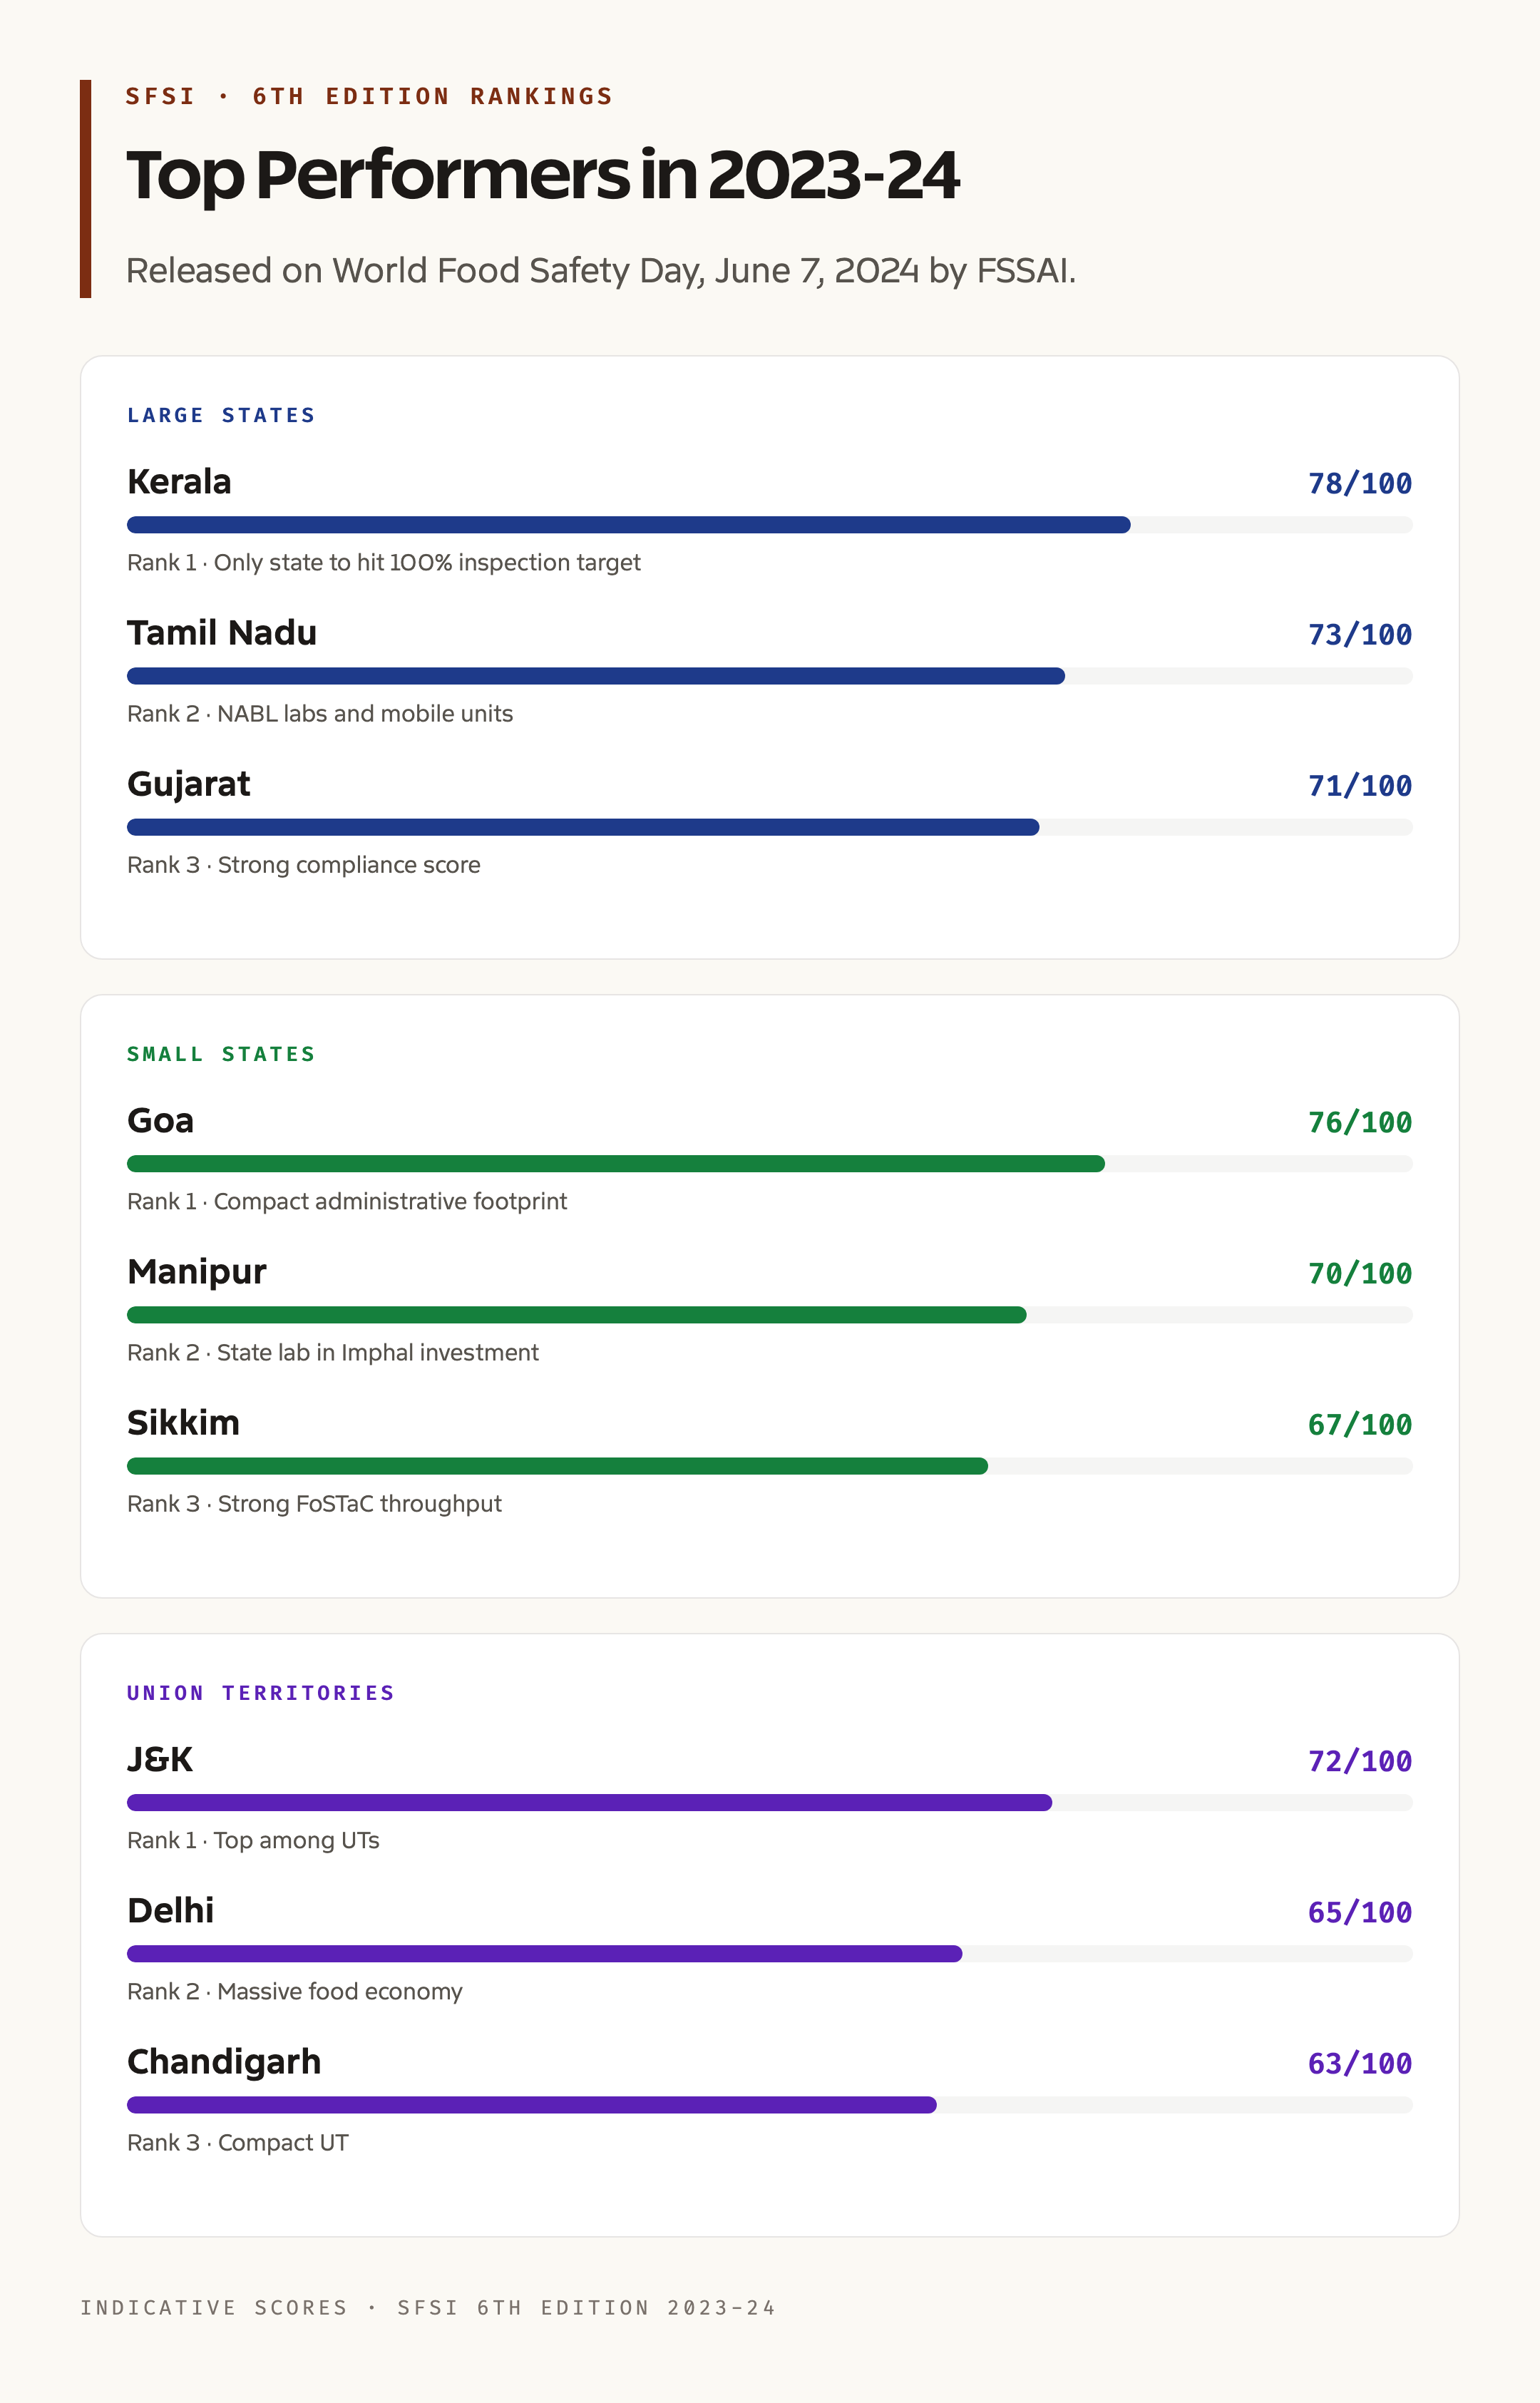
The 6th edition was released by Union Health Minister J P Nadda on World Food Safety Day, June 7, 2024. The headline rankings, in the format the report uses, are below.
| Category | Rank 1 | Rank 2 | Rank 3 |
|---|---|---|---|
| Large States | Kerala | Tamil Nadu | Gujarat |
| Small States | Goa | Manipur | Sikkim |
| Union Territories | Jammu and Kashmir | Delhi | Chandigarh |
Kerala’s lead is the most striking part of the table. The state is the only one in this edition that achieved 100 percent of its inspection targets, and it scores almost equally well on testing infrastructure, compliance, and consumer empowerment. Its strength is the breadth of its food-safety machinery rather than a single standout parameter.
Tamil Nadu and Gujarat trail Kerala by a small margin and have been in the top three for three editions running. Both states have invested heavily in NABL accredited state labs and mobile testing units. Their compliance scores are also among the highest, helped by digitised licensing and faster adjudication.
Among small states, Goa’s lead reflects its compact administrative footprint, where a single food-safety commissionerate covers the whole territory. Manipur’s second place is the surprise of the edition and is the result of sustained investment in its state lab in Imphal and a sharp jump in food-handler training under FoSTaC.
The union-territory table is led by Jammu and Kashmir, with Delhi and Chandigarh following. Delhi’s middle ranking despite its enormous food economy is a recurring concern. The capital has more registered food businesses than most large states, but its inspector-to-business ratio remains one of the worst in the country.
What the Index Does Not Capture
The SFSI is not a measure of how safe food on a citizen’s plate actually is. It is a measure of how well a state is set up to keep food safe. A state can have a high SFSI rank and still see a major food-safety incident, just as a poorly ranked state can have low real-world incidence simply because its monitoring is weak.
The index also does not measure unorganised food sectors directly. Street-food vendors, weekly haats, and small caterers feed a huge share of the Indian population, but FSSAI’s testing infrastructure focuses on registered businesses. A few states, Kerala and Tamil Nadu among them, run targeted programmes for street-food and panchayat-level kitchens, but the SFSI gives them only modest credit.
Comparing across years is also tricky. FSSAI revises its methodology between editions, adding parameters or changing weights. A year-on-year drop in rank does not always mean a state has slipped. It can also mean a parameter the state was weak on now counts for more.
SFSI and FSSAI’s Larger Mandate
FSSAI was set up under the Food Safety and Standards Act, 2006, which consolidated eight earlier laws including the Prevention of Food Adulteration Act, 1954. The authority sets standards for food articles, regulates manufacturing, storage, distribution, sale, and import, and runs national surveillance programmes for food contaminants.
The SFSI is one instrument in a wider toolkit. The Eat Right India movement is the umbrella programme. Under it sit the Eat Right Campus, Eat Right Station, Eat Right School, and Bhog certifications for places of worship. The annual State Food Safety Index pushes states to align their administrative machinery with the targets these certifications imply.
The index also feeds into India’s food-export ambitions. States with strong food-safety machinery find it easier to clear export consignments through Codex-aligned standards, which matters for high-value exports such as basmati rice, marine products, and processed foods.
Issues, Limitations, and Reform Proposals
The most common critique is that the index over-weights infrastructure and under-weights actual outcomes. A state that runs many tests but never prosecutes anyone scores high on testing but low on deterrence, and the index does not always punish that gap. FSSAI has begun publishing prosecution data alongside the index from the 5th edition, which is a partial fix.
A second issue is that small states are sometimes flattered by the index because the denominators are small. A union territory with two food labs and 300 inspections can score above a large state with 50 labs and 200,000 inspections, even though the large state is doing far more substantive work in absolute terms. FSSAI groups states by size for this reason, but the categorisation is not perfect.
A third issue is data quality. State food-safety departments are chronically understaffed, and the staff who file SFSI returns are sometimes the same people who carry out inspections. This creates an obvious incentive to under-report problems. The shift to platform-based data, where licences flow through FoSCoS and lab results through InFoLNet, has reduced this risk but not eliminated it.
Reform proposals include adding a separate sub-index for street-food and panchayat-level food safety, publishing district-level scores within each state, and integrating the SFSI with the National Health Mission’s nutrition surveys so that food-safety capacity can be triangulated against actual disease burden.
Why the SFSI Matters for UPSC GS-III
GS-III asks candidates to evaluate institutions and the policies they implement. The SFSI is a near-perfect example. It measures not the policy goal, safe food, but the institutional readiness to deliver that goal. Mains questions on food security, public health, or regulatory federalism can pull SFSI data as evidence.
The index also connects to questions on cooperative and competitive federalism. The fact that states publicly compete on their SFSI rank is a working example of competitive federalism, where the centre publishes a transparent yardstick and states race to climb it. This mirrors the older Aspirational Districts Programme and the more recent niti-aayog dashboards.
Prelims questions on the SFSI usually focus on three things, who releases it, the six parameters, and the latest top three in the large-state category. Mains questions tend to ask candidates to evaluate the index as a regulatory tool or to suggest reforms. Linking the SFSI to FSSAI’s wider mandate under the FSS Act, 2006 is the safest way to anchor an answer.
Frequently Asked Questions
Who releases the State Food Safety Index?
The State Food Safety Index is released by the Food Safety and Standards Authority of India, FSSAI, the apex food regulator established under the Food Safety and Standards Act, 2006. The index is announced every year on June 7, World Food Safety Day.
What are the six parameters of the SFSI?
The six parameters are food testing infrastructure and surveillance, compliance, improvement in SFSI rank, human resources and institutional data, consumer empowerment, and training and capacity building under the FoSTaC programme. Each parameter is weighted, with food testing and compliance carrying the heaviest weights.
Which state topped the SFSI 6th edition?
Kerala topped the large-state category in the 6th edition, 2023-24, followed by Tamil Nadu and Gujarat. Kerala is the only state in this edition to have achieved 100 percent of its inspection targets. Goa led the small-state category and Jammu and Kashmir led the union-territory category.
Is the SFSI a measure of how safe food actually is?
No. The SFSI measures how well a state is institutionally set up to keep food safe, not the actual safety of food on a consumer’s plate. It is an audit of testing labs, inspectors, training programmes, and consumer-awareness drives, not a direct measure of food contamination or food-borne illness.
How is the SFSI different from the Eat Right India campaign?
Eat Right India is FSSAI’s umbrella citizen-facing campaign, which includes certifications such as Eat Right Campus, Eat Right Station, and Bhog. The SFSI is the regulator-facing audit that scores state governments on their food-safety machinery. Strong performance on Eat Right certifications feeds into a state’s SFSI score.
Why is Kerala consistently at the top of the SFSI?
Kerala combines a well-funded state food-safety commissionerate, NABL accredited labs in every major district, a high inspector-to-business ratio, and active consumer-awareness campaigns. Its breadth across all six SFSI parameters, rather than any single standout score, is what keeps it at the top.