India Unemployment Rate 2026: Latest PLFS Data and Trends
India's May 2026 PLFS unemployment rate was 5.5% under CWS. Compare it with PLFS 2025 annual data, rural-urban rates, LFPR, WPR, and youth unemployment.
The latest India unemployment rate 2026 available from the monthly Periodic Labour Force Survey was 5.5% in May 2026 for people aged 15 and above under the current weekly status measure. The rural rate was 5.1%, while the urban rate was 6.4%.
That monthly figure should not be mixed with the PLFS 2025 annual usual-status rate of 3.1%. The annual series uses a 365-day reference period; the monthly bulletin uses the previous seven days. Both are official, but they answer different questions about India’s labour market.
Read the official May 2026 monthly bulletin and the official PLFS 2025 annual report before quoting a rate.
This explainer breaks down the PLFS methodology, the four key indicators every aspirant must know, the gender and state-wise patterns in India unemployment data 2026, the employment elasticity debate, and the policy responses on the table. We’ll also flag the prelims pointers and the high-probability mains angles UPSC examiners have been favouring.
Latest India Unemployment Data for 2026
| PLFS measure | Reference period | All India | Rural | Urban |
|---|---|---|---|---|
| May 2026 monthly UR, CWS, age 15+ | Previous 7 days | 5.5% | 5.1% | 6.4% |
| PLFS 2025 annual UR, usual status, age 15+ | Previous 365 days | 3.1% | 2.4% | 4.8% |
| PLFS 2025 annual UR, CWS, age 15+ | Previous 7 days | 5.3% | 4.6% | 6.8% |
- Annual LFPR, usual status, age 15+: 59.3% in PLFS 2025.
- Annual WPR, usual status, age 15+: 57.4% in PLFS 2025.
- Youth unemployment, usual status, age 15-29: 9.9% in PLFS 2025.
What India Unemployment Data 2026 Reveals
India unemployment data 2026 refers to the labour market statistics published in the PLFS annual report for the reference year January to December 2025. PLFS is a sample-based survey that interviews roughly 1 lakh households each year, urban households four times a year through a rotational panel, and rural households once. It replaced the older quinquennial Employment-Unemployment Survey of the NSSO in 2017-18.
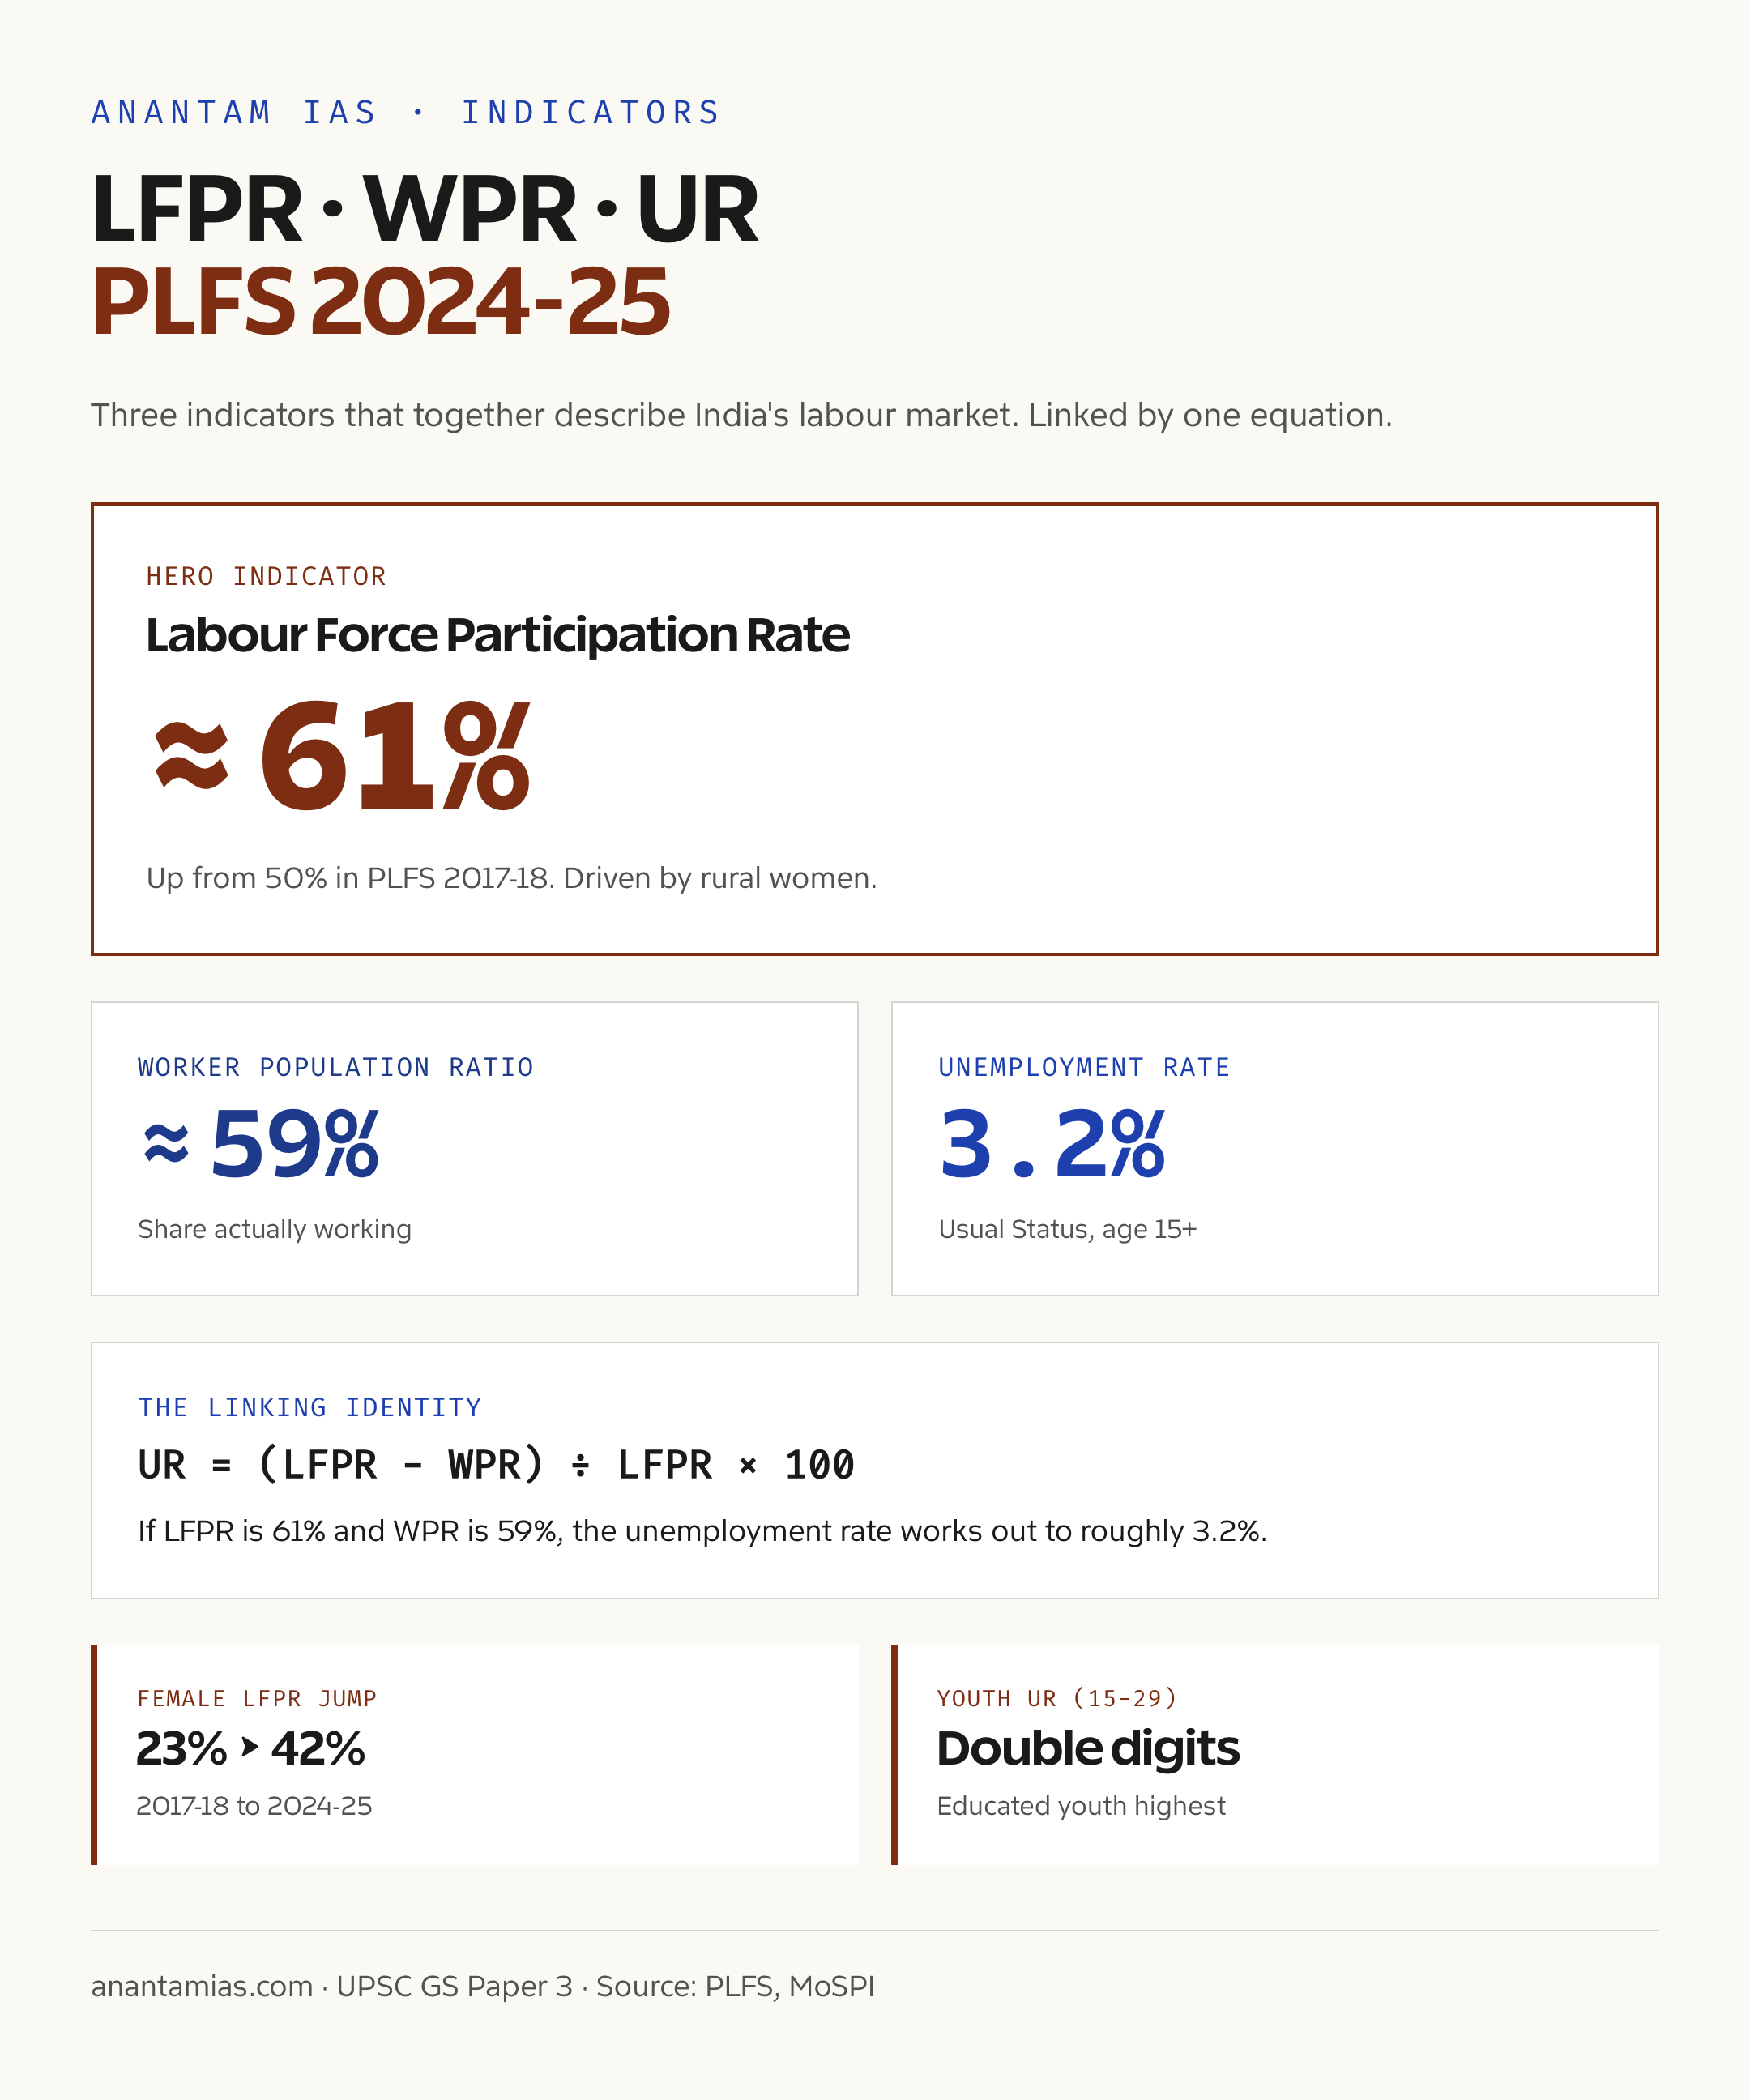
The survey reports four core indicators. Labour Force Participation Rate (LFPR) is the percentage of population that is either working or seeking work. Worker Population Ratio (WPR) is the percentage actually working. Unemployment Rate (UR) is the percentage of the labour force that is not working but seeking and available for work. Activity status is reported in two reference frames — Usual Status with a reference period of the last 365 days, and Current Weekly Status with a reference period of the last 7 days.
The Usual Status captures structural employment, while CWS captures short-run frictions and seasonal unemployment. India unemployment data 2026 shows a clear gap between the two, which is normal but the gap itself is informative.
Background and Historical Context
India did not have a continuous official labour force survey until PLFS launched in 2017-18. Before that, the NSSO conducted quinquennial Employment-Unemployment Surveys, the last of which was in 2011-12. The five-year gap meant policy responses to labour market shifts were reactive at best.
The PLFS was launched on the recommendation of the Amitabh Kundu Committee and the report of the Standing Committee on Labour. The survey aims to provide annual estimates of labour force indicators for rural areas and quarterly estimates for urban areas. The first annual report covered 2017-18 and was released in May 2019.
The PLFS 2017-18 report drew sharp criticism because it pegged the Usual Status unemployment rate at 6.1%, the highest in 45 years. The government initially questioned the report but later released it after the 2019 general elections. The trend since then has been a decline in the unemployment rate alongside a sharp rise in LFPR, especially among rural women.
The covid shock in 2020 distorted the FY21 numbers. Urban unemployment briefly crossed 20% in the Apr-Jun 2020 quarter, while rural employment held up because of MGNREGA absorption and reverse migration. The recovery is visible in PLFS 2021-22, 2022-23, 2023-24, and now in India unemployment data 2026.
A parallel discussion happens around CMIE’s monthly unemployment data, which often shows higher numbers because of methodological differences in how it treats discouraged workers and frequency of survey rounds. UPSC tests PLFS, not CMIE, but a mains answer can mention the gap.
Key Indicators in PLFS 2025
- Labour Force Participation Rate (LFPR): the share of the population working or seeking and available for work. It was 59.3% for people aged 15+ under usual status in 2025.
- Worker Population Ratio (WPR): the share of the population that was employed. It was 57.4% for people aged 15+ under usual status.
- Unemployment Rate (UR): the unemployed as a share of the labour force, not of the total population. It was 3.1% under annual usual status and 5.3% under annual CWS.
- Youth unemployment: the usual-status rate for ages 15-29 was 9.9%. Urban female youth unemployment was 18.9%.
- Reference-period warning: compare like with like. A monthly CWS estimate should not be presented as an annual usual-status estimate.
Why India Unemployment Data 2026 Matters
The PLFS findings drive five major policy conversations.
First, growth-employment elasticity. India’s employment elasticity — the percentage change in employment for a 1% change in GDP — has been close to 0.4 in recent years, much lower than the 0.7 seen in East Asian fast-growth episodes. Jobless growth is the recurrent worry, and India unemployment data 2026 will be parsed for whether the relationship has improved.
Second, female labour force participation. The sharp rise in rural female LFPR is welcomed but contested. Some economists argue it reflects distress-driven entry into unpaid family work rather than empowerment. The composition of female employment — own-account, helper, paid, salaried — is therefore as important as the headline LFPR.
Third, the youth bulge. With over 65% of the population below 35, India’s demographic dividend depends on absorbing 1 crore plus new entrants to the labour force every year. India unemployment data 2026 directly speaks to this absorption rate.
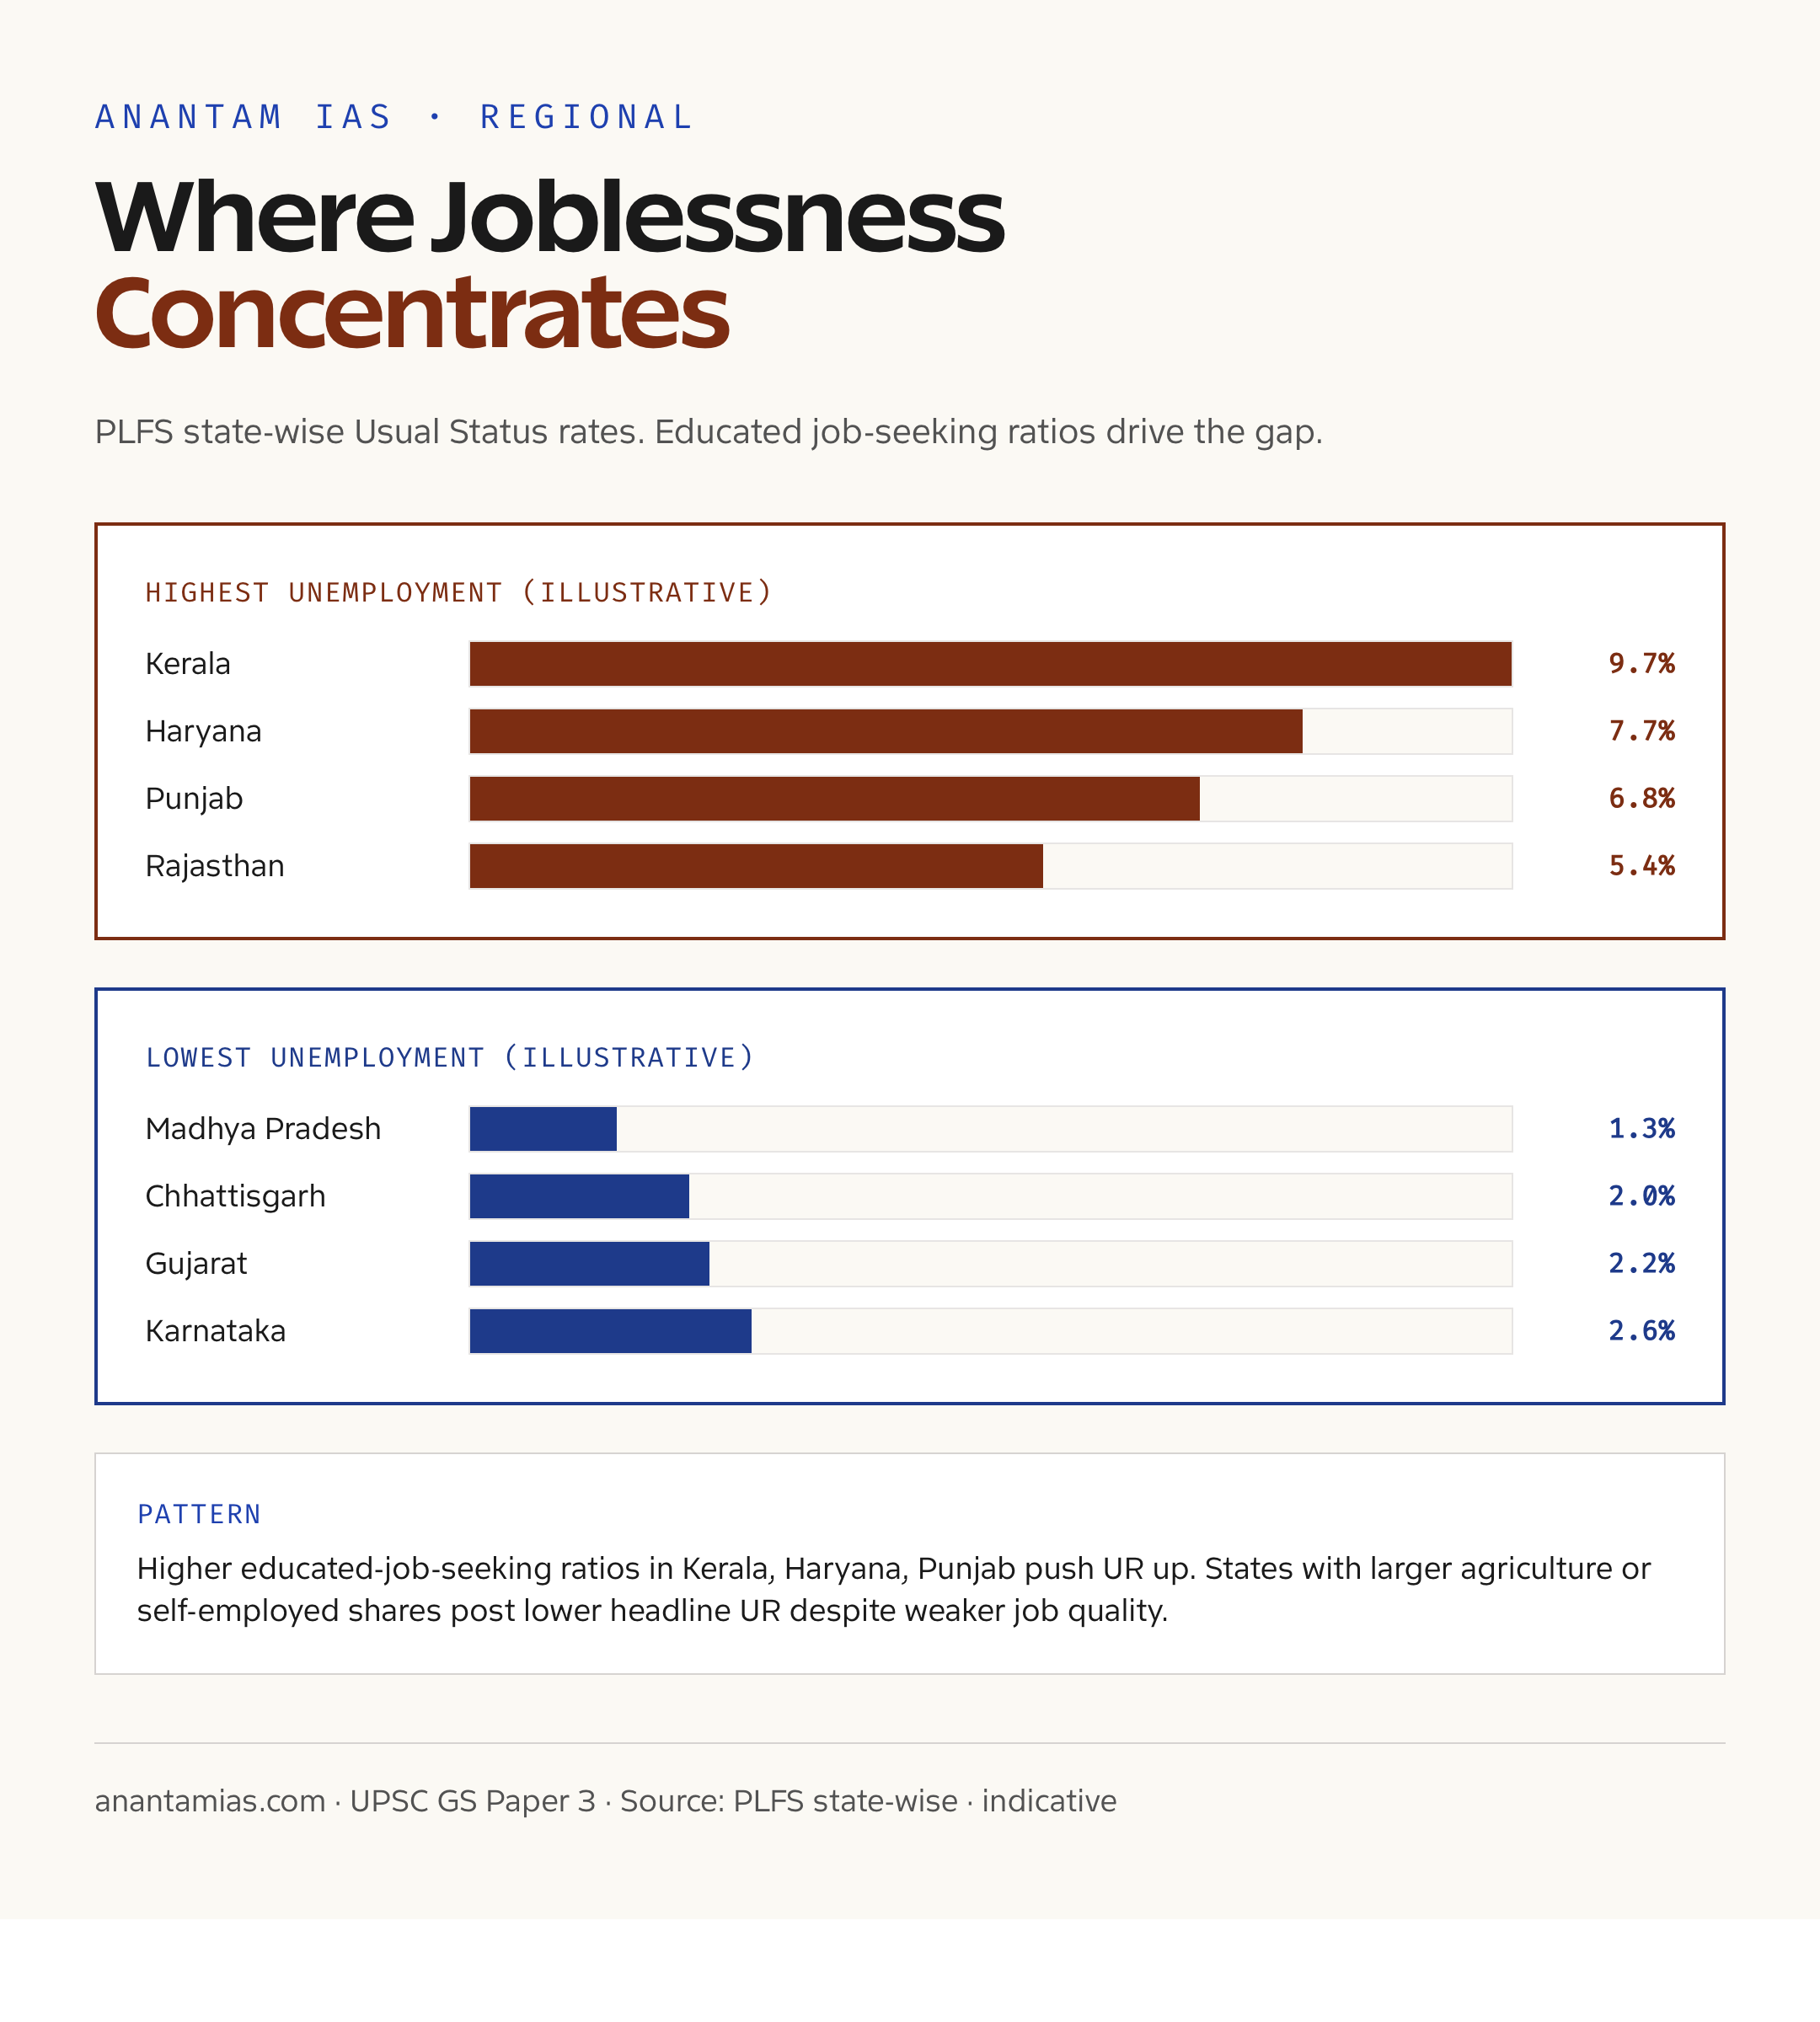
Fourth, regional divergence. State-wise unemployment rates range from below 2% in states like Madhya Pradesh, Chhattisgarh, and Gujarat to above 9% in states like Kerala, Haryana, and Punjab. The pattern correlates with educated job-seeking ratios more than with overall development.
Fifth, scheme design. PLFS data feeds into MGNREGA wage revisions, the MSP for kharif crops 2026-27, the National Career Service portal, and the PM Employment Generation Programme allocations.
Detailed Analysis of Gender and Age Patterns
The most striking shift in India unemployment data 2026 is the female LFPR jump. From 23.3% in PLFS 2017-18 to approximately 42% in PLFS 2025, the rate has nearly doubled in seven years. This is one of the largest recorded shifts in any major economy over such a short window.
The composition of this gain matters. Most of the increase is in rural areas and in own-account work or unpaid family helper categories. Salaried female employment has grown more slowly. Urban female LFPR is still below 30%, well short of the East Asian benchmark. The PLFS 2025 report shows the urban-rural gap for women narrowing, but the quality of work gap remains wide.
Age-wise, the unemployment problem is concentrated in the 15 to 29 bracket. Educated youth — those with secondary or higher education — show unemployment rates 3 to 4 times the all-age average. The PLFS reports a clear graded pattern: postgraduates face higher unemployment than graduates, who face higher than those with secondary education, who face higher than the illiterate. This counterintuitive pattern reflects high reservation wages, queuing for government jobs, and the slow growth of formal-sector private employment.
Caste-wise patterns, available in PLFS unit-level data, show SC/ST workers concentrated in casual labour, OBC workers split between self-employment and casual work, and General category workers over-represented in regular wage employment. India unemployment data 2026 maintains these gradients.
Usual Status vs CWS: Which Rate Should You Use?
| Measure | Reference period | Best use |
|---|---|---|
| Usual status (ps+ss) | Previous 365 days | Structural annual employment and unemployment |
| Current weekly status (CWS) | Previous 7 days | Short-run and seasonal labour-market movement |
| CMIE CPHS | Private high-frequency survey | Supplementary comparison; methodology differs from PLFS |
For UPSC, identify the source, reference period, age group and status measure every time you quote an unemployment rate. “India’s unemployment rate” without those four qualifiers is incomplete.
Challenges in Measuring India Unemployment Data 2026
PLFS is rigorous but has well-known limitations.
- Self-employment overcounting. A respondent doing 30 days of unpaid family work over a year counts as employed under Usual Status. This understates true labour underutilisation.
- Informal sector blind spots. Around 85% of India’s workforce is informal. PLFS captures their activity but cannot fully verify employment quality, hours, or earnings.
- Urban quarterly data lag. While PLFS now publishes urban quarterly bulletins, the rural data is annual only.
- Activity status churn. Workers move between principal and subsidiary statuses frequently, and the annual snapshot can miss this churn.
- Wage data caveats. PLFS reports wages and earnings, but the sampling is not optimised for wage estimation, so the wage estimates have wider confidence intervals than the rate estimates.
- Definition of “unemployed”. A person must be both seeking and available for work to be counted as unemployed. Discouraged workers who stopped seeking are classified as “out of labour force”, which understates the headline rate.
- Disaggregation gap. State-wise estimates for smaller states have wider error margins because of sample-size constraints.
The Ministry of Statistics is overhauling PLFS to provide monthly all-India estimates and quarterly state-level estimates from 2025-26 onwards, which should improve timeliness.
Prelims Pointers
- PLFS is conducted by the National Statistical Office, under MoSPI.
- The survey started in 2017-18 on the recommendation of the Amitabh Kundu Committee.
- PLFS uses a rotational panel design for urban areas (4 visits per household) and a single visit for rural.
- Usual Status reference period is 365 days; CWS is 7 days.
- LFPR + Unemployment Rate logic: UR = (LFPR − WPR) ÷ LFPR × 100.
- The first PLFS report covered 2017-18, released in May 2019.
- The International Labour Organization is the global counterpart; ILO definitions broadly align with PLFS.
- Code on Wages, 2019 and Code on Social Security, 2020 are part of the four labour codes that affect employment statistics.
Mains Questions
- Critically examine the rise in female Labour Force Participation Rate in India between PLFS 2017-18 and PLFS 2025. Does the trend reflect empowerment or distress? GS Paper 1 and 3.
- Discuss the concept of employment elasticity in India. Why has growth in recent years been called “jobless”? Suggest policy measures to improve elasticity. GS Paper 3.
- The Periodic Labour Force Survey provides the most authoritative measure of India unemployment data 2026, but its limitations are widely discussed. Examine the methodology and its critiques. GS Paper 3.
- Educated youth in India face higher unemployment rates than less-educated workers. Explain this paradox and propose interventions. GS Paper 2.
Way Forward
India unemployment data 2026 paints a mixed picture. The headline UR is at multi-year lows, female LFPR is rising sharply, and rural employment is robust. At the same time, youth unemployment remains stubbornly high, employment elasticity is weak, and a large share of the workforce is in informal or low-quality jobs. The next phase of reform needs to focus on quality rather than just quantity.
Three policy levers stand out. Skilling at scale through PMKVY 4.0 and the apprenticeship reform must align curricula with industry demand. Manufacturing employment, only 12% of the workforce, must rise toward 18-20% through PLI schemes, the coal gasification scheme, and improvements in ease of doing business. Female labour force participation can be unlocked by safe public transport, childcare infrastructure, and flexible work arrangements.
For aspirants, India unemployment data 2026 is a recurring exam theme. Track the PLFS annual report each July, watch for the quarterly urban bulletin, and read the Periodic Labour Force Survey alongside the Economic Survey’s employment chapter. Together they give you the full picture an answer copy needs.
Frequently Asked Questions
What is the Periodic Labour Force Survey?
The Periodic Labour Force Survey is an annual sample-based survey of employment conducted by the National Statistical Office under MoSPI. It launched in 2017-18 and replaced the quinquennial Employment-Unemployment Survey of the NSSO. PLFS samples around 1 lakh households each year.
What is India’s unemployment rate in 2025?
The PLFS 2025 usual-status unemployment rate for persons aged 15 and above was 3.1%, with rural at 2.4% and urban at 4.8%. The May 2026 monthly CWS rate was 5.5%.
What is the difference between Usual Status and CWS?
Usual Status uses a 365-day reference period and counts anyone with at least 30 days of productive activity as employed. Current Weekly Status uses a 7-day reference period and counts a person as employed only if they worked at least one hour during that week. CWS captures short-run frictions while Usual Status captures structural employment.
What is LFPR in PLFS?
Labour Force Participation Rate is the percentage of population aged 15 and above that is either working or seeking work. India’s LFPR has risen from around 50% in PLFS 2017-18 to approximately 61% in PLFS 2025, with the rise driven mainly by rural female participation.
Why is female LFPR rising in India unemployment data 2026?
Female LFPR has nearly doubled from 23.3% in 2017-18 to around 42% in 2025. Most of the gain is in rural areas through own-account work and unpaid family helper roles. Whether this reflects empowerment or distress is debated, with composition signals favouring the distress interpretation in some regions.
What is employment elasticity?
Employment elasticity is the percentage change in employment for a 1% change in GDP. India’s elasticity has been close to 0.4 in recent years, much lower than the 0.7 seen in fast-growth East Asian episodes. Low elasticity is at the core of the u0022jobless growthu0022 debate.
Why is youth unemployment high in India?
Youth unemployment in the 15 to 29 age group remains in double digits despite the low overall rate. Educated youth show the highest unemployment because of high reservation wages, queuing for government jobs, the slow growth of formal private-sector employment, and skill-job mismatch in higher education.
How does PLFS differ from CMIE data?
PLFS is the official survey conducted by the NSO with a stratified sample design. CMIE’s Consumer Pyramids Household Survey is a private monthly survey with a different sampling frame and treatment of discouraged workers. CMIE produces systematically higher unemployment rates, but PLFS remains the official benchmark for UPSC.
What is the worker population ratio?
Worker Population Ratio is the percentage of total population aged 15 and above that is actually employed. PLFS 2025 puts WPR near 59%, with rural WPR markedly higher than urban. Female rural WPR has crossed 39%.
How does India unemployment data 2026 inform policy?
PLFS data feeds into MGNREGA wage revisions, MSP design, the National Career Service portal, PM Employment Generation Programme allocations, and macro-policy decisions by the RBI. It is the official labour market indicator for budget speeches, the Economic Survey, and Finance Commission deliberations.