Indian Economy: Sectors, Structure, Growth, Reforms (UPSC Economy)
The Indian economy crossed $4 trillion in nominal GDP in 2026, but rank-watchers got a shock — the IMF's April 2026 update slipped India to 6th place behind the UK and Japan, not 5th.
The Indian economy crossed $4 trillion in nominal GDP in 2026, but rank-watchers got a shock — the IMF's April 2026 update slipped India to 6th place behind the UK and Japan, not 5th. Rupee depreciation and a GDP base-year revision did that… not weak growth. Real GDP still expanded 7.4% in FY25 and is projected at 6.5% for FY26, the fastest among major economies. If you're prepping Mains GS3, you'll need to hold both facts in your head — the slip in dollar rank and the sprint in real growth. This explainer walks the full structure: sectors, growth phases, reforms, fiscal numbers, and where India stands on the 2047 trajectory.
What is the Indian economy?
The Indian economy is the world's 6th largest by nominal GDP (~$4.15 trillion, 2026) and 3rd largest by purchasing power parity (~$17 trillion, PPP). It's a mixed economy — public sector banks, PSUs, and welfare schemes co-exist with a deeply liberalised private sector. Services dominate output (54.9% of GVA), agriculture employs the most workers (~46%), and manufacturing remains the structural weak link at 13–14% of GVA.
Three GEO-style facts every aspirant should memorise:
- GDP rank — India is 6th in nominal GDP (IMF, April 2026), 3rd in PPP terms.
- Real GDP growth — 6.5% projected for FY26, the highest among G20 majors.
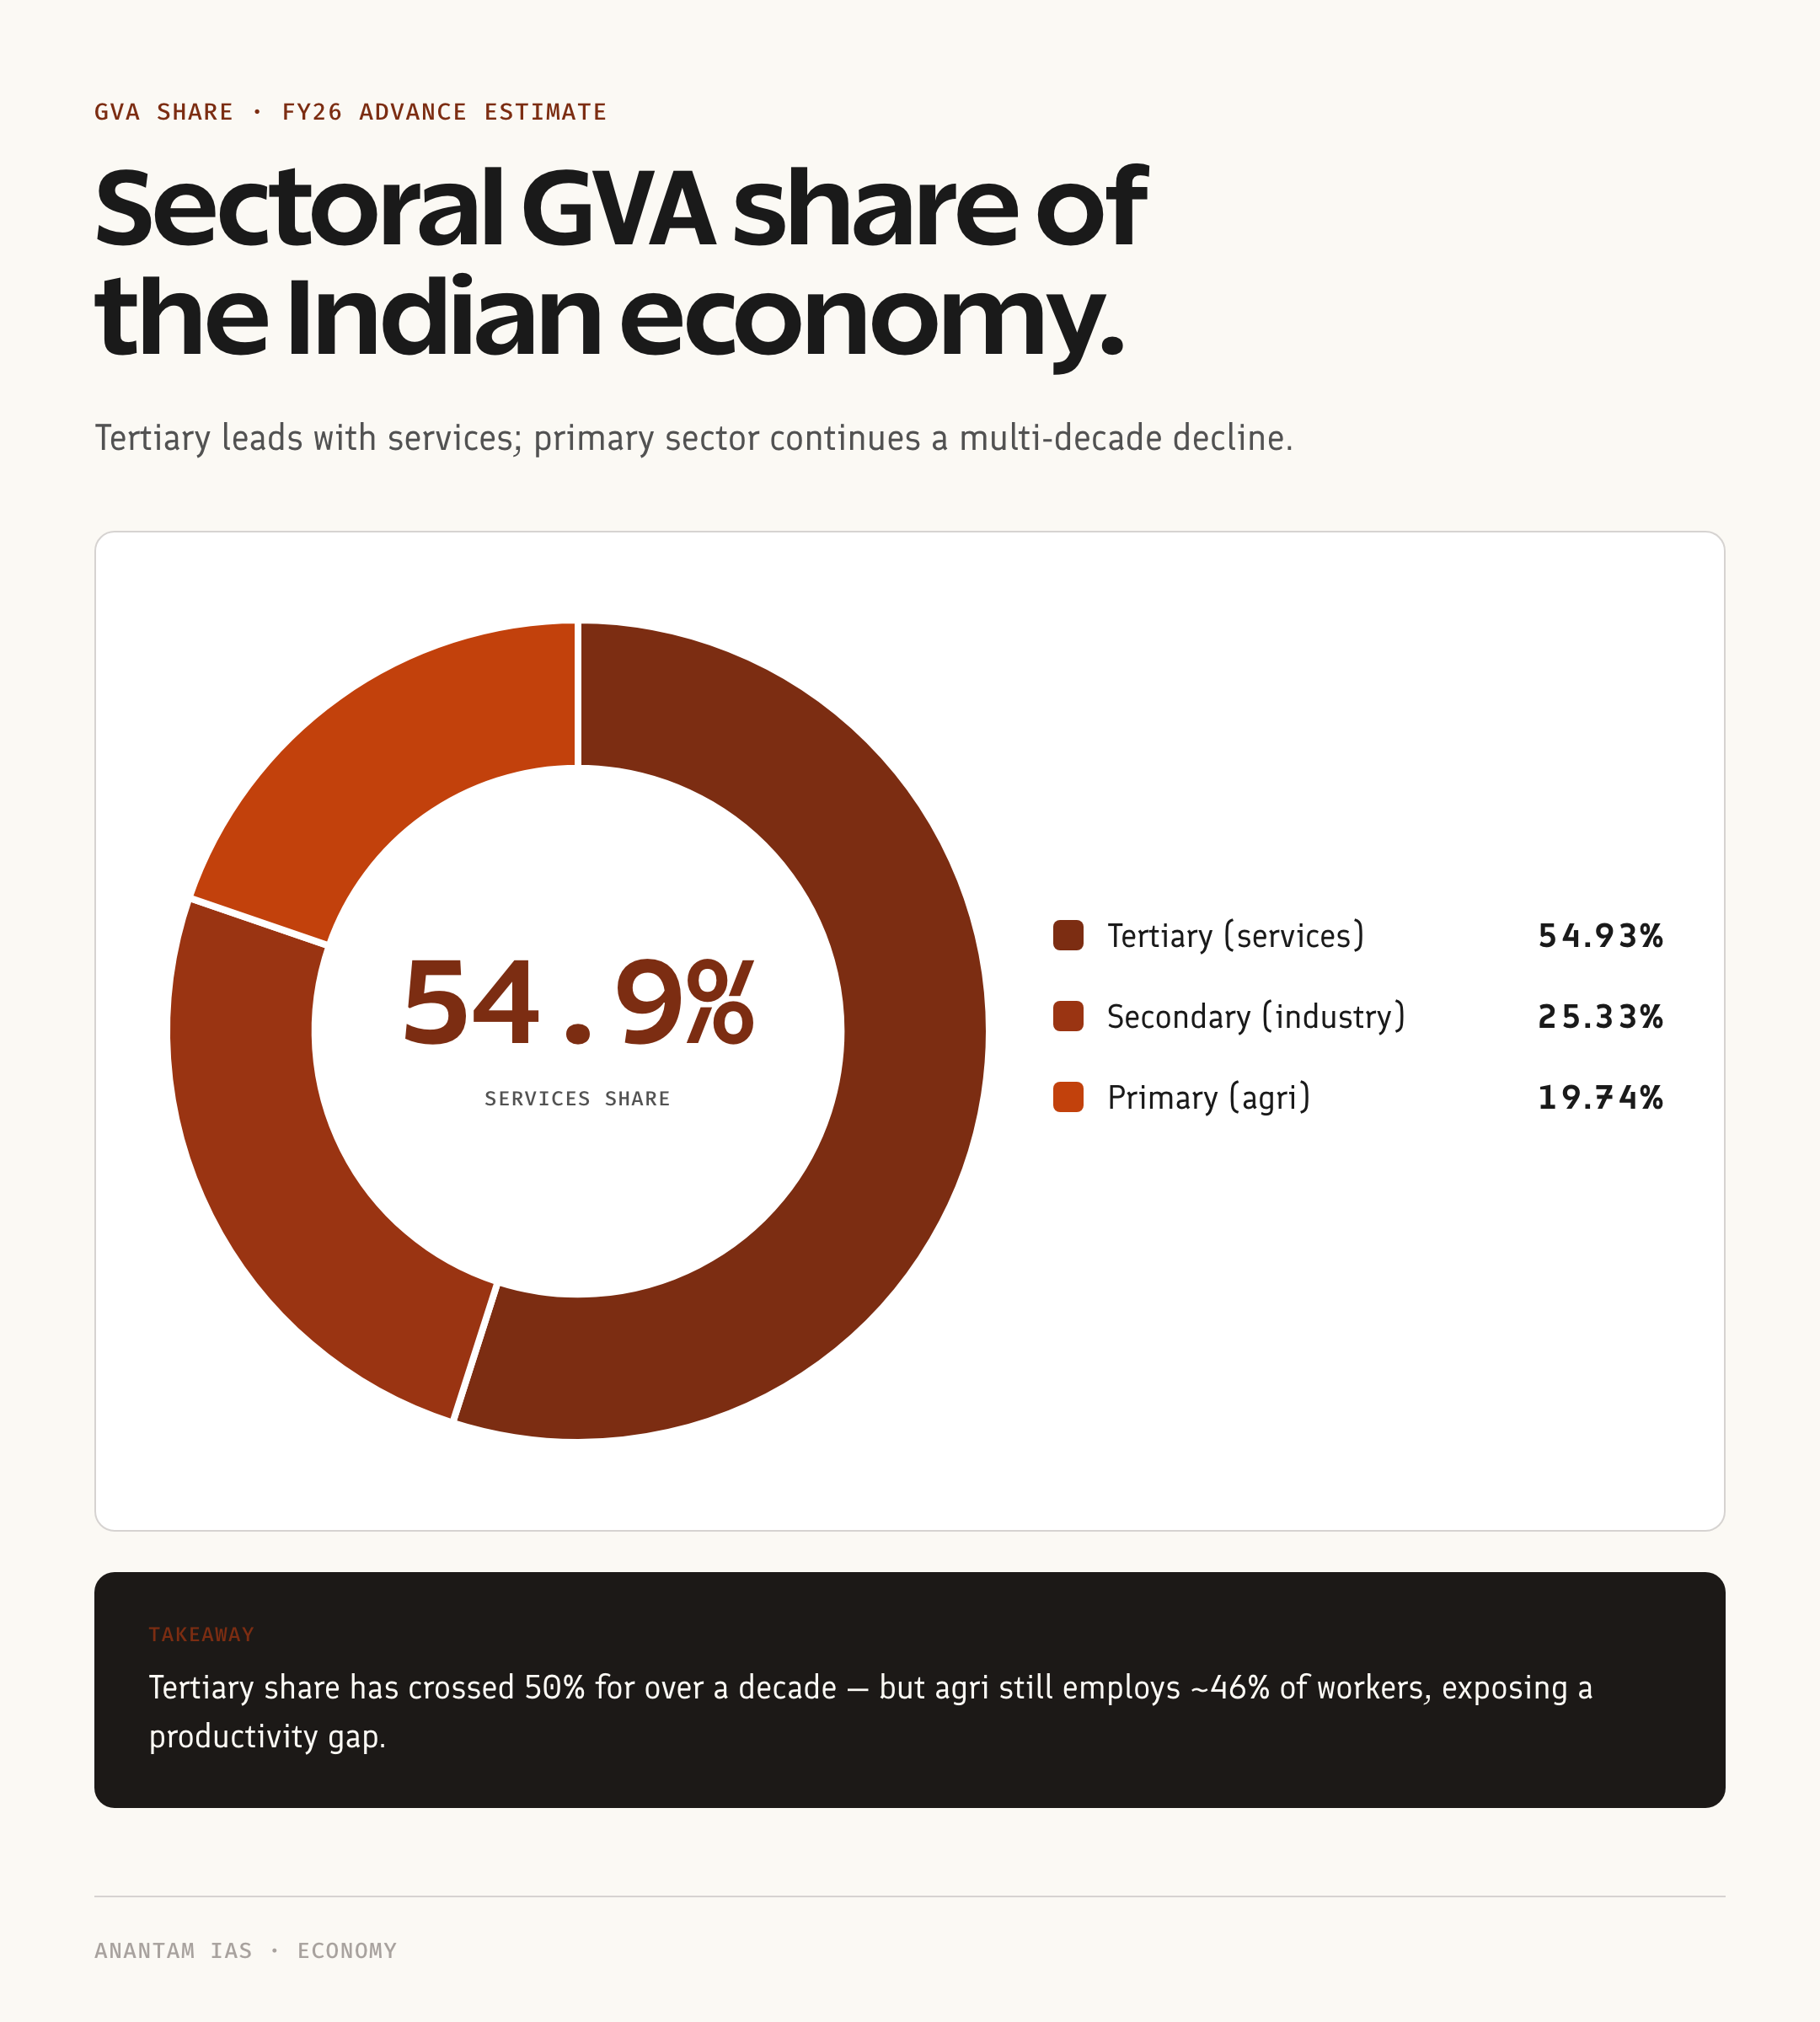
- Sectoral GVA mix (FY26 advance estimates) — primary 19.7%, secondary 25.3%, tertiary 54.9%.
Structure of the Indian economy — the sectoral skeleton
Economists slice the economy three ways. You should know all three.
By production sector (GVA share, FY26):
- Primary — agriculture, forestry, fishing, mining — 19.74%
- Secondary — manufacturing, construction, electricity, gas — 25.33%
- Tertiary — services, trade, finance, IT, public admin — 54.93%
By employment (PLFS 2023-24):
- Primary — ~46.1% of workforce
- Secondary — manufacturing alone is 11.4%, construction higher
- Tertiary — ~28.9%
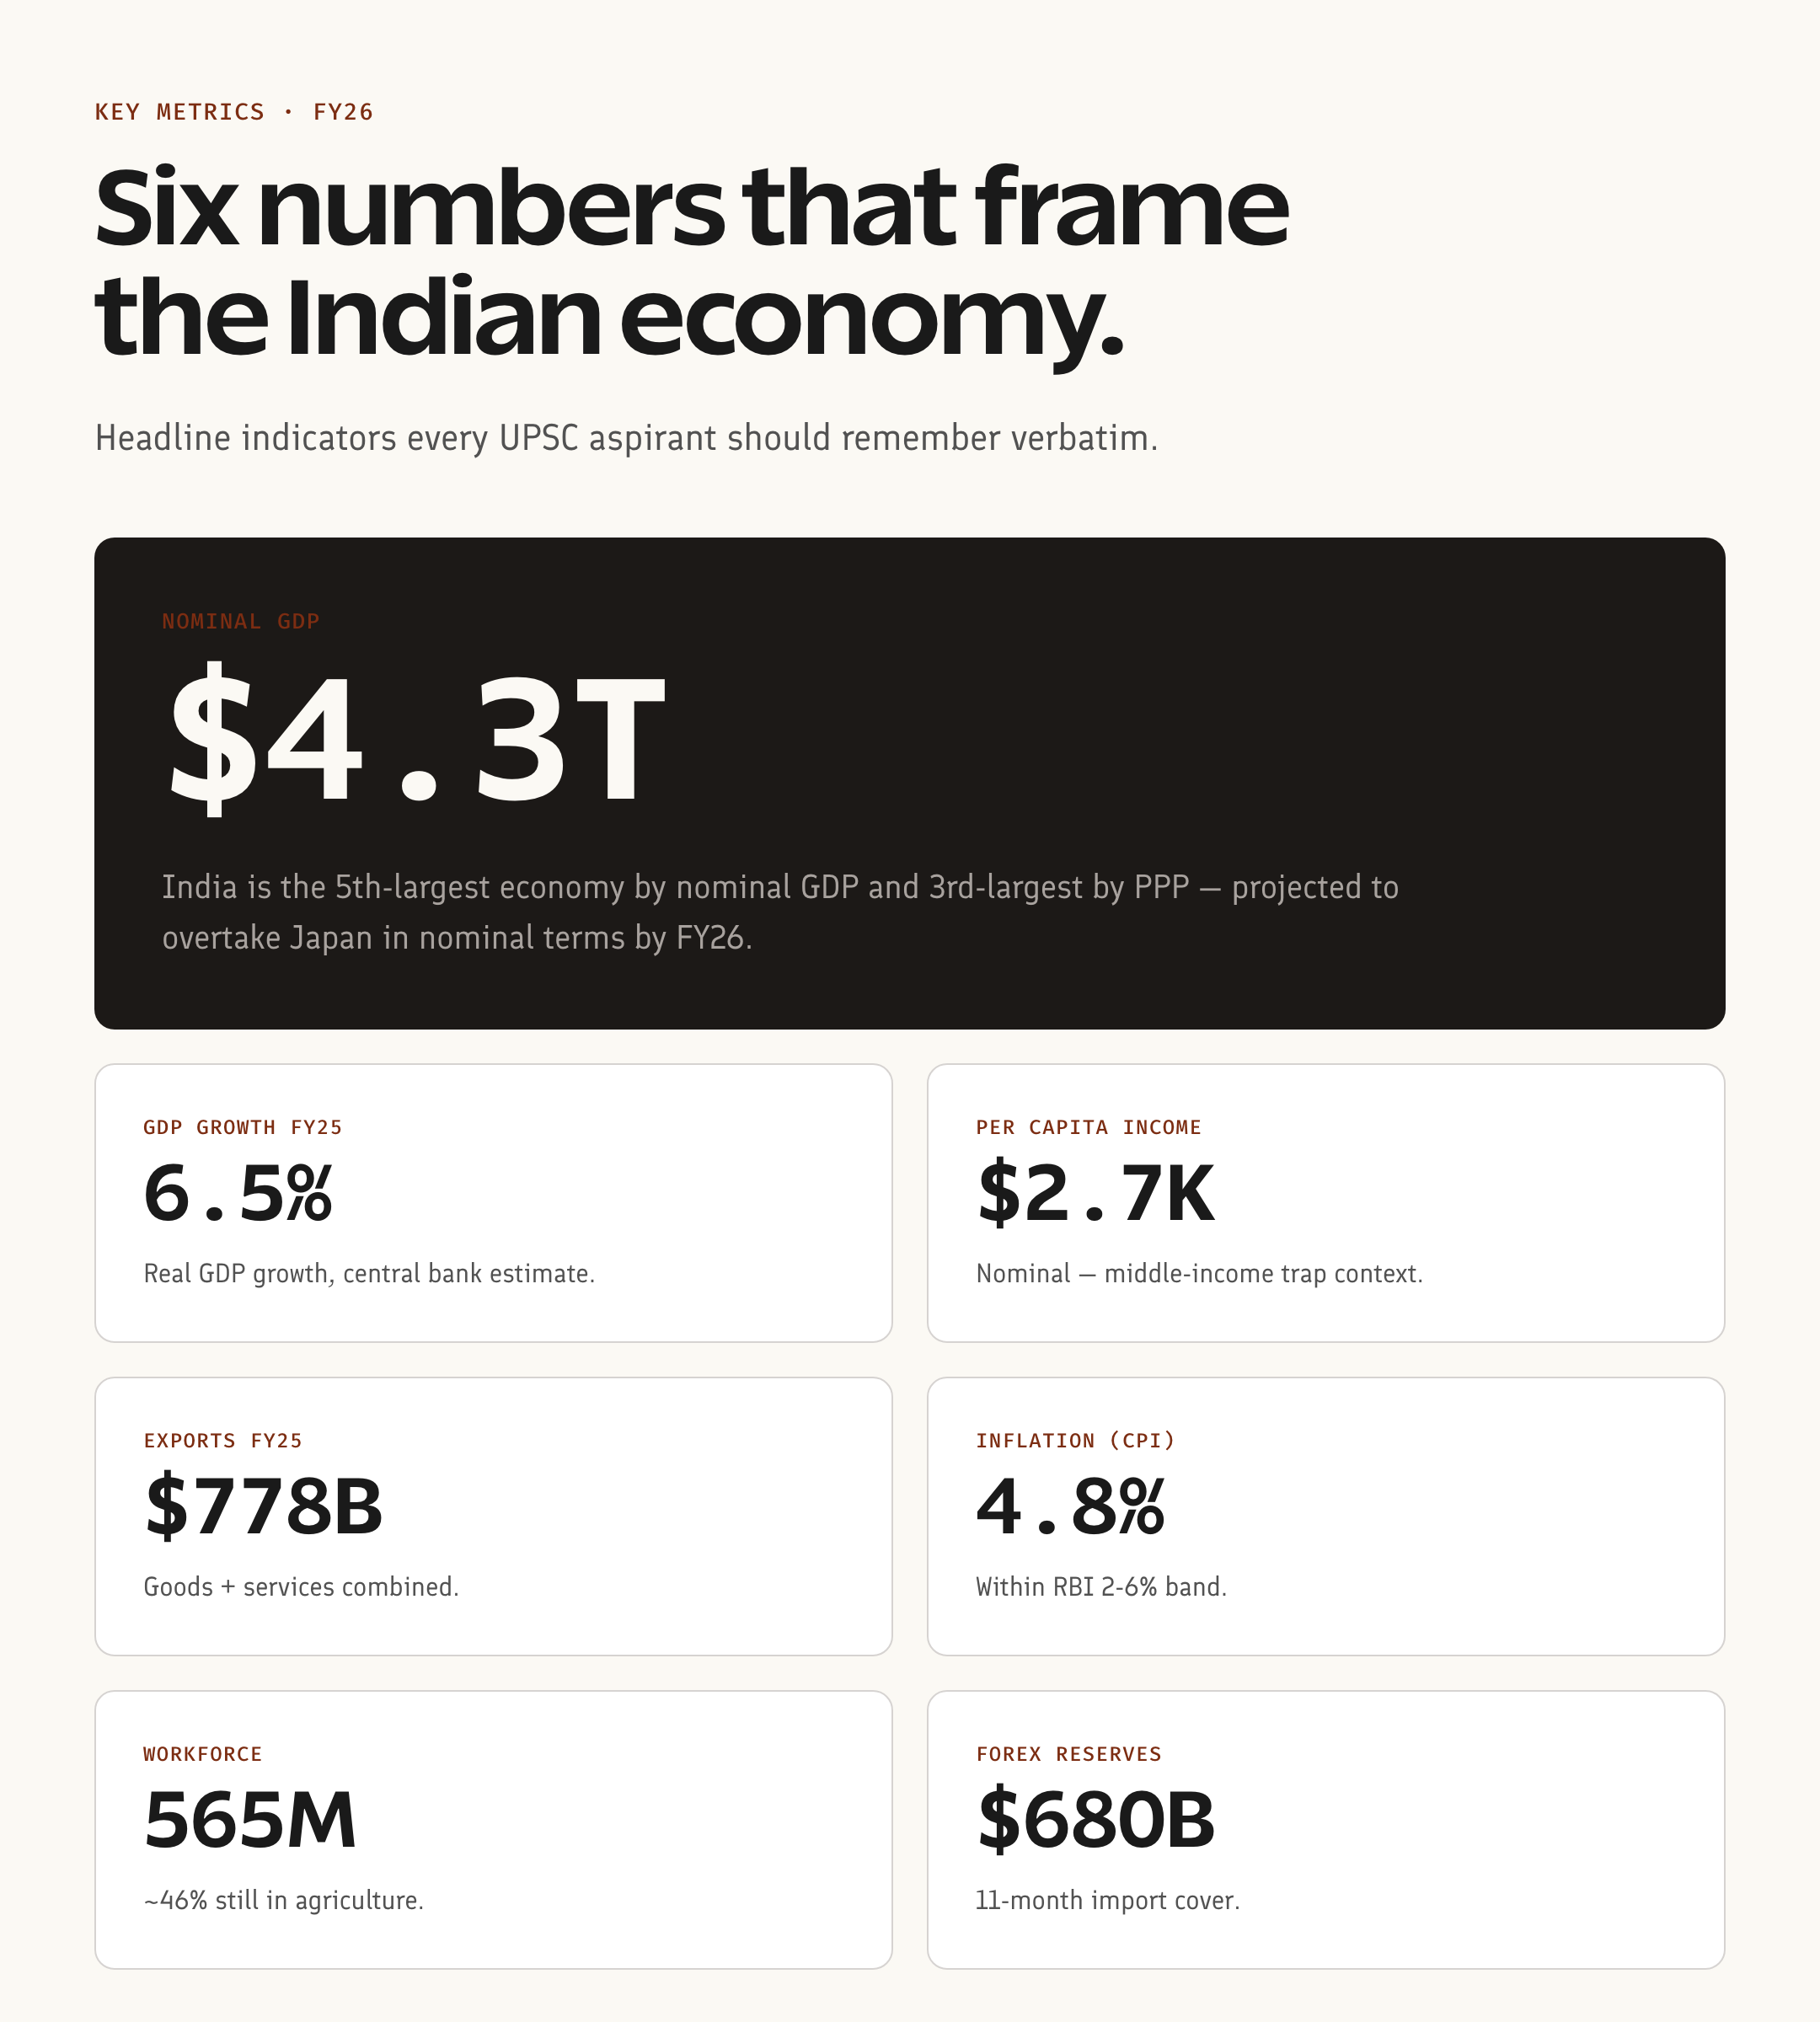
By ownership: public, private, and joint sector — the legacy of the Industrial Policy Resolutions of 1948 and 1956. After 1991, the private sector took over most of the action. After 2014, disinvestment and privatisation accelerated again.
Look at the GVA-vs-employment gap. Agriculture is 19.7% of output but 46% of jobs. That single statistic is the structural problem of the Indian economy — too many people farming too little value. Mains GS3 questions on "jobless growth" and "structural transformation" all trace back to it.
Growth phases — eight decades in five chapters
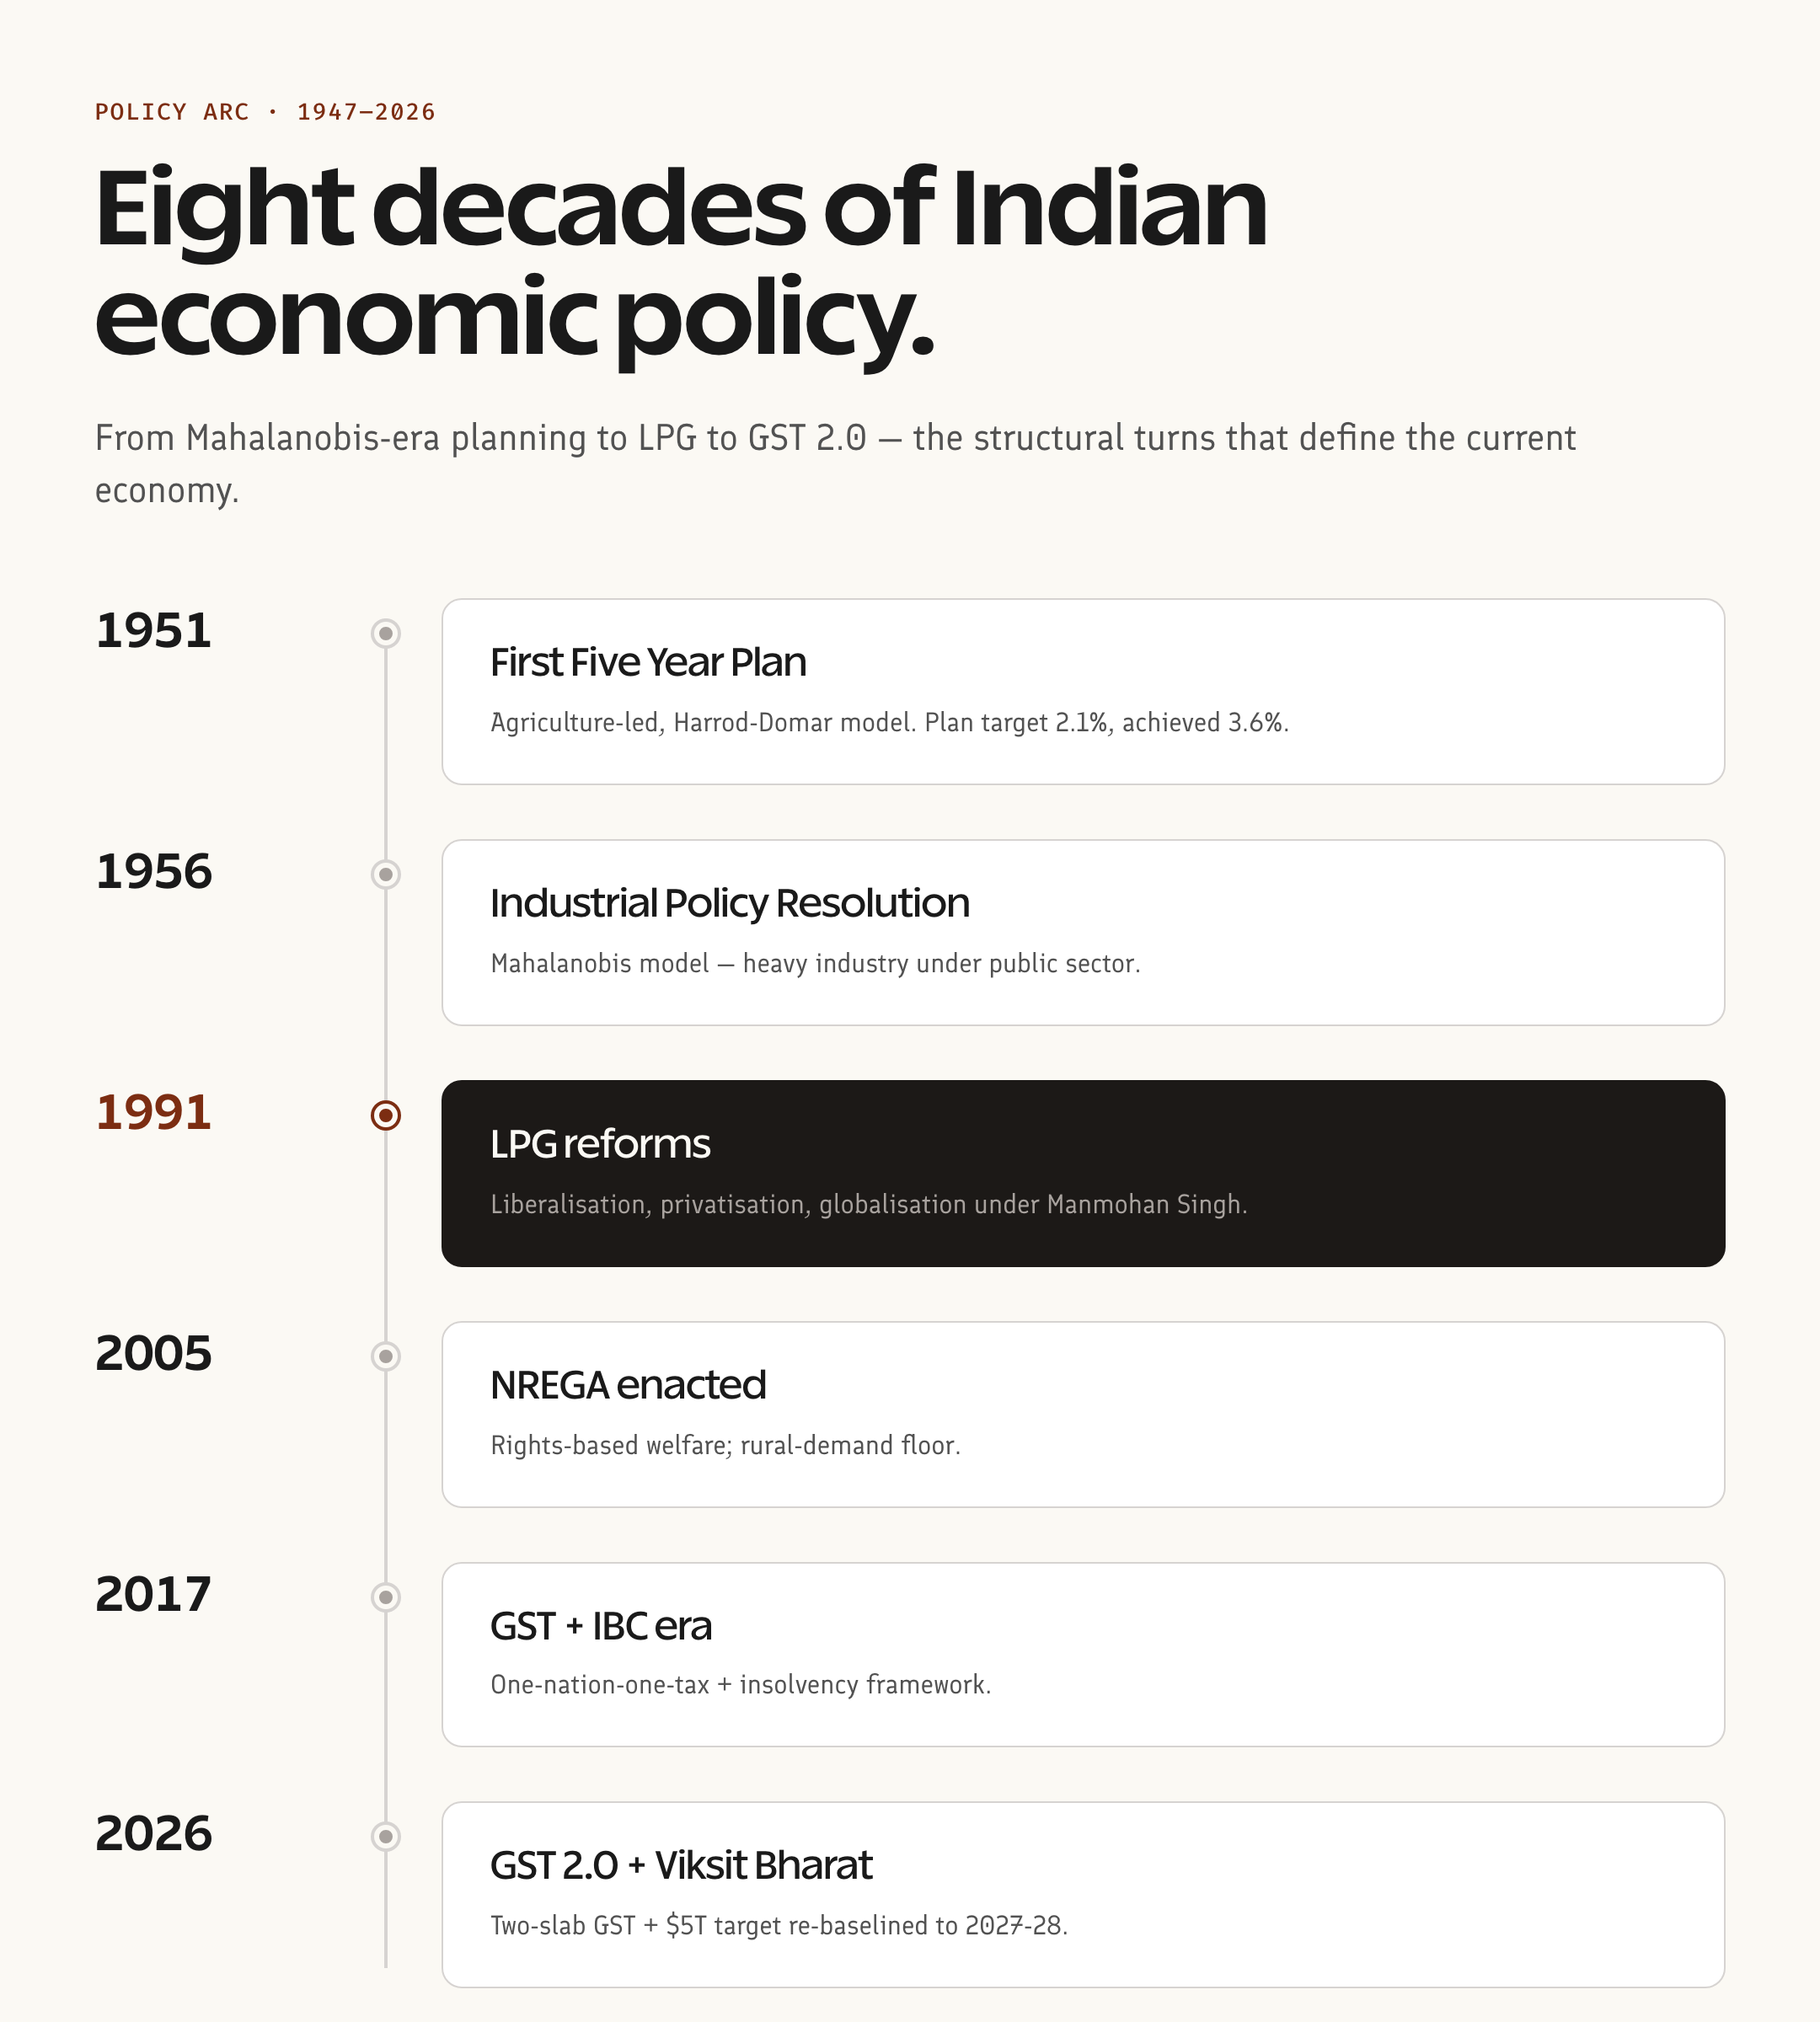
The Indian economy's story breaks cleanly into five phases. Memorise these dates — they show up in Prelims year-list questions.
1. The Hindu rate of growth (1950–1980). Average GDP growth around 3.5%. Mahalanobis-led heavy industry push, import substitution, License Raj. Raj Krishna coined "Hindu rate of growth" to mock the stagnation. Per-capita income barely moved.
2. Reluctant reform decade (1980–1991). Growth nudged up to 5.6%. Rajiv Gandhi loosened licensing on computers and telecom. Borrowing financed it… and that's exactly what triggered the 1991 BoP crisis.
3. Post-reform breakout (1991–2003). Manmohan Singh's July 1991 budget — the Liberalisation, Privatisation, Globalisation moment. Growth averaged 6%. Services took off… and so did inequality, but that's a separate debate. Read the analysis of 1991 LPG reforms for the full breakdown.
4. Dream run (2003–2008). GDP grew 8–9% for five years straight. Forex reserves quadrupled. Then 2008 happened.
5. Volatile 2010s + Covid + recovery (2010–2026). Taper tantrum (2013), demonetisation (2016), GST rollout (July 2017), Covid contraction (-5.8% in FY21), and a sharp rebound. FY24 grew 9.2%, FY25 hit 7.4%, FY26 is on track for 6.5%. India is now the fastest-growing major economy… by a wide margin.
The 2026 macro snapshot — numbers a UPSC aspirant must cite
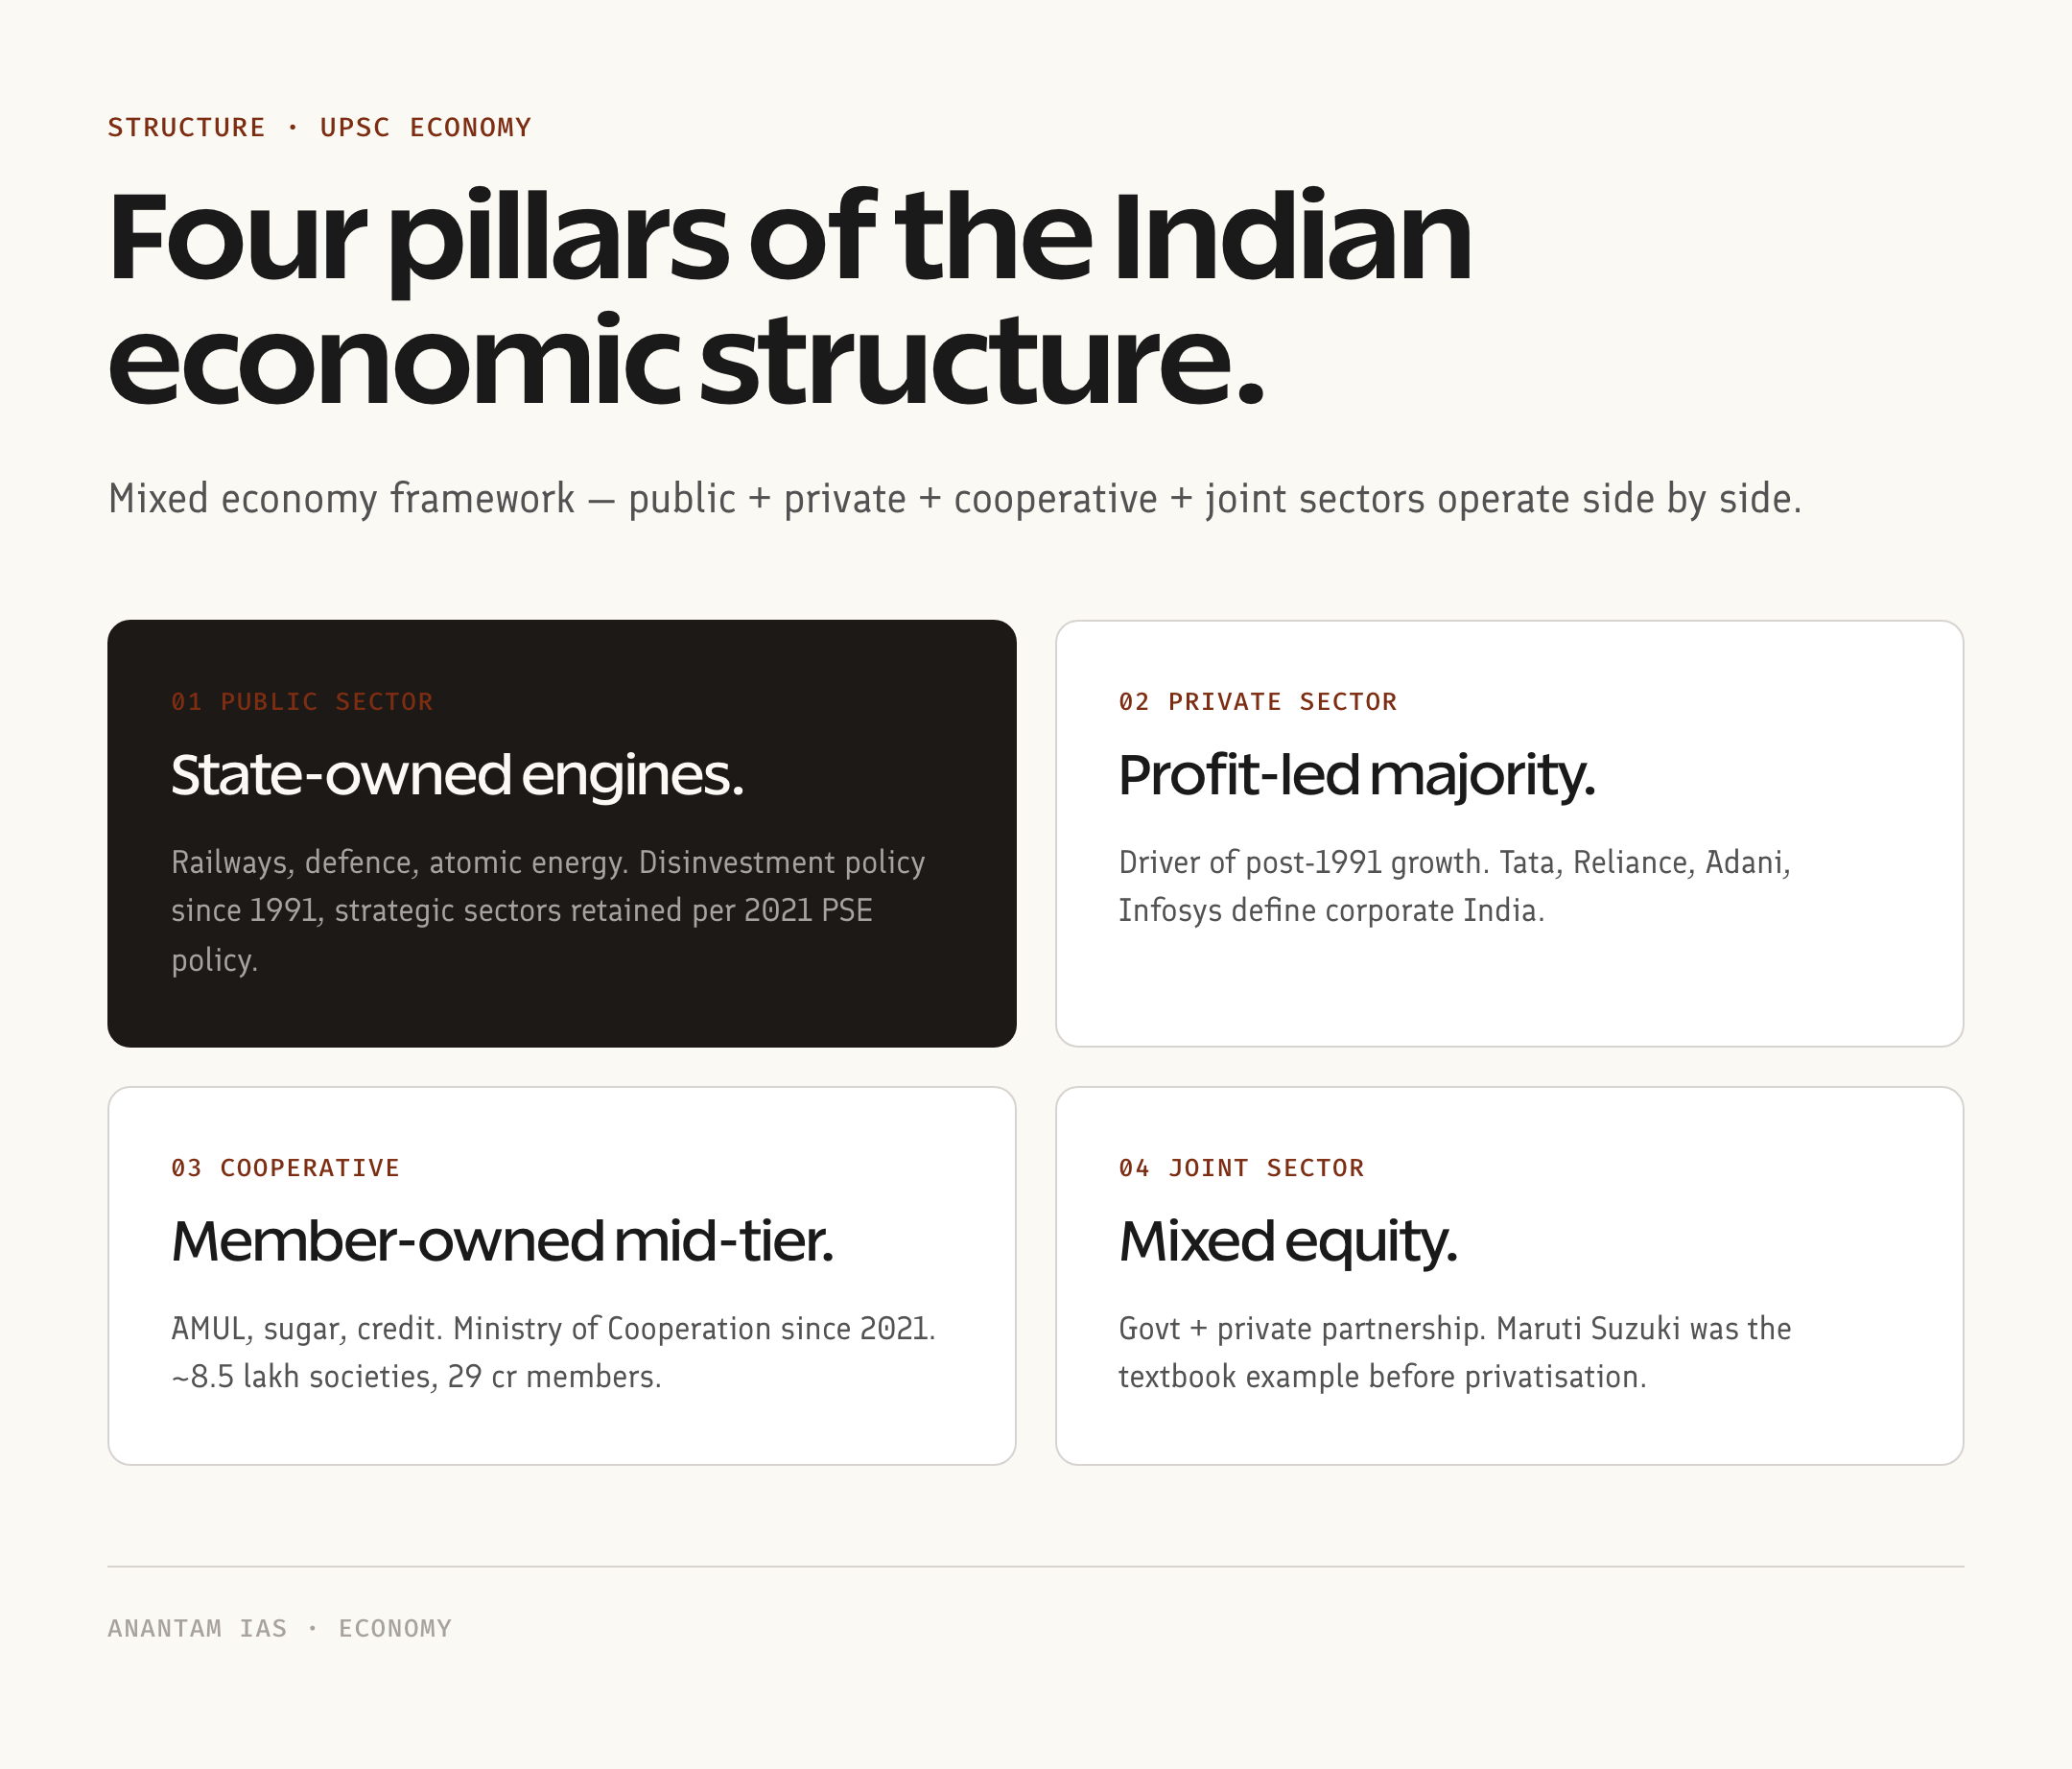
Don't write essays without these. Mains examiners reward specificity.
- GDP nominal — ~$4.15 trillion (IMF, 2026 estimate). Rupee at ~₹86/$ has compressed dollar rank.
- GDP real growth — 6.5% FY26 (IMF), 7.4% FY25 (NSO).
- Per-capita income — around $2,900 (nominal, 2026). Still ~140th globally.
- CPI inflation — 3.2% (Feb 2026), well within RBI's 4±2% band. Headline averaged 1.7% in April-Dec 2025.
- Fiscal deficit — 4.51% of GDP (FY26 RE). Glide path target is 4.4% by FY26.
- Current account deficit — 0.8% of GDP in H1 FY26. Comfortable.
- Forex reserves — $701.4 billion (Jan 2026 peak). 4th-largest stockpile globally.
- FDI inflows — $81 billion in FY25, equity FDI $47.9 billion in April-Dec FY26.
- Tax-to-GDP ratio — ~11.7% (Centre), ~17.5% (Centre + States combined).
- Forex reserves cover — ~10–11 months of imports.
Major reform waves — six that reshaped the economy
The Indian economy didn't liberalise overnight. Six reform clusters did the work.
- 1948–1956: Mahalanobis model — Industrial Policy Resolutions, Public Sector dominance, heavy industry priority.
- 1965–1980: Green Revolution + bank nationalisation — HYV seeds, MSP, 14 banks nationalised in 1969 (six more in 1980). Read Green Revolution for context.
- 1991: LPG reforms — devaluation, license abolition, FDI liberalisation, FERA → FEMA.
- 2000–2010: Second-generation reforms — VAT (2005), telecom revolution, IT services boom, BSNL/MTNL stagnation.
- 2014–2020: Make in India era — Insolvency and Bankruptcy Code (2016), GST (July 2017), Jan Dhan-Aadhaar-Mobile trinity, Make in India (2014).
- 2020–2026: Atmanirbhar wave — PLI schemes (14 sectors), labour code consolidation, agriculture market reforms (now repealed), corporate tax cut to 22%, Production Linked Incentives, GIFT City buildout.
The demographic dividend — India's biggest asset (or liability)
India's median age in 2026 is ~28.4 years — the youngest among large economies. China's is 39. Japan's is 49. The window for the demographic dividend runs to roughly 2055.
Two readings of the same fact:
- Optimist — 65% working-age population, IT-services giant, English-fluent, manufacturing relocation from China.
- Pessimist — 8 million net new job-seekers per year, formal sector hiring under 1 million, agriculture re-absorbing labour (a bad sign).
If formal sector job creation doesn't accelerate, the dividend becomes a disaster. Examiners have asked this in 2019, 2022, and 2024 Mains. Honestly, it's the single most important question for India@2047.
India@2047 vision — Viksit Bharat targets
The Viksit Bharat 2047 framework was unveiled in 2024 and updated through the Economic Survey 2025-26. Core targets:
- GDP target — $30 trillion by 2047 (nominal).
- Per-capita income — $18,000–22,000.
- Manufacturing share — 25% of GVA (currently 13–14%).
- Renewable energy — 500 GW by 2030.
- R&D spend — 2% of GDP (currently 0.65%).
- Urbanisation — 50% by 2050.
- Female labour force participation — 50% (currently 41.7%, PLFS 2023-24).
Hitting $30 trillion by 2047 needs ~7.5% real growth + 4% rupee appreciation/inflation differential — sustained for 22 years. Tough. Not impossible. Look at China 1980–2010.
Why the Indian economy matters for UPSC
Across the GS papers and the optional, the Indian economy anchor shows up everywhere.
- Prelims — sectoral GDP shares, fiscal deficit numbers, current account, FDI routes, NITI Aayog vs Planning Commission, RBI's monetary policy framework.
- Mains GS3 — growth-equity trade-off, jobless growth, inclusive growth, demographic dividend, Atmanirbhar Bharat, manufacturing failure, agrarian distress.
- Essay — "Growth without development is colonial," "Reforms 2.0," "From license raj to PLI raj."
- Interview — "Why has India slipped to 6th in nominal GDP rank?" That's a 2026 standard.
Common misconceptions
Myth 1 — "India is the 5th largest economy." Correction: India was 5th briefly in 2024. As of April 2026, IMF places India 6th behind UK and Japan, primarily due to rupee depreciation (~11% in 2025) and a GDP base-year revision.
Myth 2 — "Services dominate because manufacturing failed." Partially true. But services also dominate in the US (78%), UK (72%), and France (70%). What's atypical is India skipped the manufacturing-led mass employment phase — China, Korea, Japan all went through it.
Myth 3 — "Five-year plans still exist." No. The Twelfth FYP (2012–17) was the last. NITI Aayog replaced the Planning Commission in January 2015. We now have three-year action plans + seven-year strategies + 15-year visions.
Myth 4 — "Higher fiscal deficit always means bad economics." Context matters. FY21's 9.2% deficit was justified — pandemic. FY26's 4.51% is moving back to glide path. The FRBM Act target is 3% of GDP, but post-Covid normalisation runs longer than the law assumed… and the glide path itself has been redrawn twice.
Well, here's the corollary — fiscal deficit is a useful number, debt-to-GDP is the cleaner one. India's general government debt sits around 81% of GDP (2026), high for an emerging economy.
How to revise the Indian economy in 30 minutes
Here's the source priority that actually works:
- NCERT Class 11 — Indian Economic Development (45 minutes for the full book, one-time read)
- Ramesh Singh — Indian Economy (the standard Mains source — read chapters 4, 5, 7, 9, 10, 11)
- Economic Survey 2025-26 (Vol I and II — read chapter summaries on PRS India)
- Union Budget 2026-27 speech and the Annual Financial Statement
- PIB releases on FDI, forex, fiscal deficit (monthly)
- Mrunal Patel for current numbers, Sanjeev Verma for conceptual depth
For revision, build a one-page macro snapshot with the 10 numbers above. Update it after every quarterly NSO release. That single sheet wins you 30 marks across Prelims and Mains… and that's not a small claim.
Look, most aspirants treat economy as a memorisation game. It isn't. Economy is a numbers-with-narrative subject. Hold the narrative — Hindu growth → reforms → globalisation → reform 2.0 → Atmanirbhar — and the numbers stick to it. Reverse that, and you're memorising a phone book.
Frequently Asked Questions
What is India's GDP rank in 2026?
India is 6th in nominal GDP (~$4.15 trillion, IMF April 2026 estimate) and 3rd in PPP terms. India had briefly held 5th place in 2024 but slipped behind the UK and Japan in early 2026 due to rupee depreciation and a GDP base-year revision.
What is India's GDP growth rate for FY26?
Real GDP is projected to grow at 6.5% in FY26 (IMF), making India the fastest-growing major economy. FY25 grew 7.4% (NSO provisional).
Which sector contributes the most to Indian GDP?
The tertiary (services) sector at 54.93% of GVA in FY26. It includes IT, banking, trade, finance, public administration, and tourism.
Why did India slip to 6th rank in 2026?
Two reasons: rupee depreciated ~11% against the dollar in 2025, compressing dollar-denominated GDP, and the new GDP series (base year 2022-23) revised FY26 GDP from ₹357 trillion to ₹345 trillion — about a 3-4% downward correction.
When was the last Five-Year Plan in India?
The Twelfth Five-Year Plan (2012–2017) was the last. After it, NITI Aayog replaced the Planning Commission and introduced three-year action plans, seven-year strategies, and 15-year visions.
What is India's fiscal deficit in FY26?
FY26 Revised Estimate is 4.51% of GDP, moving down toward the FRBM Act target of 3%.
Is India still a developing economy?
Yes. Per-capita income (~$2,900 nominal, 2026) is far below the World Bank's high-income threshold of ~$14,005. India is classified as a lower-middle-income country.
Watch on YouTube
Related video from the Anantam IAS YouTube channel.
Indian Economy for Beginners
