GDP Growth vs Income Inequality: What Should India Do? (UPSC Economy)
Should India prioritise GDP growth or fight inequality first? Compare the trade-off, Economic Survey 2020-21 logic, Gini data, and 2024-26 policy debate for UPSC.
For decades, mainstream economics treated growth and equity as a long-run trade-off — the Kuznets curve — where inequality first rises and then falls as economies industrialise. The Global Financial Crisis of 2008 unsettled this consensus. In advanced economies, growth slowed while top-income shares kept climbing, prompting Thomas Piketty, Joseph Stiglitz, and Branko Milanovic to argue that capitalism without redistribution is unstable and inefficient. The Economic Survey 2020-21 of India responded by drawing a sharp distinction: in low-poverty advanced economies, redistribution may be the right priority; in high-poverty developing economies like India, growth is still the most powerful poverty reducer. This article unpacks the theoretical debate, the Indian data, and the 2024-26 policy choices UPSC aspirants must master under GS-III (Inclusive growth, Indian economy).
The Core Trade-off
Two Camps
- Growth-first camp: Sustained high growth lifts millions out of absolute poverty by expanding employment, public revenues, and consumption. Redistribution without a growing pie shrinks everyone's share.
- Equity-first camp: Highly unequal societies under-invest in human capital, suppress aggregate demand, breed political instability, and slow growth. Redistribution is therefore growth-enhancing.
The honest answer depends on where a country sits on the development curve — its levels of absolute poverty, public-good provisioning, and the shape of its income distribution.
Advanced Economies vs India
| Indicator | USA | India |
|---|---|---|
| Gini coefficient (consumption-based, latest comparable) | ~0.41 | ~0.32 (NSS) / 0.41 (income-based World Bank 2024) |
| Absolute poverty (extreme) | <2% | ~12% (World Bank 2024 at $2.15 PPP line) |
| Per capita GNI (Atlas, 2024) | ~$80,000 | ~$2,500 |
| Tax-to-GDP | ~28% | ~12% (Centre) |
| Growth potential | 1.5-2% | 6.5-7% |
| Policy priority (Economic Survey 2020-21 logic) | Redistribute | Grow |
The asymmetry is stark: the USA has higher inequality but lower poverty and lower growth potential; India has lower measured inequality but higher absolute poverty and far higher growth potential.
The Economic Survey 2020-21 Argument
The Chief Economic Adviser's chapter "Does Growth Lead to Debt Sustainability? Yes, But Not Vice Versa" and the parallel chapter on inequality and growth argued:
- In advanced economies, growth and inequality have divergent effects on socio-economic indicators — growth helps, but unchecked inequality can hurt the poorest.
- In India and other developing economies, growth and inequality have convergent effects on socio-economic outcomes — both are correlated with falling poverty, infant mortality, child malnutrition, and rising literacy. The bigger pie dominates.
- Empirical correlation: Indian states with higher per-capita income show better health, education, and consumption outcomes, even when their inequality is higher.
- Policy implication: India should pursue growth-friendly policies first — labour reforms, infrastructure, skilling — and use redistribution to soften, not substitute, growth.
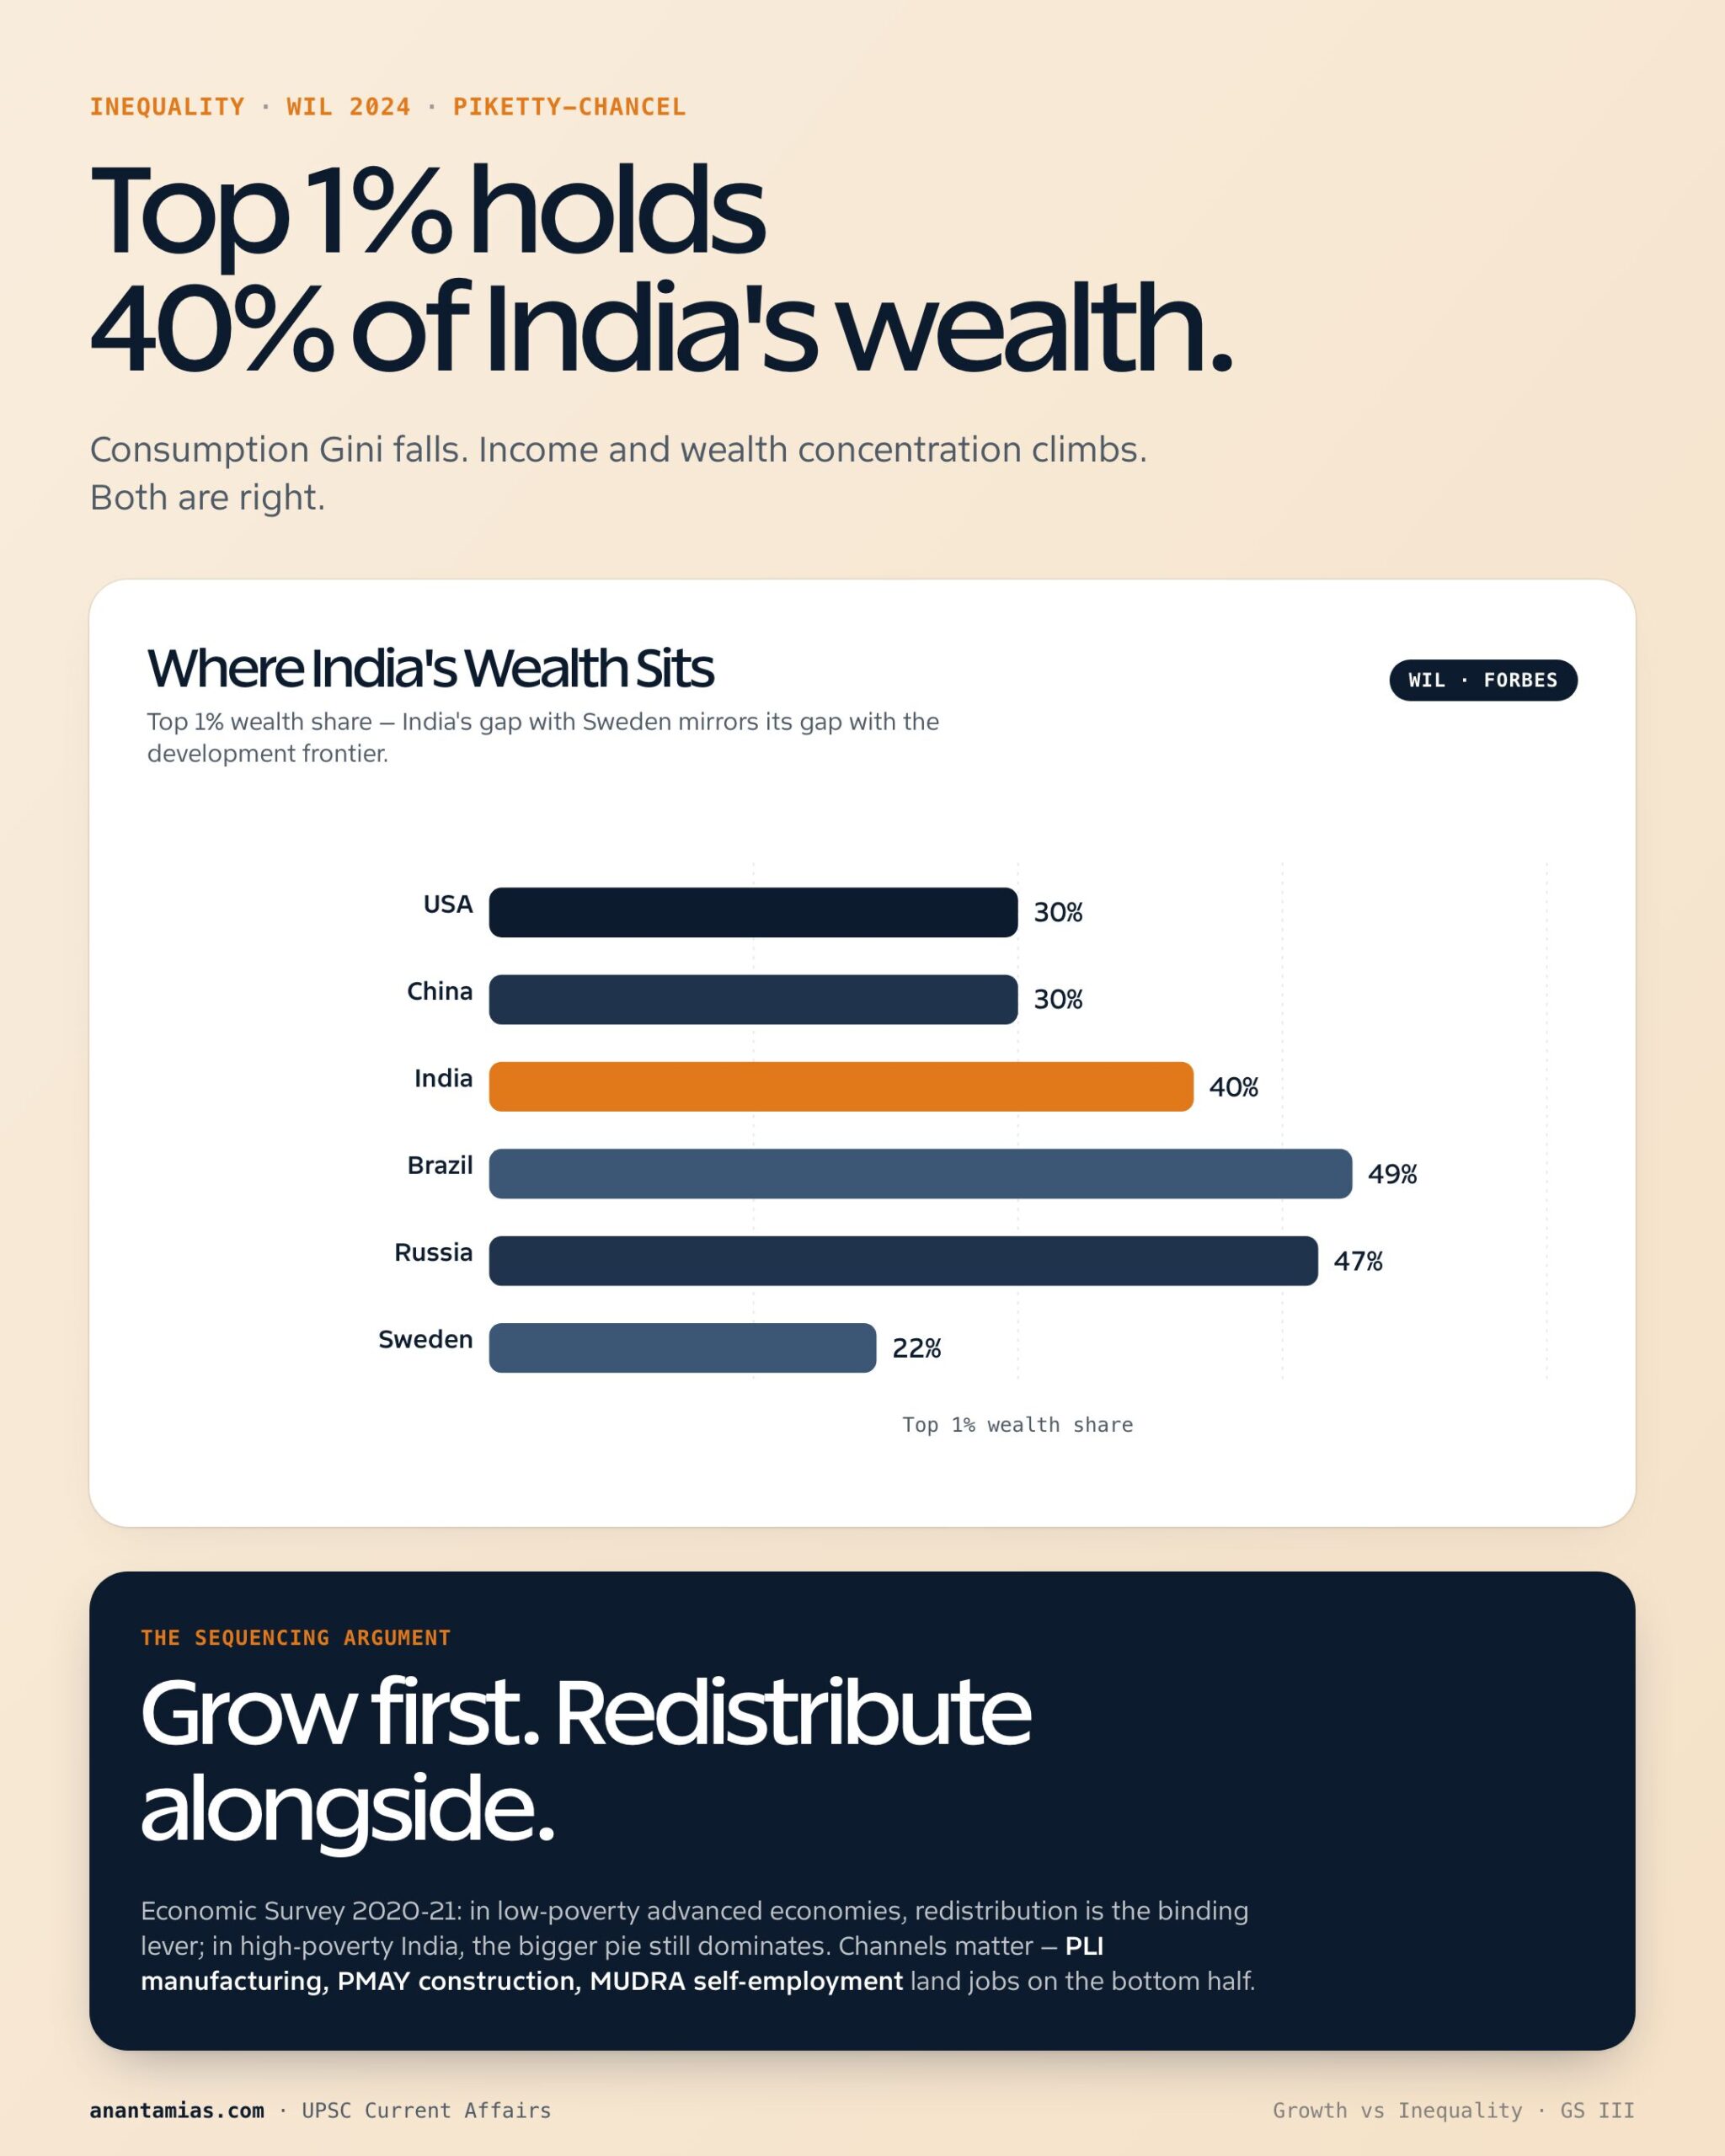
This is not a rejection of redistribution but a sequencing argument: redistribution becomes feasible and effective only when there is a sufficient pie to redistribute.
How Inequality Is Actually Measured in India
Multiple Datasets, Multiple Numbers
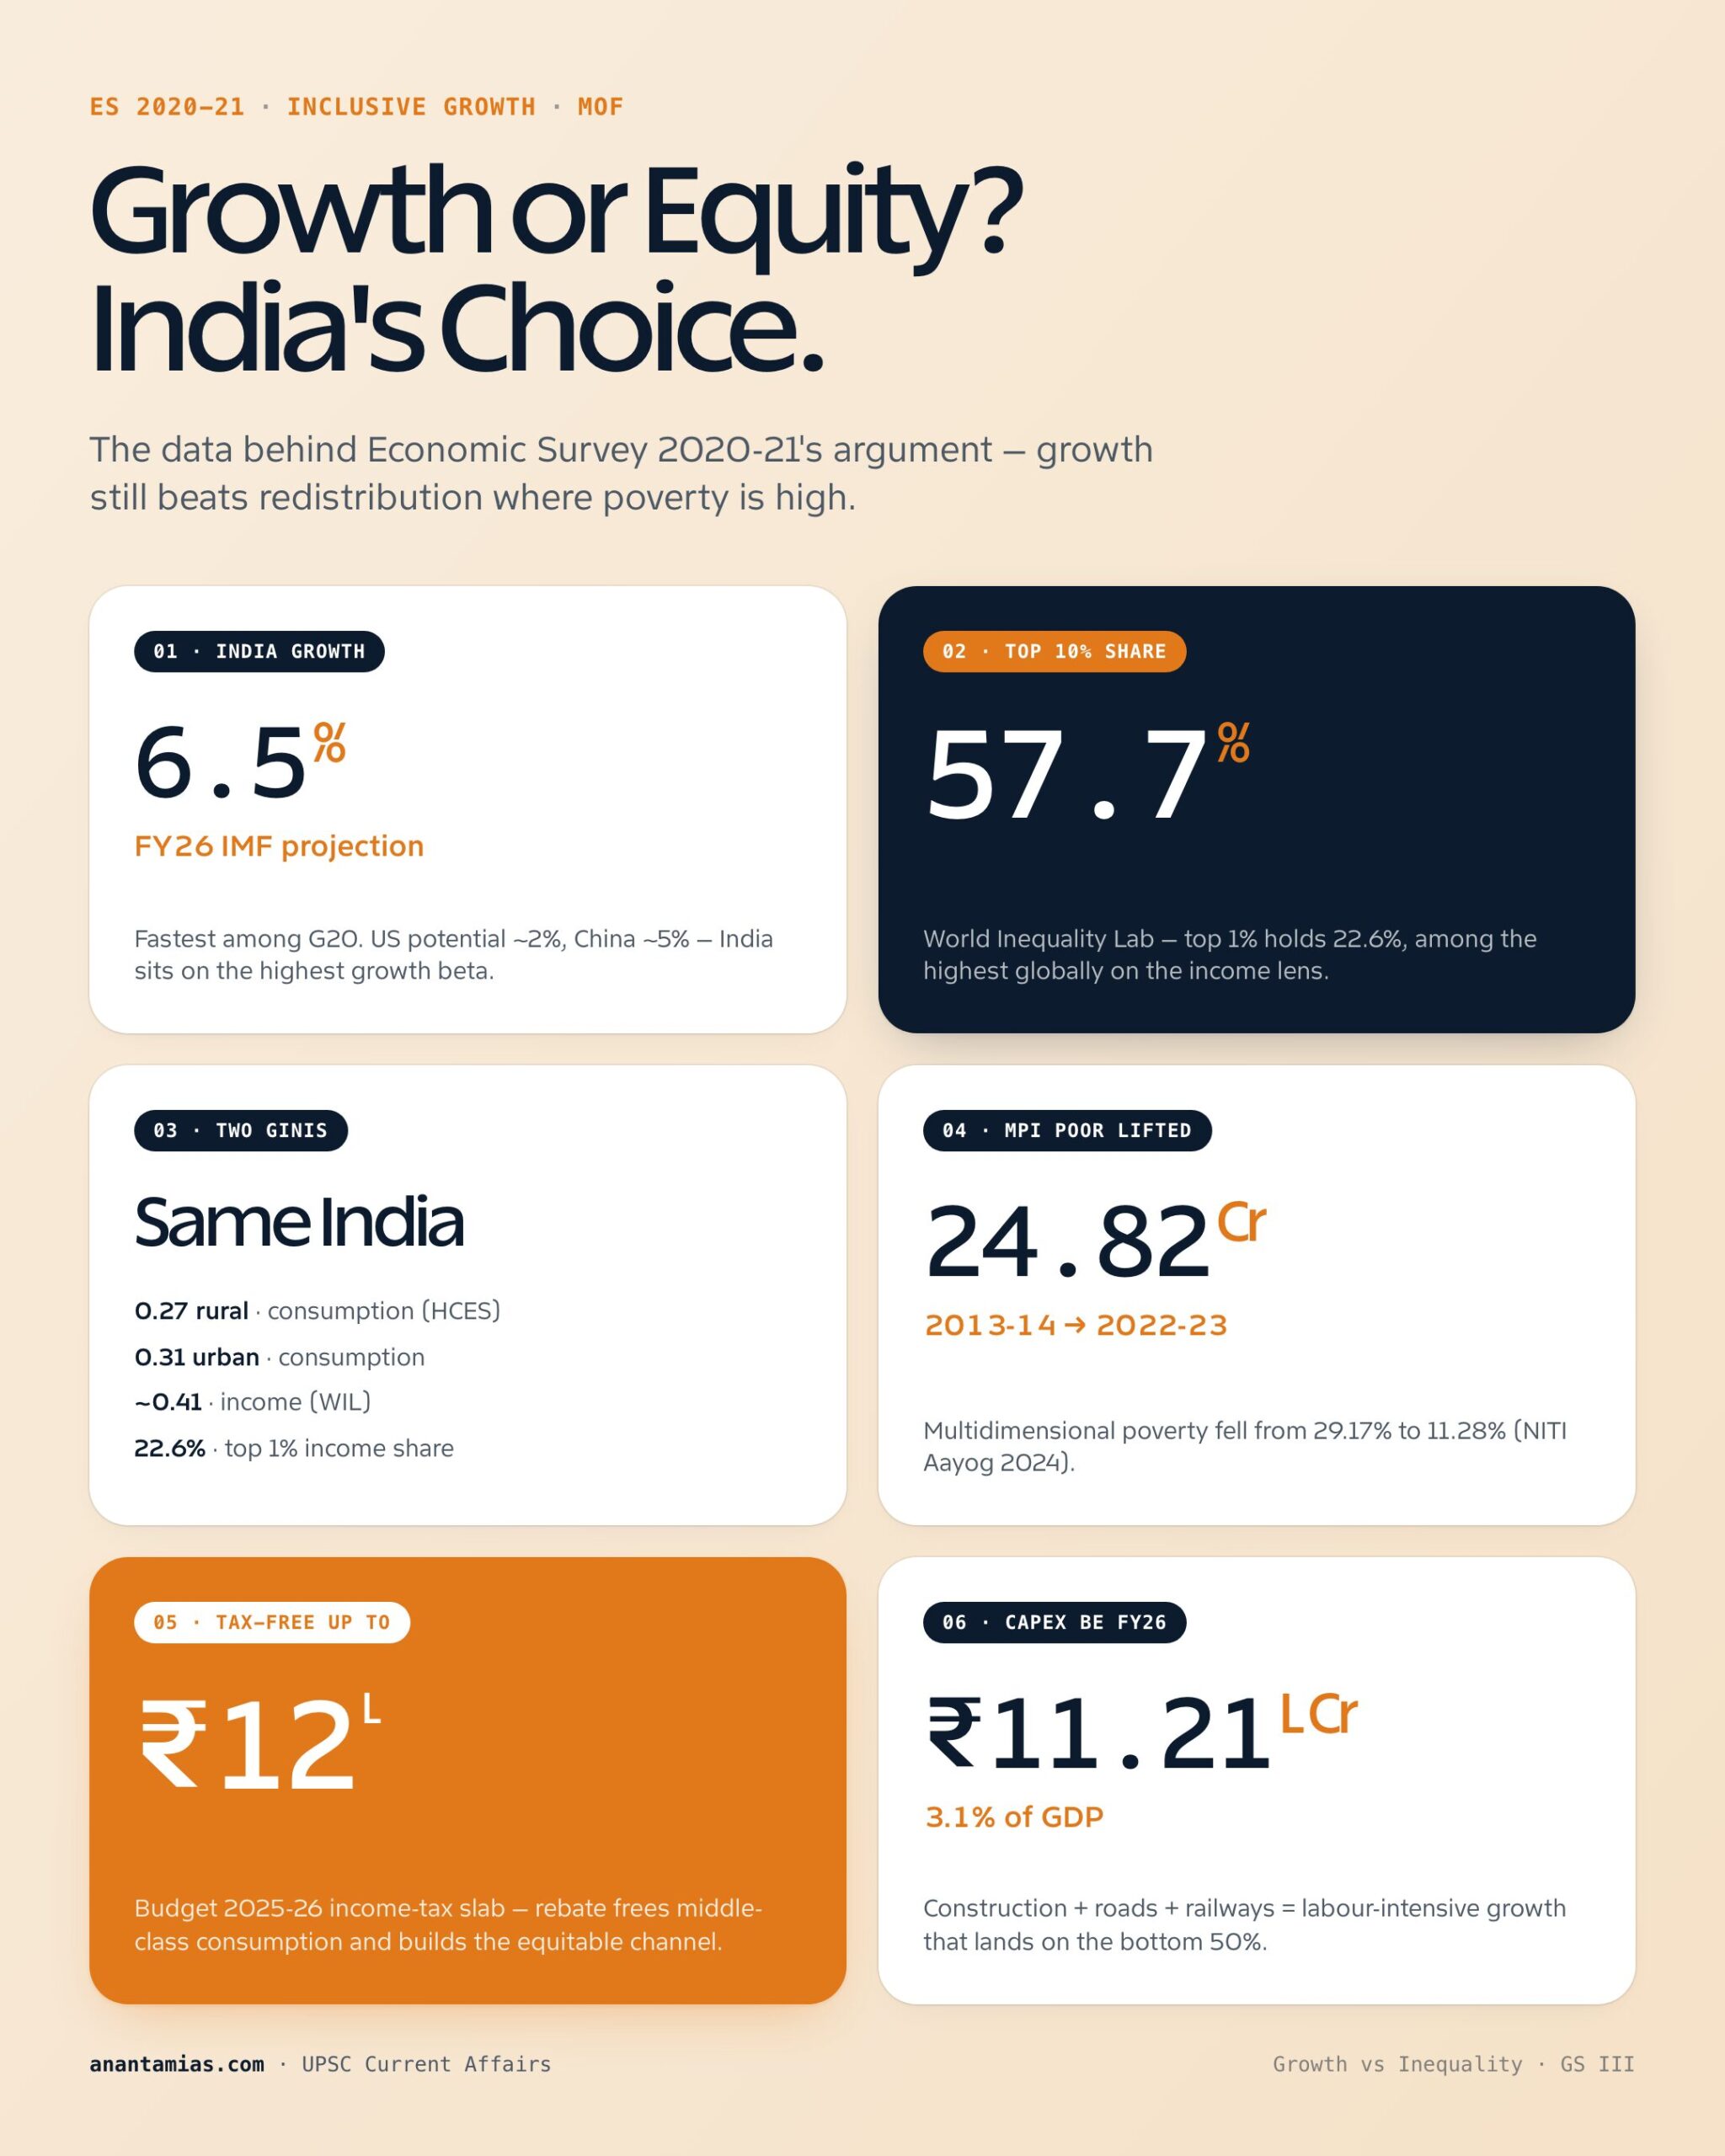
- NSSO Consumption Expenditure Surveys (HCES 2022-23, released 2024) — Gini estimated around 0.27 rural, 0.31 urban based on monthly per-capita consumption.
- World Inequality Database (Piketty-Chancel, 2024 update) — top 1 percent income share in India estimated at 22.6 percent, top 10 percent share at 57.7 percent — among the highest globally.
- PLFS — captures wage and earnings inequality.
- Forbes/Hurun lists — capture wealth concentration; the top 1 percent held nearly 40 percent of national wealth by 2023.
The Methodological Caveat
Consumption-based Gini understates inequality because the rich save and consume a smaller share. Income- and wealth-based measures show a much sharper picture. Both are valid, but for different purposes.
Recent Developments (2024-26)
Household Consumption Expenditure Survey 2022-23
Released by MoSPI in February 2024, the HCES showed:
- Average MPCE rose to Rs 3,773 (rural) and Rs 6,459 (urban) at constant 2011-12 prices — both more than doubled in nominal terms over 11 years.
- Rural-urban gap narrowed: urban-rural ratio fell from 1.84 (2011-12) to 1.71 (2022-23).
- Consumption Gini fell to 0.266 rural and 0.314 urban, the lowest readings in two decades.
- This was used by NITI Aayog to argue that multidimensional poverty fell from 29.17 percent (2013-14) to 11.28 percent (2022-23), lifting an estimated 24.82 crore people out of multidimensional poverty.
NITI Aayog Multidimensional Poverty Index 2024
- Published in July 2024, using NFHS-5 (2019-21) data.
- Showed MPI value of 0.066 down from 0.117 in 2015-16.
- Bihar, Jharkhand, Uttar Pradesh, Madhya Pradesh, and Rajasthan registered the largest absolute reductions in MPI poor.
Union Budget 2025-26 and Inclusive Growth
- Mission for Aatmanirbharta in Pulses and Mission on High-Yielding Seeds target rural incomes.
- Saksham Anganwadi and Poshan 2.0 expanded for child nutrition.
- Rs 20,000 crore for PM Kisan Maandhan, Atal Pension Yojana, and NSAP consolidation.
- Income tax slabs revised — zero tax up to Rs 12 lakh (with rebate) for salaried taxpayers, freeing middle-class consumption.
IMF and World Bank India Reports
- IMF Article IV 2025 projected India to grow at 6.5 percent in FY26 — fastest among G-20 economies.
- World Bank Poverty and Equity Brief 2024 confirmed India's extreme-poverty headcount fell from 22.5 percent in 2011 to under 12 percent in 2023.
Why Growth Alone Is Not Enough: The Counter-Arguments
Inequality Hurts Long-Run Growth
- Stiglitz (2012) showed that high inequality reduces aggregate demand because the rich save more.
- IMF research (Ostry, Berg, Tsangarides 2014) found a negative relationship between inequality and growth duration in cross-country data.
- OECD (2015) estimated that rising inequality cost the OECD nearly 5 percentage points of cumulative growth between 1990 and 2010.
Human Capital Underinvestment
When the bottom 50 percent earns only 13-15 percent of national income (Piketty's India estimate), they cannot fund quality education or health — locking generations into low productivity.
Political Economy Risks
Stark inequality fuels populist economics — loan waivers, freebies, and protectionism — that distort growth itself.
The K-shaped Recovery After Covid
India's post-pandemic recovery was visibly K-shaped: corporate profits, premium consumption, and tech sector incomes surged while informal-sector wages, MSMEs, and bottom-decile consumption stagnated. Pure GDP growth missed half the population.
What Should India Actually Do? A Synthesis
The Sequencing Argument
- Continue to target 6.5-7.5 percent GDP growth as the primary driver of poverty reduction.
- Ensure growth is labour-intensive — manufacturing (PLI schemes), construction (PMAY, Bharatmala), services tier-2/3 (BPMs).
Equality of Opportunity, Not Equality of Outcome
- Universal primary health and education of higher quality — Ayushman Bharat, PM-SHRI, Samagra Shiksha.
- Skilling at scale — PMKVY 4.0, NEP 2020 implementation.
- Asset transfers — PM Awas Yojana, MGNREGA assets, livestock subsidies.
Progressive but Pragmatic Taxation
- Plug tax leakages through GST 2.0 and digital tax administration.
- Consider inheritance/wealth tax with high thresholds — politically difficult but raised in 2024 Lok Sabha campaign discourse.
- Avoid raising marginal income tax rates that drive capital flight.
Targeted Cash Transfers
- JAM Trinity (Jan Dhan-Aadhaar-Mobile) makes targeted transfers feasible — PM-KISAN, PMUY, PMAY.
- Universal Basic Income debated in Economic Survey 2016-17 — fiscally challenging but conceptually elegant.
Place-Based Policies
- Lagging states (Bihar, Eastern UP, Odisha, Jharkhand) need dedicated industrial corridors, port access, and skilling — convergence is the most powerful inequality reducer.
International Comparisons
| Country | Strategy | Outcome |
|---|---|---|
| China | Growth-first, then targeted poverty alleviation (post-2012) | Lifted 800m out of poverty; rising inequality (Gini ~0.47) |
| Brazil | Bolsa Família + minimum wage + commodity boom | Inequality fell from Gini 0.59 to 0.52 (2002-2015), then rose again |
| South Korea | Land reforms, education, then growth | Low inequality + high growth |
| USA | Growth + market | High growth + high inequality + welfare gaps |
| Nordic countries | Strong redistribution + open economy | Low inequality + moderate growth |
India is closest to China's earlier path — high-growth poverty reduction first, with redistributive cushioning through subsidies and DBT.
UPSC Relevance
GS-III Mapping
- Inclusive growth and issues arising from it.
- Government budgeting — fiscal space for redistribution.
- Effects of liberalisation on the economy.
- Poverty and developmental issues.
Prelims Pointers
- Gini coefficient: 0 = perfect equality, 1 = perfect inequality.
- Lorenz Curve plots cumulative income share.
- Kuznets Curve: inverted-U relationship between development and inequality.
- Multidimensional Poverty Index uses 12 indicators across health, education, living standards (NITI Aayog 2024).
- HCES 2022-23 released by MoSPI in 2024.
- Economic Survey 2020-21 advocated growth-led inequality reduction.
Mains Hooks
- "In a developing economy like India, growth-led poverty alleviation is more effective than redistribution-led inequality reduction. Critically examine." (GS-III, Economic Survey 2020-21)
- "Discuss whether India's K-shaped post-pandemic recovery validates the case for stronger redistributive policies."
- "Compare and contrast the inequality reduction strategies of India, China, and Brazil."
- "Should India introduce an inheritance or wealth tax to address rising inequality? Discuss the trade-offs."
India's choice is not growth versus equity but growth that creates equity. Macroeconomic stability, labour-intensive manufacturing, expansion of public services, and DBT-backed transfers can together do what neither pure growth nor pure redistribution can. For UPSC, hold both data sets — declining consumption Gini and rising income/wealth concentration — and write nuanced answers that recognise the sequencing rather than the substitution of equity and growth.
Theoretical Frameworks Worth Remembering
Kuznets Curve
Economist Simon Kuznets hypothesised in 1955 that inequality first rises and then falls as a country industrialises — an inverted-U relationship. The curve has been challenged by post-1970s evidence showing inequality rising again in advanced economies, sometimes called the Great U-Turn.
Piketty's r > g
In Capital in the Twenty-First Century (2014), Thomas Piketty argued that when return on capital (r) exceeds economic growth (g), wealth concentrates over time at the top. India's r > g dynamic is visible in the rising top-10 percent share since 1991.
Stiglitz on Aggregate Demand
Joseph Stiglitz (The Price of Inequality, 2012) argued that highly unequal societies suffer chronic shortfalls in aggregate demand because the rich save a higher share of marginal income, depressing growth.
Sen's Capability Approach
Amartya Sen reframed inequality as inequality of capabilities (health, education, freedom), not just income. Indian policy increasingly uses this lens — multidimensional poverty, Aspirational Districts Programme, and the National Multidimensional Poverty Index.
Sectoral Channels for Equitable Growth
| Channel | Equitable Growth Mechanism | Indian Policy Tool |
|---|---|---|
| Manufacturing | Mass employment in formal sector | PLI, Make in India |
| Construction | Low-skill jobs at scale | PMAY-Urban/Gramin, Bharatmala |
| MSME | Income for self-employed | MUDRA, Stand-Up India, Credit Guarantee |
| Care economy | Female employment | Saksham Anganwadi, NLM |
| Agriculture-allied | Rural diversification | KCC, AIF, FPOs |
| Services tier-2/3 | Job-rich BPM, retail | Digital India, Bharat Net |
The choice for India is therefore practical: engineer growth that lands on the bottom 50 percent through these channels rather than choose abstractly between growth and inequality.