A child who is stunted at age two doesn’t grow out of it. The height she lost is gone, and so is a slice of the brain development that would have made school easier and adult earnings higher. That’s the quiet tragedy underneath every nutrition statistic in India. The country has grown into the world’s fifth-largest economy, it runs the largest child-nutrition programme on earth, and it still can’t get roughly one in three of its under-five children to grow to a normal height. So this isn’t a story about food shortage. It’s a story about why growth on the GDP chart hasn’t translated into growth on the child’s chart.
That gap is the whole topic. India has the schemes, the budgets, and a real-time digital tracker covering crores of beneficiaries. Yet the headline numbers barely move, one of them moved the wrong way, and the country argues with the world about whether its hunger is even being measured fairly. The hard question is why a problem this well-funded and this well-understood stays this stubborn.
The Issue, Framed
The argument here isn’t whether malnutrition is bad. Everyone agrees it is. The argument is why a country that has cut absolute poverty and scaled up nutrition spending still carries one of the heaviest malnutrition burdens in the world, and what that says about how welfare actually reaches a child.
So let’s fix the vocabulary first, because most confusion on this topic comes from people treating four different things as one. Stunting is low height-for-age, the sign of chronic, long-run undernutrition. A stunted child has been short-changed on nutrition for months or years, and the damage to height and brain is largely permanent. Wasting is low weight-for-height, the sign of acute, recent undernutrition, a child who is dangerously thin right now, often after illness or a sudden food gap. Underweight is low weight-for-age, a blunter measure that mixes both. And anaemia is a shortage of healthy red blood cells, usually from iron deficiency, which leaves a child tired, prone to infection, and slower to learn. Stunting is the scar. Wasting is the emergency. Underweight is the catch-all. Anaemia is the silent drain. They don’t move together, and confusing them is how answers go wrong.
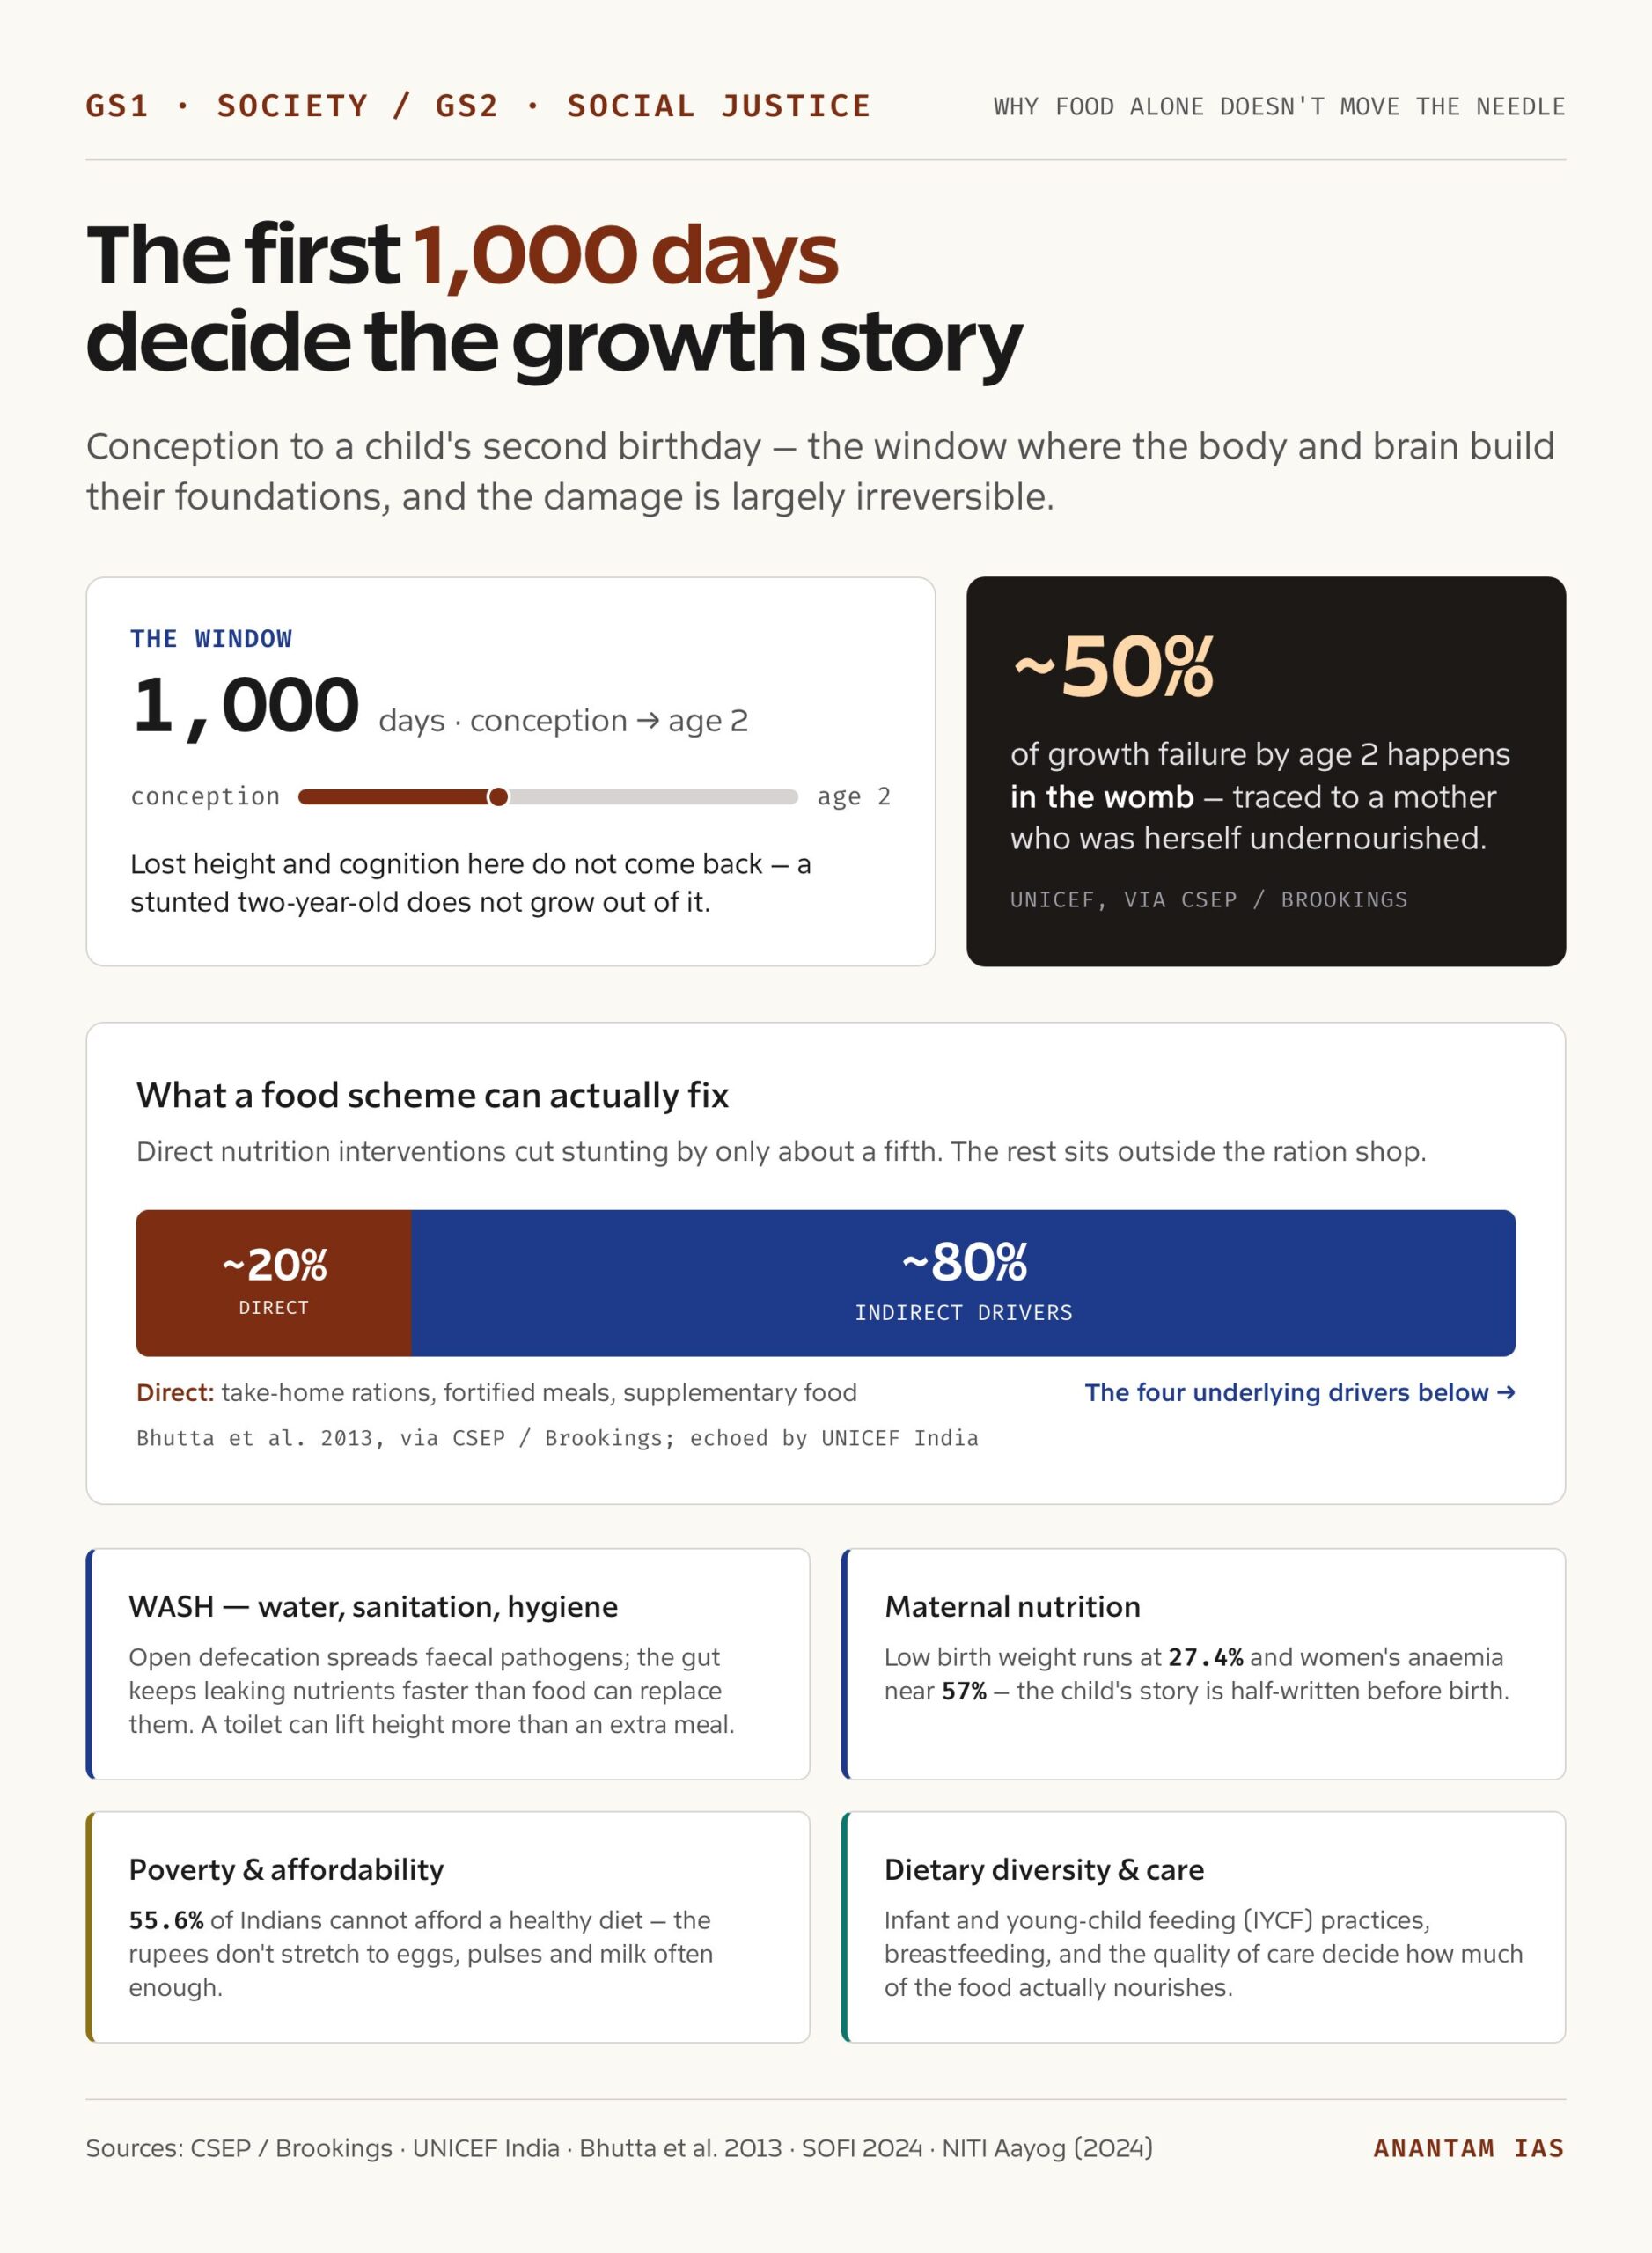
One more idea anchors everything else: the first 1,000 days, the window from conception to a child’s second birthday. This is when the body and brain build their foundations, and damage done here is mostly irreversible. The CSEP-Brookings policy brief, citing UNICEF, puts it starkly: about half of a child’s growth failure by age two happens in the womb, traced back to a mother who was herself undernourished. So a malnourished child is very often the second chapter of a malnourished mother’s story.
And there’s a newer twist the old framing misses. India now carries a double burden of malnutrition, undernutrition and over-nutrition at once, sometimes in the same household. Even as stunting eases, child overweight and a sharp rise in maternal obesity have crept in, an NFHS-5 double-burden analysis on PMC records maternal overweight or obesity climbing from 20.6% to 33.2% between the two surveys. So the target isn’t “more food.” It’s the right nutrition, at the right time, for mother and child both.
A stunted child is a development outcome, not just a health one. And once you see it as lost human capital, the slow pace of progress stops being a health-ministry footnote and becomes a national-growth problem.
What the Data Says
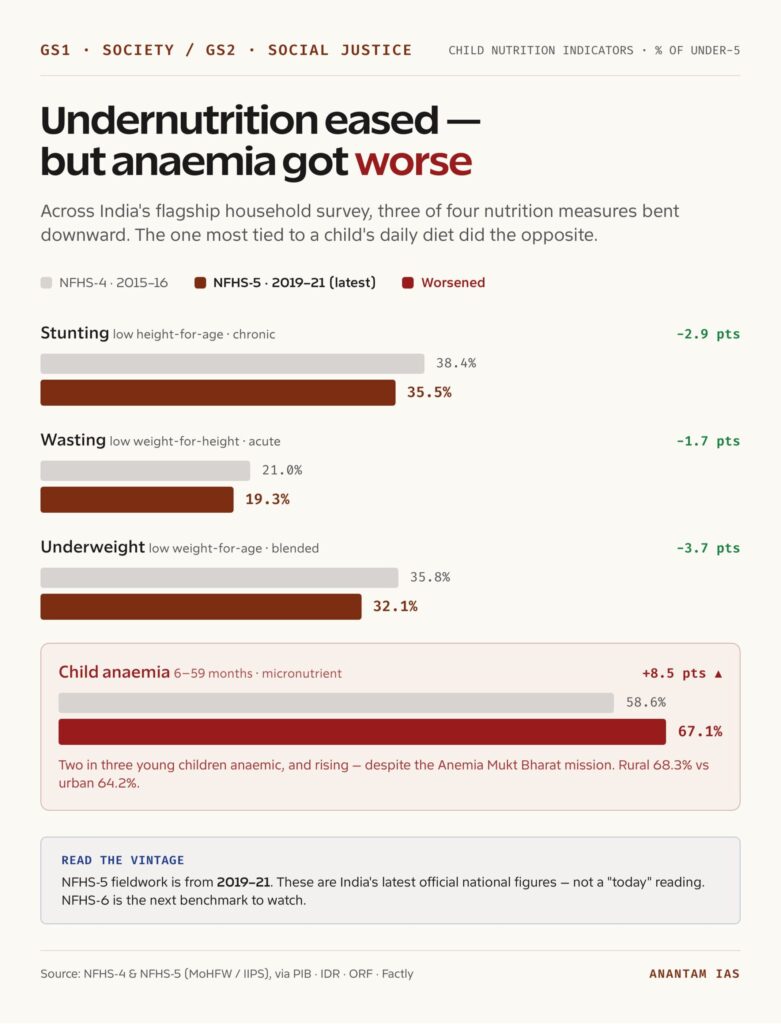
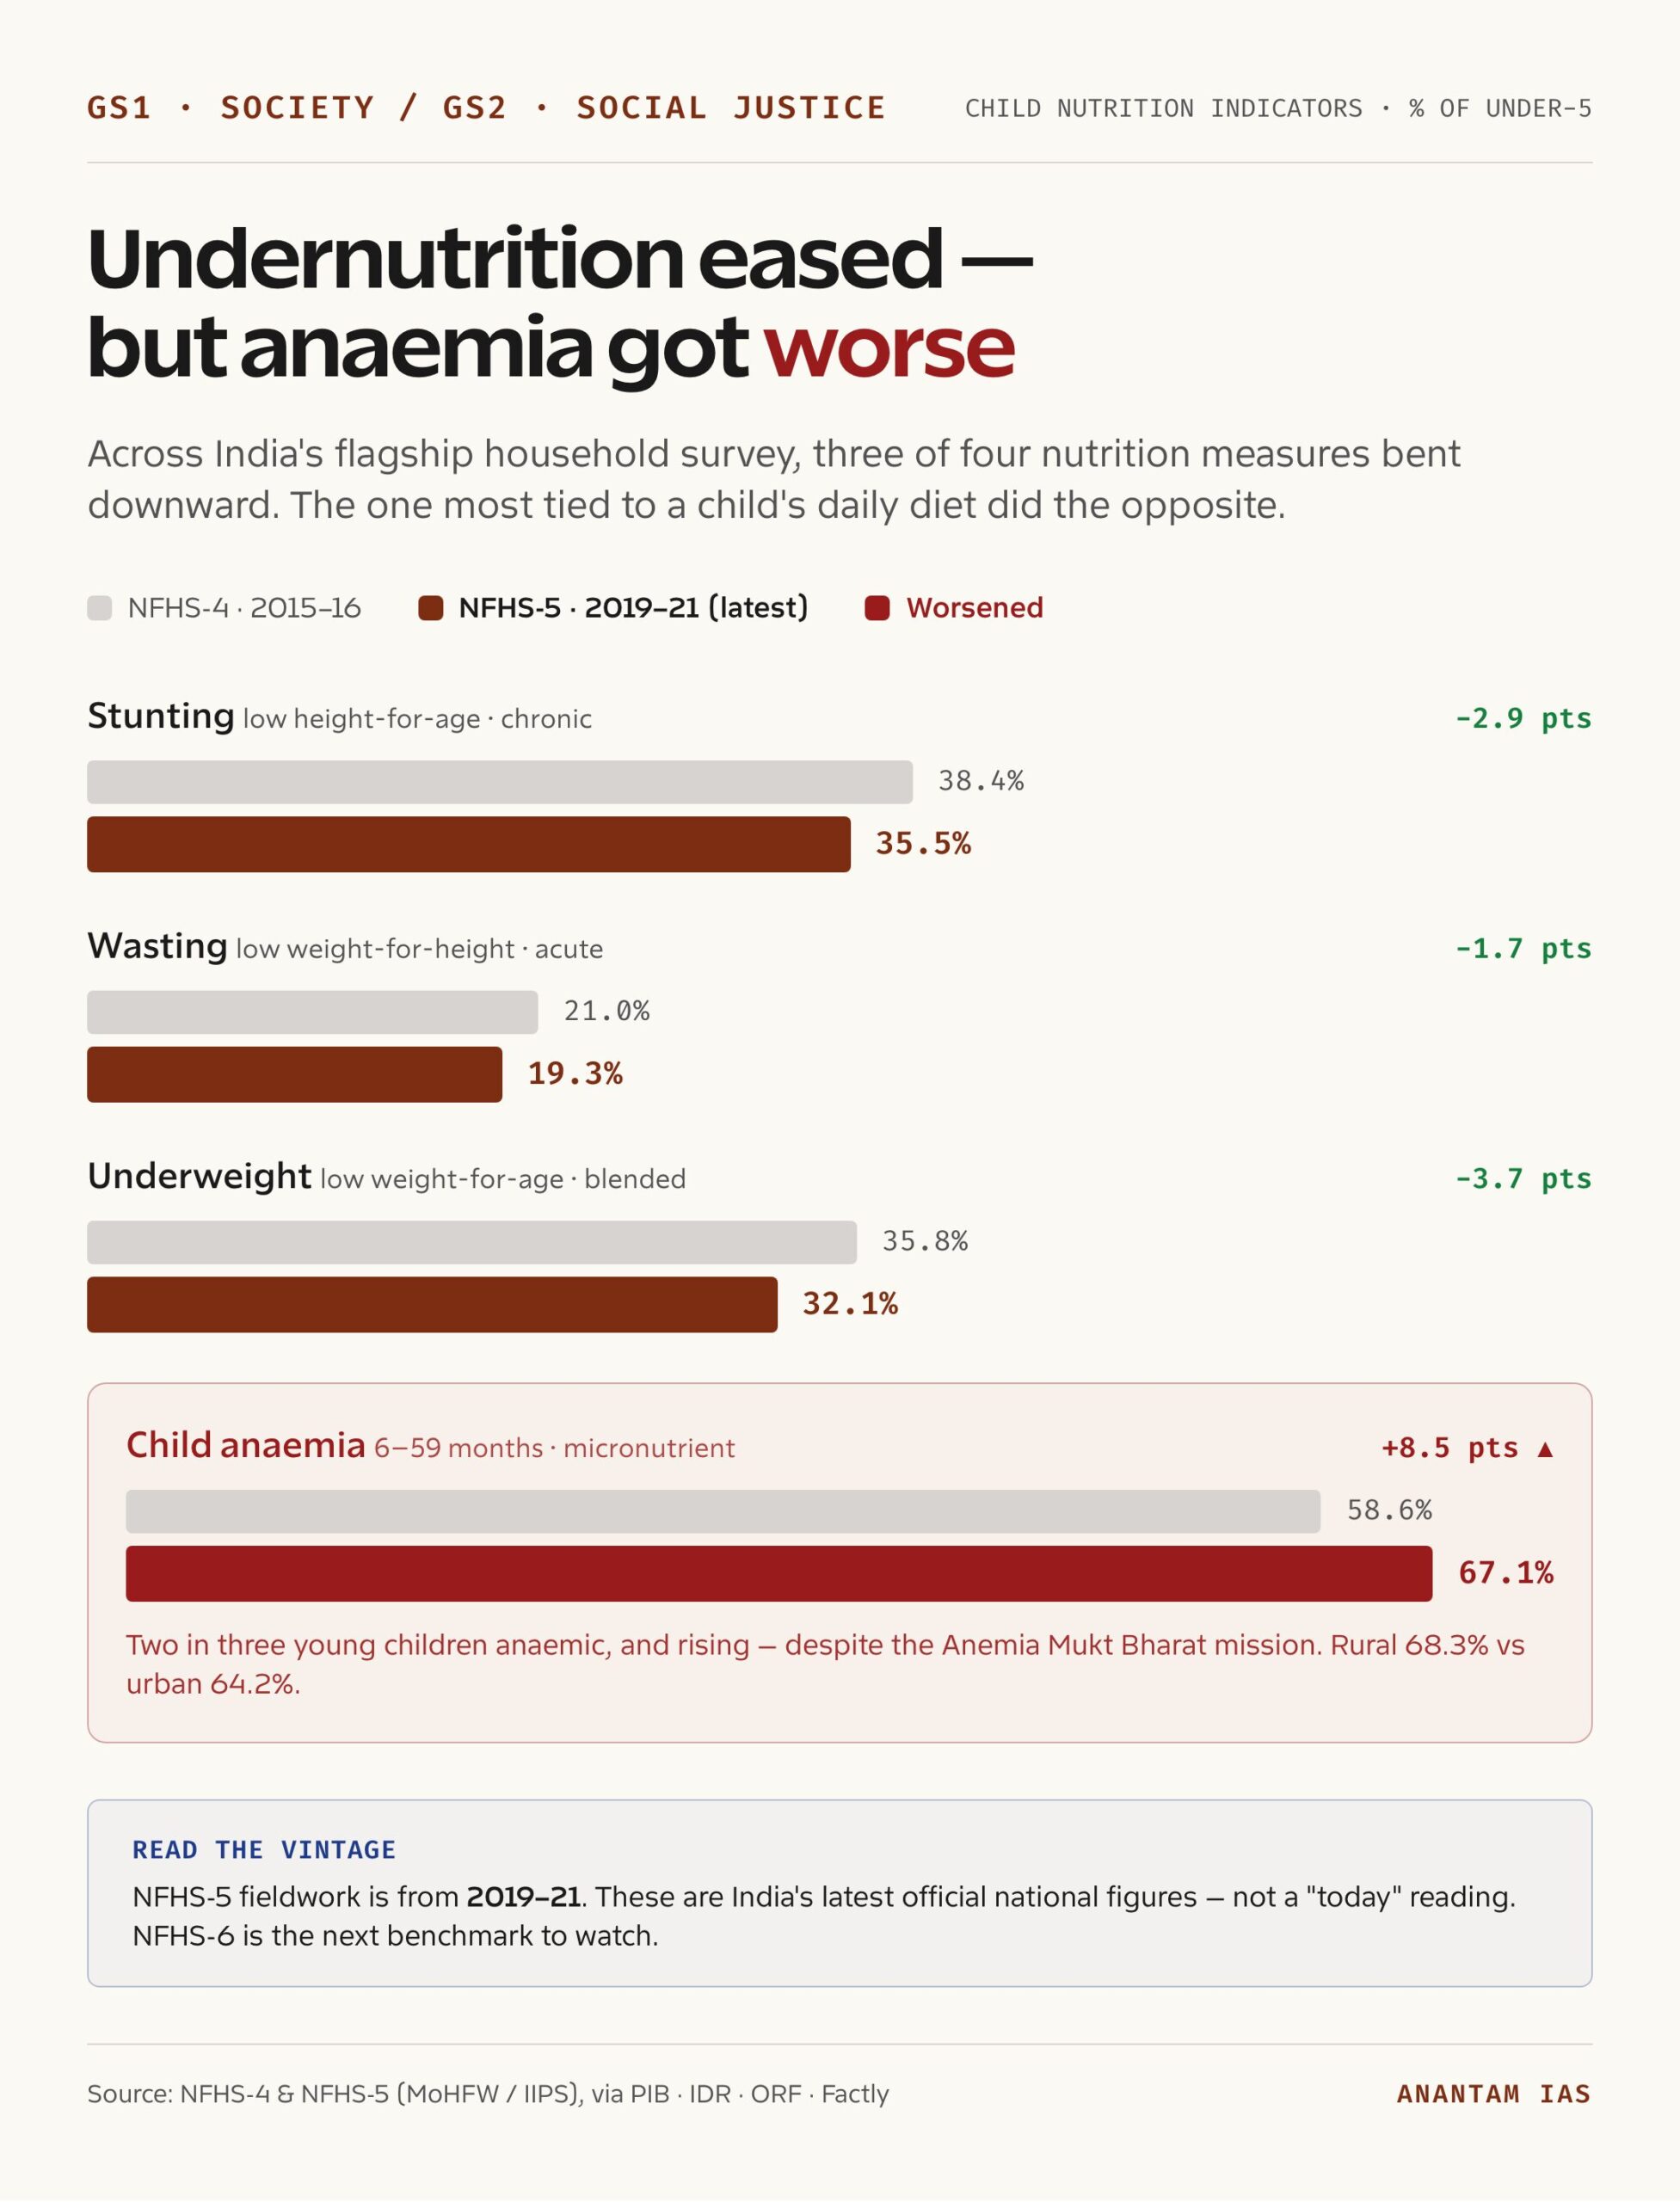
The numbers are where you have to slow down, because India’s nutrition story is genuinely mixed, and an honest answer reports both halves. Start with the National Family Health Survey, the country’s flagship household survey run for the Health Ministry by IIPS. Between NFHS-4 (2015-16) and NFHS-5 (2019-21), every undernutrition indicator moved the right way. Stunting in under-fives fell from 38.4% to 35.5%, wasting from 21.0% to 19.3%, and underweight from 35.8% to 32.1%. So the direction of travel is real. Fewer children are short for their age and dangerously thin than a decade ago.
But read the next line twice, because it’s the one that breaks the good-news story. Child anaemia didn’t fall. It rose, from 58.6% to 67.1% in children aged 6 to 59 months, with rural children worse off (68.3%) than urban (64.2%). Women’s anaemia climbed too, from about 53% to 57% in the 15-to-49 age group. Sit with that. Two in three young Indian children are anaemic, and the number got worse even with a dedicated programme, Anemia Mukt Bharat, running against it. When the one indicator most tied to a mother’s and child’s day-to-day diet moves backward, the “steady progress” framing needs a heavy asterisk.
Here’s a caveat you must carry through the whole answer, and it’s not a quibble. NFHS-5 fieldwork is from 2019 to 2021. As of now, India’s “official” national malnutrition portrait is several years old, gathered around the pandemic. Treat 35.5% stunting and 67% child anaemia as the 2019-21 reading, not as “today’s” number. The next survey round is the benchmark to watch. Quoting old data as current is a classic mistake, and the dated vintage is itself worth a sentence.
Now widen the lens to the absolute scale, because prevalence rates hide how many children that is. The FAO’s State of Food Security and Nutrition in the World (SOFI) 2024 estimates 194.6 million undernourished people in India, about 13.7% of the population, the largest such number of any single country. The same report flags child wasting at 18.7%, the highest prevalence in the world, and low birth weight at 27.4%, among the highest anywhere, which is a direct fingerprint of maternal undernutrition. And 55.6% of Indians can’t afford a healthy diet. So even where the rate improves, the count stays enormous, and the household budget can’t always buy the diet the body needs.
The Case For
The case that India is genuinely improving is stronger than the gloom-merchants admit, and a fair answer states it at full strength before knocking it.
Start with the surveys themselves. Between NFHS-4 and NFHS-5, every undernutrition indicator fell, stunting, wasting, and underweight together. That’s not cherry-picking one lucky number. It’s three measures of chronic and acute undernutrition all bending downward over five years. So the structural trend, on the country’s own gold-standard survey, points the right way.
The long view backs that up, even on a metric the government disputes. The Global Hunger Index trajectory, run by Concern Worldwide and Welthungerhilfe, shows India’s score falling from 38.1 in 2000 to 29.3 in 2016 to 27.3 in 2024 and 25.8 in 2025. Lower is better on the GHI. So by the very index the government calls flawed, India’s hunger has eased over a quarter-century, not worsened. That matters because it means the improvement isn’t just one ministry’s spin.
Then there’s the sheer scale and modernisation of delivery. POSHAN 2.0, formally Mission Saksham Anganwadi and Poshan 2.0, now reaches roughly 10 crore beneficiaries across about 14 lakh Anganwadi Centres, all logged on a real-time Poshan Tracker app, backed by a ₹21,960 crore allocation in the 2025-26 Union Budget. No country runs an early-childhood nutrition network at this scale. And the digital tracker means a growth-monitoring reading can, in principle, be acted on in days rather than discovered in a survey years later.
The policy has also been reframed toward causes, not just calories. POSHAN 2.0 and POSHAN Pakhwada 2025 explicitly centre the levers the evidence supports, maternal nutrition, the first 1,000 days, infant and young-child feeding (IYCF) norms, and community-based management of acute malnutrition (CMAM). So the State has, on paper, stopped treating malnutrition as a food-handout problem and started treating it as a first-1,000-days problem. That’s the right diagnosis.
And convergence with sanitation gives the trend a tailwind. The Swachh Bharat-era toilet push plugs directly into the biggest indirect driver of stunting, a point a NITI Aayog working paper from December 2024 reinforced, arguing that better sanitation cuts malnutrition by reducing gut infection, not just by adding food. So some of the improvement is structural, baked into cleaner water and fewer faecal pathogens, and it should compound over time.
The Case Against
Here’s what the progress story walks past. Slow improvement on a huge base is still a crisis, and on the measures that matter most, India is moving at a pace that fails a generation of children.
Start with the headline itself. Roughly one in three under-five children was still stunted at 35.5% as of NFHS-5, and the fall from 38.4% was under three percentage points over five years. Set that against the original POSHAN Abhiyaan ambition, launched in 2018, to cut stunting to 25% by 2022. The mission aimed for a sprint and the country managed a shuffle. So the gap isn’t between failure and success. It’s between the speed promised and the speed delivered, and that gap is years of lost childhoods.
Then the indicator that went backwards. Child anaemia rose to 67.1% and women’s anaemia to 57%. Two-thirds of young children anaemic, getting worse, despite a national anaemia mission, isn’t a rounding error. It signals that the diet-and-iron part of the system is failing where it’s needed most. You can’t claim a turnaround while the most diet-sensitive number deteriorates.
The absolute burden makes the rates look almost generous. India still carries the world’s highest child-wasting prevalence at 18.7%, 194.6 million undernourished people, and 27.4% low birth weight. And 55.6% can’t afford a healthy diet. So the binding constraint at household level isn’t ignorance of nutrition. It’s that the rupees don’t stretch to eggs, pulses, and milk often enough.
The gains are also deeply uneven, which national averages hide. Zonal and state studies show the East and West zones and the Northeast lagging, with every Northeastern state recording stunting at or above 22%, and rural children carrying more anaemia than urban. So a single national figure flatters the better-off districts and masks the children furthest behind, by caste, wealth, and geography, exactly the average a welfare state shouldn’t rest on.
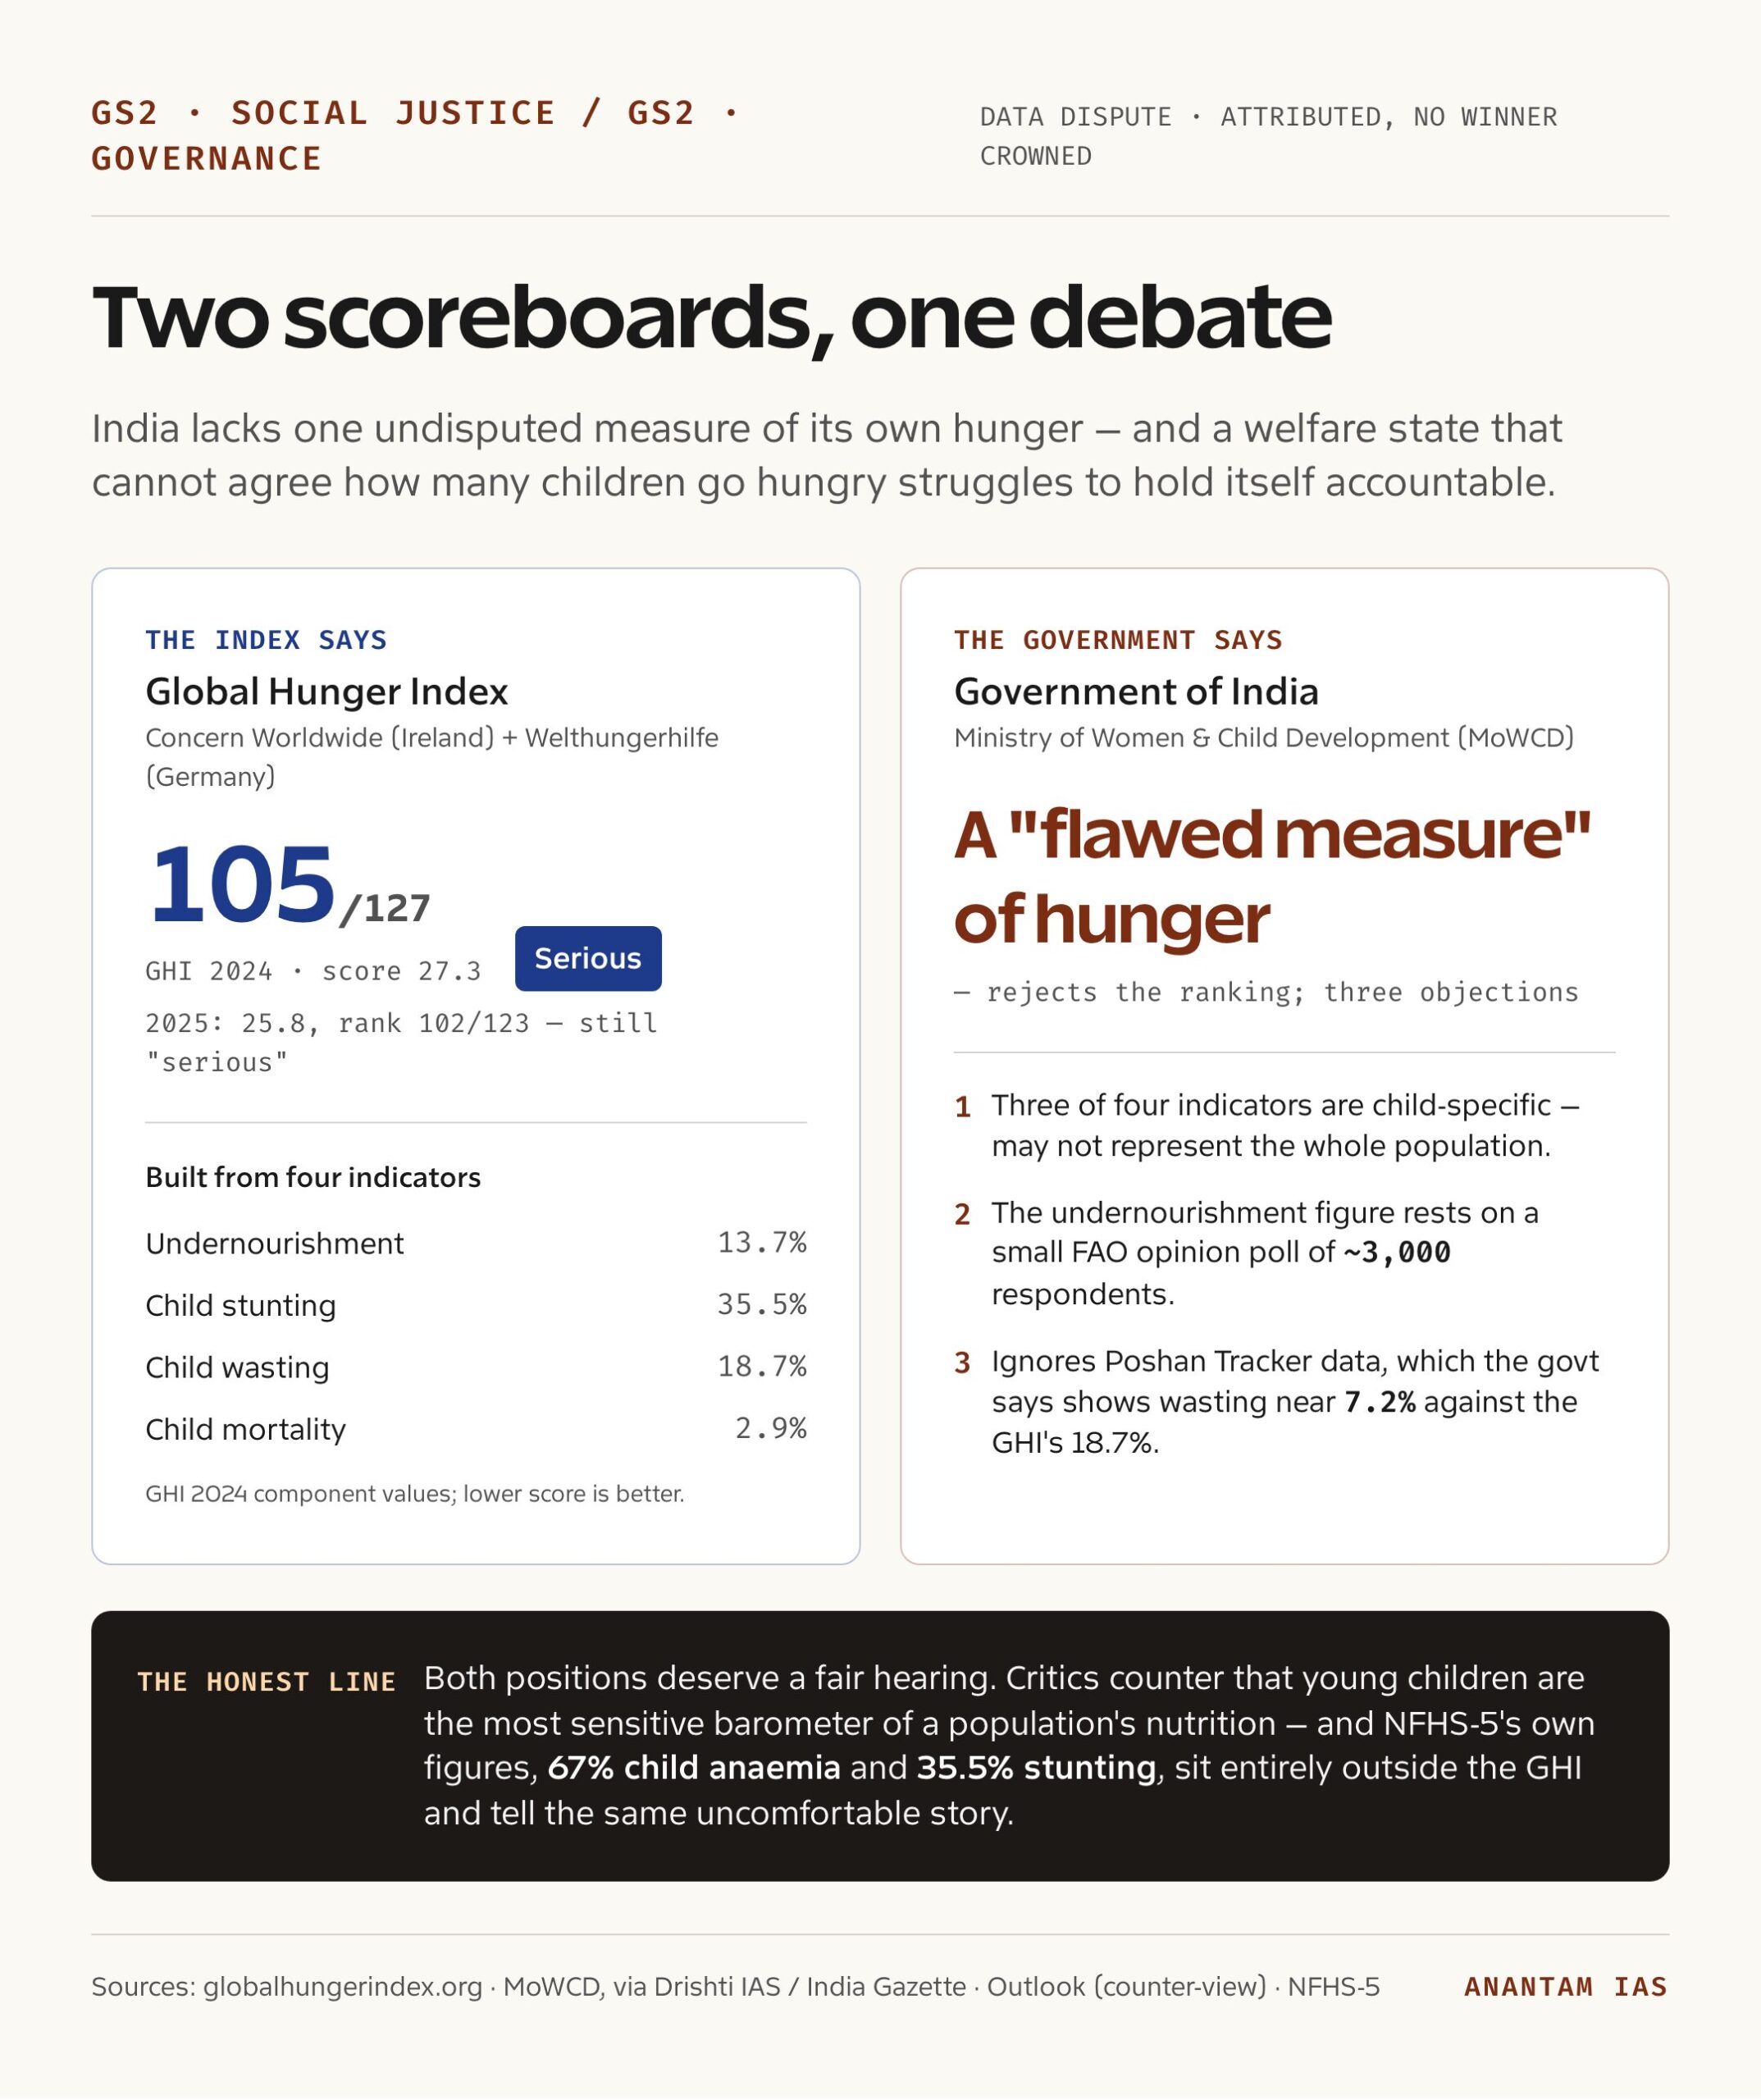
And the scoreboard itself is contested, which is its own problem. The Global Hunger Index has placed India in the “serious” band for years running, 105 of 127 in 2024 (score 27.3) and 102 of 123 in 2025 (score 25.8), below several poorer neighbours. The Ministry of Women and Child Development has rejected the GHI as a “flawed measure,” and its objections deserve a fair hearing: three of the four GHI indicators (stunting, wasting, child mortality) are child-specific and may not represent the whole population; the undernourishment indicator rests on a small FAO opinion poll of roughly 3,000 respondents; and the index ignores Poshan Tracker data, which the government says shows child wasting near 7.2% against the GHI’s 18.7%. But the counter-view is just as serious. Critics, including in Outlook, argue that young children are the most sensitive barometer of a population’s nutrition, so a child-focused index is a feature, not a flaw, and that NFHS-5’s own anaemia and wasting numbers, which sit entirely outside the GHI, tell the same uncomfortable story. So attribute both sides, name both, and refuse to crown a winner. The honest line is that India lacks one undisputed scoreboard, and that itself weakens accountability.
The Deeper Structural Read
Step back from the survey wars and the real fault line shows up. Malnutrition in India isn’t mainly a food-quantity problem. It’s a problem of what reaches the child in the first 1,000 days, and most of what matters never passes through a ration shop.
Start with the single most important finding in the whole field. Direct nutrition interventions, the supplementary food, the take-home rations, the fortified meals, can cut stunting by only about 20%. The other 80% rides on indirect drivers, above all water, sanitation, and hygiene (WASH), plus maternal health and poverty, per the Bhutta 2013 evidence cited in the CSEP-Brookings brief and echoed by UNICEF India. So if you hand a child food but she lives where open defecation spreads faecal pathogens, her gut keeps leaking nutrients faster than the food can replace them. That’s the gut-malabsorption pathway, sometimes called environmental enteropathy, and it’s why a toilet can do more for a child’s height than an extra meal. The NITI Aayog 2024 paper makes exactly this argument.
Which reframes the whole flagship architecture. The Anganwadi system, ICDS, PM POSHAN mid-day meals, these are the visible 20%. They’re necessary and they shouldn’t be cut. But a State that pours money into the visible fifth while the invisible four-fifths, clean water, sanitation, a well-nourished mother, household income, lag behind will keep wondering why the stunting needle barely moves. So the issue isn’t that the schemes are wrong. It’s that nutrition has been run as a food-delivery problem when it’s really a convergence problem.
And convergence is exactly where Indian governance is weakest. Cutting child stunting needs Women and Child Development, Health (MoHFW), Jal Shakti (water and sanitation), and Education to pull in the same direction in the same district at the same time. Each runs its own scheme, its own budget, its own targets. The child who needs all four at once falls through the seams between four ministries. So the deepest problem here is administrative, not nutritional: a vertically siloed State trying to fix a horizontally connected problem.
There’s an intergenerational loop underneath, too, and it’s the part that should bother a future administrator most. An anaemic, undernourished adolescent girl becomes an undernourished mother, who delivers a low-birth-weight baby, who is stunted by age two, who grows into the next undernourished mother. That 27.4% low birth weight figure and the 57% women’s anaemia rate aren’t separate problems from child stunting. They’re its upstream cause. So you can’t fix the child without fixing the mother first, which is precisely why POSHAN 2.0’s pivot to maternal nutrition is the right instinct, even if the results haven’t shown yet.
And the data dispute is structural, not a side-show. When the survey says wasting is 18.7% and the administrative tracker says it’s nearer 5 to 7%, India is effectively running without an agreed scoreboard. The two don’t measure the same thing the same way, so you can’t reconcile them by picking the lower number. But a welfare state that can’t say how many of its children are wasting can’t hold itself accountable for fixing it. So building one credible, comparable measurement system is itself a reform.
What Should Be Done
So what does a serious fix look like? Not a louder version of the current scheme, but a sharper one, built around the causes the evidence supports. Seven moves, each anchored to a number above.
- Make the first 1,000 days the organising principle of every scheme. Conception to age two, where about half of stunting originates in the womb and the damage is largely irreversible, is the window where a rupee buys the most. So welfare schemes for vulnerable sections should be re-weighted toward pregnant women, lactating mothers, and infants, not spread thinly across every age band.
- Treat maternal nutrition and low birth weight as the upstream fix. With low birth weight at 27.4% and women’s anaemia at 57%, the child’s growth story is half-written before birth. So scale supplementary nutrition, iron-folic-acid and calcium supplements, deworming, and anaemia treatment for adolescent girls and pregnant women, the cohort POSHAN 2.0 already names but hasn’t yet moved.
- Converge WASH with nutrition, deliberately, district by district. Since roughly 80% of stunting reduction depends on indirect drivers, the Swachh Bharat sanitation push and the Jal Jeevan Mission safe-water rollout need to be planned together with POSHAN, not in parallel silos. So a child’s village should get the toilet, the tap, and the take-home ration as one package, because the food does little while the gut keeps leaking.
- Attack anaemia head-on, because it’s the one that worsened. Child anaemia at 67% is the clearest failure on the board. So strengthen Anemia Mukt Bharat with point-of-care haemoglobin testing, dietary diversification, and food fortification, and measure it like the emergency it is.
- Buy Anganwadi quality, not just Anganwadi infrastructure. LED screens and nutri-gardens look good in a photo, but a child grows on worker training, honest growth-monitoring, and decent take-home ration quality. So spend the next rupee on the worker and the weighing scale, not the signage.
- Make a healthy diet affordable, not just available. When 55.6% can’t afford a healthy diet, pair PM POSHAN mid-day meals and the PDS with eggs, millets, and pulses, plus real behaviour-change communication on infant feeding. So the household budget stops being the thing that decides whether a child eats protein.
- Fix the measurement dispute and publish one credible scoreboard. Reconcile the NFHS survey method and the Poshan Tracker administrative data, document where they differ, and publish comparable numbers. So progress can be audited by anyone, and the GHI fight stops being a distraction from the children behind the numbers.
Every one of these strengthens the mission rather than scrapping it. POSHAN 2.0 has the right diagnosis and the wrong centre of gravity, too much weight on the visible 20%, too little on the invisible 80%. Shift that balance, and the needle should finally move.
For Your Mains Answer
This topic is a GS1-GS2 crossover that examiners love, because it lets you connect society, human capital, welfare design, and governance in one frame.
GS paper mapping: GS1: population and associated issues, poverty and developmental issues, social empowerment, women’s and children’s welfare. GS2: government policies and interventions for vulnerable sections, the health and nutrition social sector, welfare-scheme performance, and inter-ministerial convergence.
Likely question frames:
- Despite strong economic growth and large flagship schemes, child malnutrition in India remains stubbornly high. Critically examine the causes and suggest a way forward.
- “Malnutrition is a human-capital problem, not merely a health problem.” Discuss in the context of India’s stunting and anaemia burden.
- Examine the debate between the Global Hunger Index and the Government of India, and what it reveals about India’s nutrition data architecture.
Quotable data points:
- More than one in three under-five children stunted, 35.5% (NFHS-5, 2019-21), down only from 38.4% in NFHS-4.
- Child anaemia rose from 58.6% to 67.1%; women’s anaemia from about 53% to 57%, the indicators that worsened.
- Wasting 19.3% and underweight 32.1% (NFHS-5); India records the world’s highest child-wasting prevalence at 18.7% (SOFI 2024).
- 194.6 million undernourished (13.7%), the largest count of any country; 55.6% can’t afford a healthy diet (SOFI 2024).
- Low birth weight 27.4%, among the highest globally, the upstream fingerprint of maternal undernutrition (SOFI 2024).
- GHI 2024: 27.3, rank 105/127, “serious”; GHI 2025: 25.8, rank 102/123, while the government rejects the index as a “flawed measure.”
- About 50% of growth failure by age two happens in the womb (UNICEF, via CSEP); direct interventions cut stunting only about 20%, the other 80% rides on WASH and indirect drivers (Bhutta 2013, via CSEP).
- POSHAN 2.0 reaches about 10 crore beneficiaries across roughly 14 lakh Anganwadi Centres, backed by ₹21,960 crore in 2025-26 (DD News / IMPRI).
Keywords to use: stunting, wasting, underweight, anaemia, first 1,000 days, low birth weight, IYCF, double burden of malnutrition, WASH, gut malabsorption, human-capital formation, convergence, POSHAN 2.0.
Syllabus linkages: poverty and hunger, population and human-resource quality, social empowerment, welfare schemes for vulnerable sections, the health and nutrition sector, inter-ministerial coordination, data transparency and accountability.
Balanced conclusion line: India has built the largest nutrition delivery system in the world and still can’t make one in three of its children grow to a normal height; the fix isn’t more food alone but the right nutrition in the first 1,000 days, delivered through a State that finally makes water, sanitation, maternal health, and food converge on the same child.
How to Build the Answer
Open with the paradox, not a definition. The hook is that a fast-growing economy with the world’s largest child-nutrition programme still can’t shift one-in-three stunting. That single sentence signals you’ve grasped the real tension, growth on the GDP chart versus growth on the child’s chart. A crisp definition of stunting can follow in the second sentence, not the first.
Bring data in early and make it earn its place. A strong opening body paragraph can carry three figures: 35.5% stunting, child anaemia rising to 67%, and 194.6 million undernourished. Then say what each proves. The examiner rewards the move from number to inference, the “this means” after the figure, far more than the figure alone.
Steelman both sides before you judge. If you argue India is failing, first concede that every undernutrition indicator fell on NFHS and the GHI trend is downward. If you argue India is improving, first admit anaemia rose and the absolute burden is the world’s heaviest. An answer that grants the other side two honest lines reads balanced without going vague.
Group the way forward, don’t scatter it. Cluster the reforms around causes, first 1,000 days, maternal nutrition, WASH convergence, anaemia, Anganwadi quality, affordability, measurement, and tag each to an actor (WCD, Health, Jal Shakti, Education). Use the topic’s own vocabulary, double burden, convergence, human capital, so the answer reads like development analysis, not a news recap.
Close on judgment, not summary. The last line should show you can hold two truths at once, that the system is real and the results are slow, and resolve them with a principle. The reliable pattern is “the fix isn’t X alone, but X done right at the right time,” which lets you balance scale against speed without sounding like you’re hedging.
Common Mistakes to Avoid
- Don’t treat NFHS-5 as current. Its fieldwork is 2019-21. Say so. Quoting it as “today’s” picture is the single easiest way to lose credibility on this topic.
- Don’t collapse stunting, wasting, and anaemia into “malnutrition.” They measure different things, chronic, acute, and micronutrient. An examiner can tell instantly whether you know the difference.
- Don’t pick a side in the GHI fight. Attribute the rank to the GHI publishers and the rejection to the MoWCD, note the counter-argument, and move on. Crowning a winner makes the answer look partisan.
- Don’t write a food-supply answer. The 20-80 finding is the whole point, most of stunting reduction sits outside the food basket. Miss it and your “way forward” will be all rations and no sanitation.
- Don’t forget the mother. Low birth weight and women’s anaemia are upstream causes, not separate issues. Name the adolescent girl and the pregnant woman, because UPSC rewards an answer that says who bears the cost.
A Compact Answer Spine
- Introduction: Open with the growth-versus-stunting paradox in one sentence; define stunting and the first 1,000 days in the next.
- Evidence: Use three attributed figures, 35.5% stunting, 67% child anaemia (worsened), and the 20-80 driver split, each tied to an implication.
- Arguments: The case that India is improving (all undernutrition indicators fell, GHI trend down, scheme scale), then the case that it’s too slow and uneven (anaemia up, world’s highest wasting count, regional gradients).
- Structural diagnosis: Malnutrition is a first-1,000-days and convergence problem; 80% of the fix sits outside food delivery, in WASH, maternal health, and income.
- Way forward: Six to seven grouped reforms, each with a clear actor, WCD, Health, Jal Shakti, Education.
- Conclusion: Adapt the balanced conclusion line to the exact question wording.
Diagram or Flowchart Idea
For a 15-marker, draw the intergenerational cycle as a loop, not a decorative mind map: undernourished adolescent girl → undernourished mother → low birth weight baby → stunted child by age two → back to undernourished adolescent. One arrow back to the start makes the whole self-perpetuating trap legible in five seconds, and it justifies the maternal-nutrition focus instantly.
For a 10-marker, skip the diagram and use a two-column table instead: “What schemes deliver (the visible 20%)” against “What decides outcomes (the invisible 80%, WASH, maternal health, income).” It does more analytical work than a sketch and is faster to evaluate under time pressure.
Ethics and Governance Angle
Add one ethical line even in a policy-heavy answer. Malnutrition isn’t just inefficiency, it’s a question of who bears the cost when a well-funded system underperforms. Here that cost is a concrete person: the stunted child who’ll earn less for life, the anaemic adolescent girl, the low-birth-weight baby of an undernourished mother. Naming that citizen sharpens the answer and shows you see the human behind the indicator.
Then convert empathy into design. Don’t just say “protect vulnerable children.” Say how, target the first 1,000 days, converge WASH with nutrition, fix maternal anaemia, buy Anganwadi quality over signage. That move, from moral language to administrative specifics, is the difference between a slogan and governance maturity.
A sentence pattern that travels across welfare topics: “The scheme is legitimate in aim, but its impact depends on convergence, targeting, and the quality of last-mile delivery.” It credits the State’s intent without handing it a pass on results, which is exactly the balance an examiner wants on a welfare question.
How to Use Data Without Sounding Mechanical
Use fewer numbers than you know. Three well-explained figures beat ten scattered ones. Lead with one big number (35.5% stunting, the national scale), use a second for contrast (child anaemia rising to 67%, the one that worsened), and use a third to justify the structural argument (the 20-80 split between direct and indirect drivers). One scale figure, one contrast, one cause is usually enough.
Never leave a statistic standing alone. Follow it with “this means” or “the policy implication is.” That small move turns a fact sheet into analysis. In Mains, the figure is raw material and the judgment is the finished answer.
Attribute as you go, lightly. “35.5% stunting (NFHS-5)” or “world’s highest wasting count (SOFI 2024)” signals rigour without clutter. And flag the vintage once, NFHS-5 is 2019-21, so the examiner sees you know the data’s age. That single caveat reads as maturity, not weakness.
One last sweep: cut any sentence that sounds impressive but does no work, and replace it with a fact, a cause, a consequence, or a reform. That habit separates an answer that feels informed from one that feels memorised. Write for marks, not for noise, and always be specific about who gains and who’s at risk.
FAQ
What is the difference between stunting, wasting, and underweight?
Stunting is low height-for-age and signals chronic, long-run undernutrition, the kind that’s largely irreversible after the first 1,000 days. Wasting is low weight-for-height and signals acute, recent undernutrition, a child dangerously thin right now. Underweight is low weight-for-age, a blunter measure that mixes both. NFHS-5 (2019-21) put under-five stunting at 35.5%, wasting at 19.3%, and underweight at 32.1%.
Why did anaemia rise in India even as other indicators improved?
Between NFHS-4 and NFHS-5, child anaemia (6 to 59 months) rose from 58.6% to 67.1% and women’s anaemia from about 53% to 57%, even with the Anemia Mukt Bharat programme running. Anaemia tracks day-to-day dietary iron, affordability, and absorption closely, so it can worsen while chronic stunting eases. With 55.6% of Indians unable to afford a healthy diet (SOFI 2024), the diet-and-iron part of the system is where the failure shows.
What is the Global Hunger Index debate about?
The GHI, run by Concern Worldwide and Welthungerhilfe, placed India in the “serious” band, 105/127 in 2024 and 102/123 in 2025. The Government of India (MoWCD) rejects it as a “flawed measure,” arguing three of four indicators are child-specific, the undernourishment figure rests on a small opinion poll, and the index ignores Poshan Tracker data. Critics counter that children are the most sensitive barometer of population nutrition, and that NFHS-5’s own anaemia and wasting numbers tell the same story independently. Both positions should be attributed, not merged.
Why are the “first 1,000 days” so important?
The first 1,000 days run from conception to a child’s second birthday, the window when the body and brain build their foundations and damage is largely permanent. About half of a child’s growth failure by age two happens in the womb, traced to a mother who was herself undernourished (UNICEF, via CSEP). That’s why low birth weight (27.4%) and women’s anaemia (57%) are upstream causes of child stunting, and why fixing the mother’s nutrition comes before fixing the child’s.
Tell Google you want more of this.
Add Anantam IAS as a preferred sourceOne tap, and this site shows up more often in your own Top Stories, AI Overviews and AI Mode. Remove it any time.