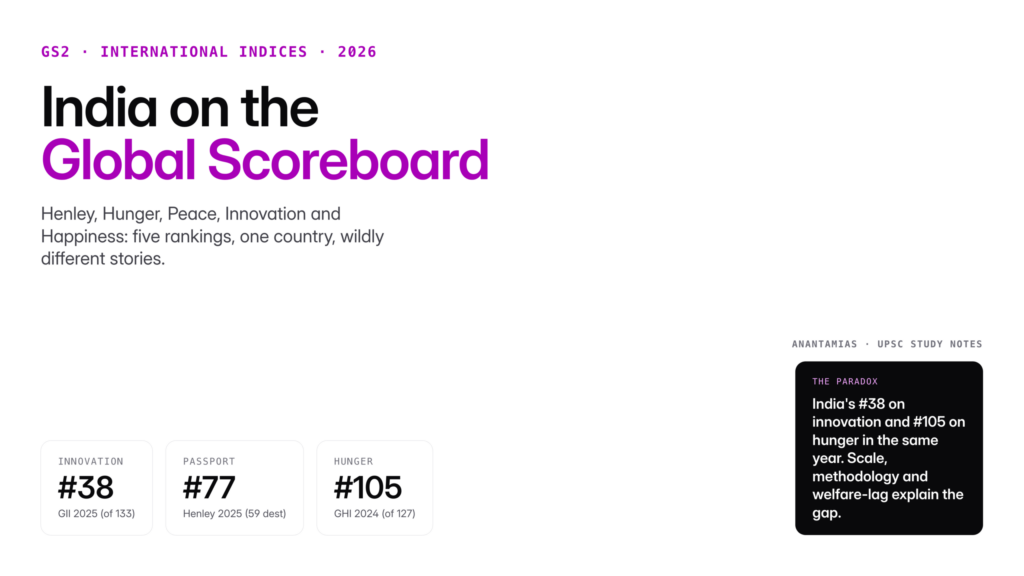
As of 2026, India ranks 127th of 163 on the Global Peace Index, 75th on the Henley Passport Index (with visa-free or visa-on-arrival access to 56 destinations), 102nd of 123 on the 2025 Global Hunger Index, 38th of 139 on the 2025 Global Innovation Index, and 116th of 147 on the 2026 World Happiness Report. These are the latest figures across the five most-cited global indices. India’s peace ranking fell sharply from 115th in 2025, while its passport strength improved (up from 85th in 2025) and its happiness score edged up from 118th. The sections below explain who compiles each index, what it measures, and why India’s ranks diverge so widely.
Introduction
Every year, a clutch of international rankings assesses countries on themes as varied as passport strength, hunger, peace, innovation and happiness. For India, these indices are a staple of Prelims current affairs and a frequent Mains reference point on governance, diplomacy and development. Some are celebrated; some are contested. Almost all of them spark cabinet-level responses and media debate.
This explainer consolidates India’s 2025 and early 2026 ranks on the five most cited global indices. It also explains what each index measures, who compiles it, how the methodology works and what the numbers mean for UPSC answers. Read it as a single reference sheet before exam day rather than chasing five separate news stories.
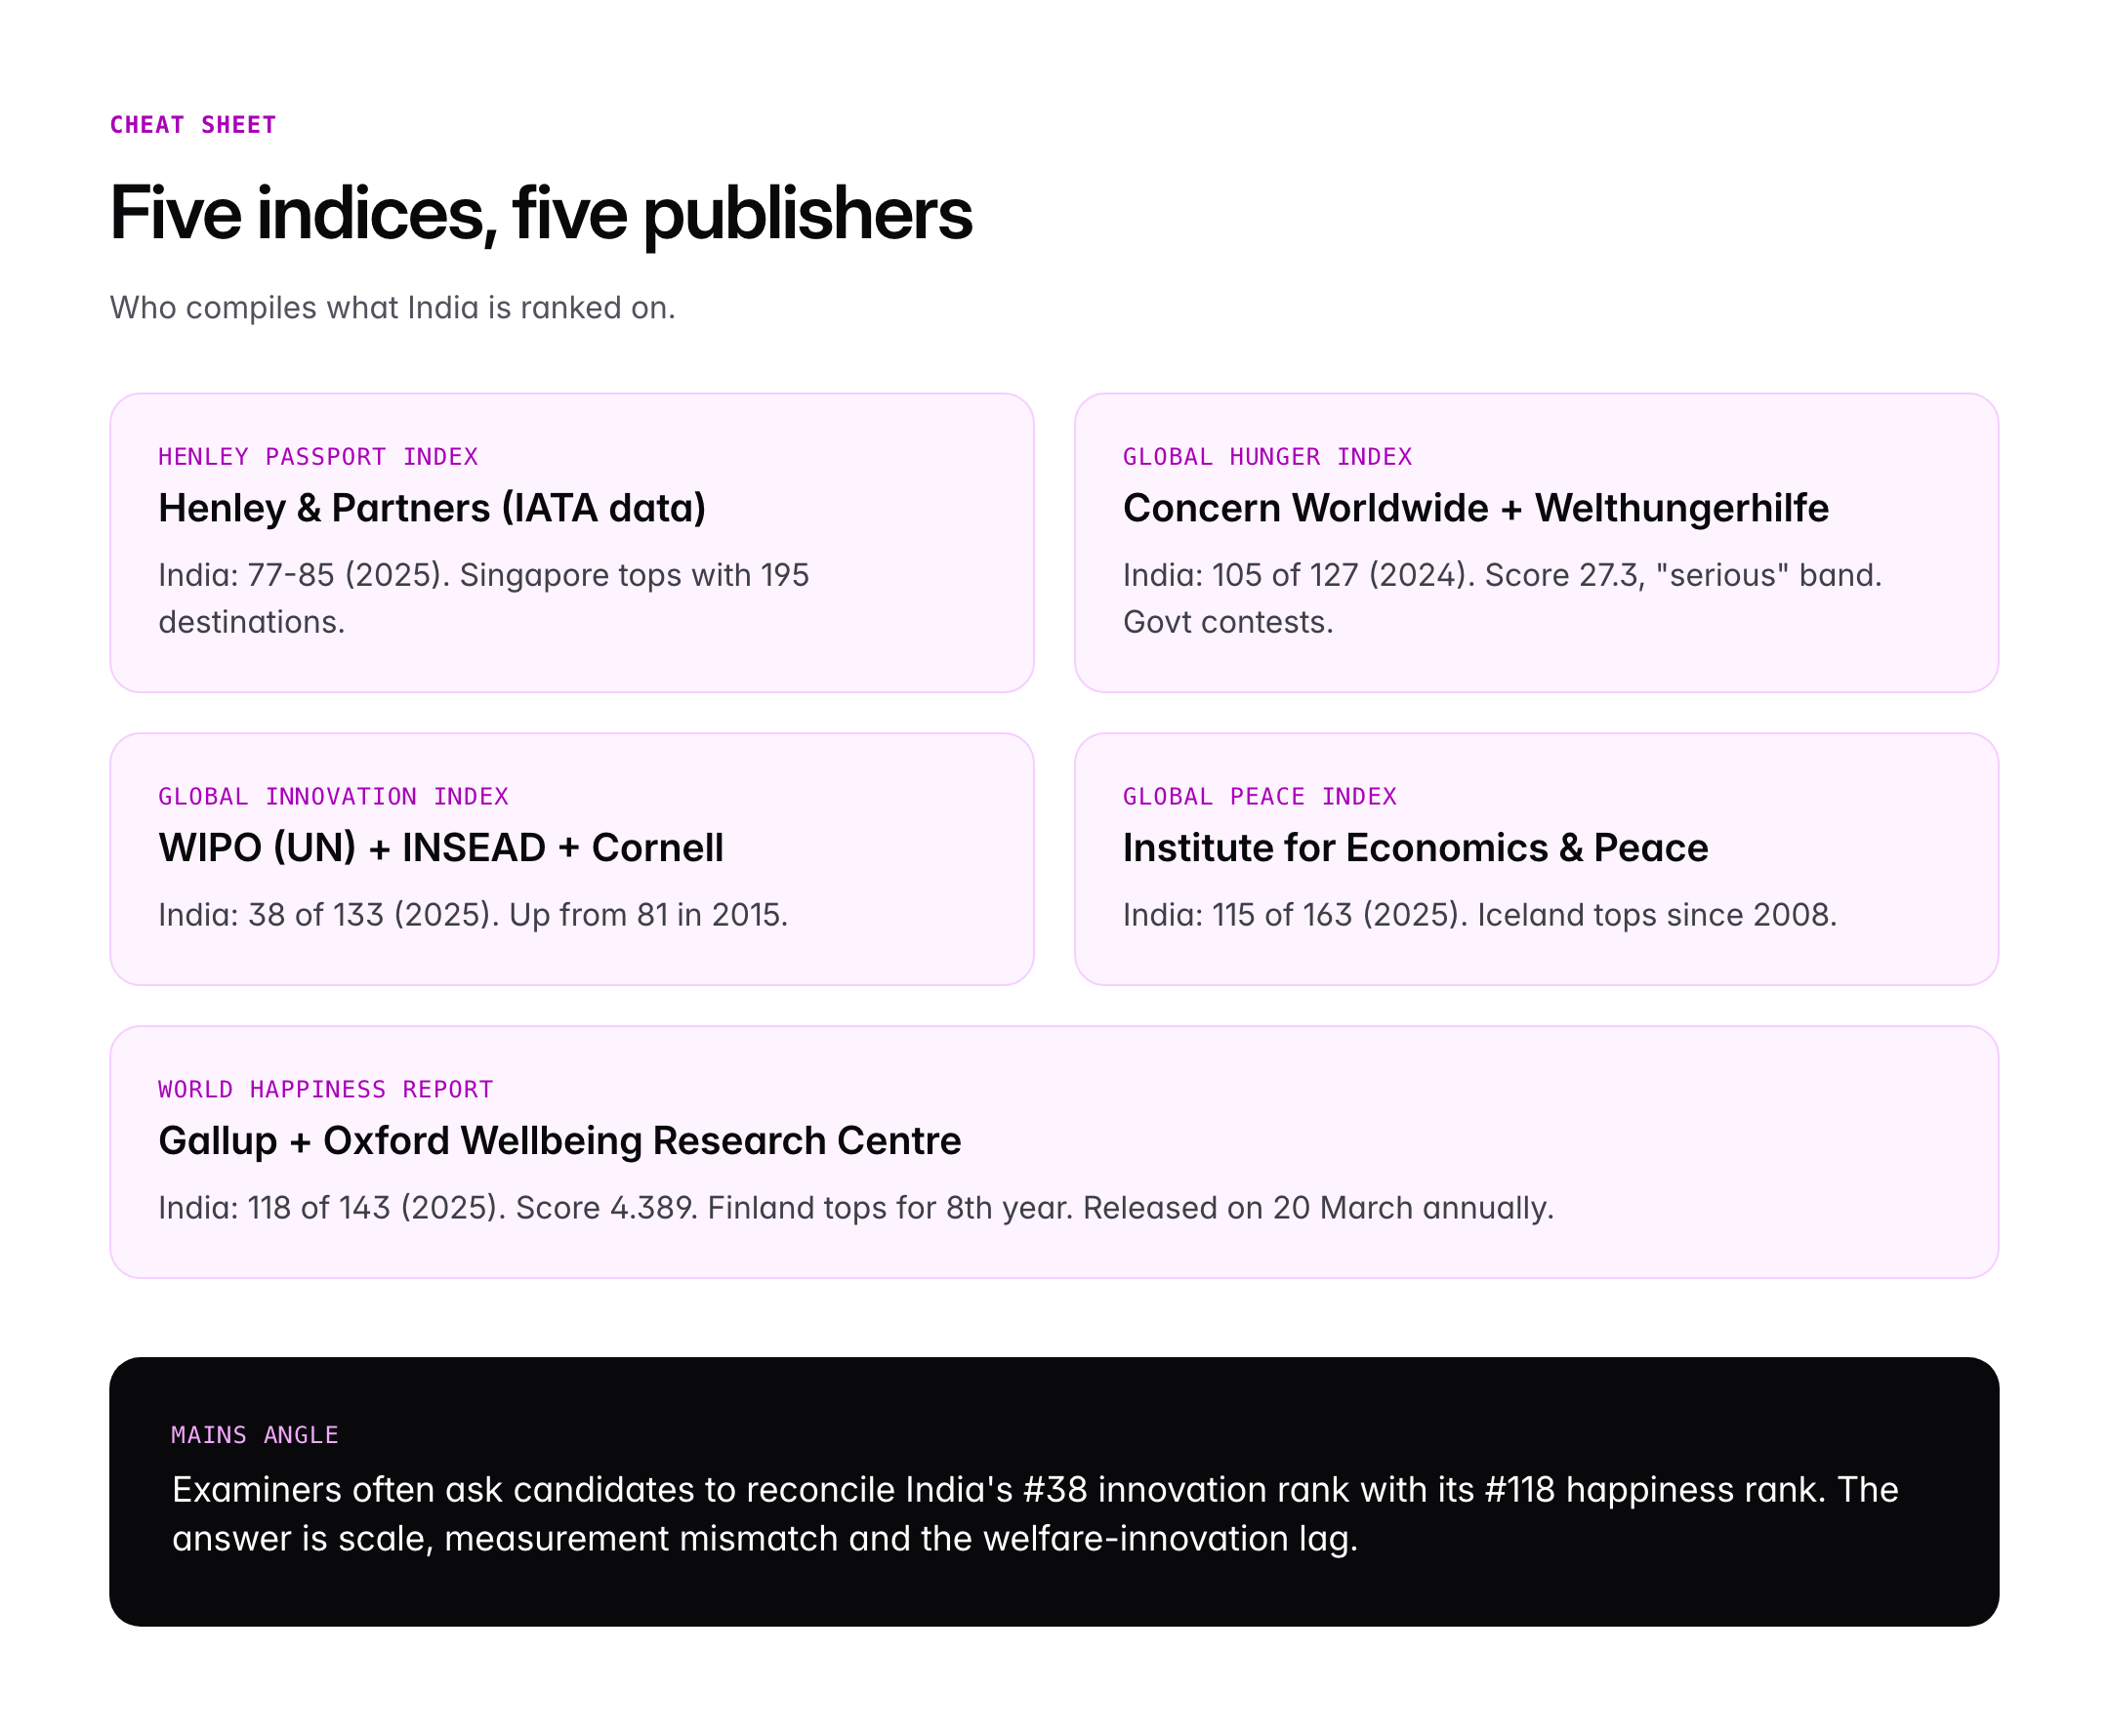
Quick Facts at a Glance
| Index | Latest India Rank | Compiling body | Score |
|---|---|---|---|
| Henley Passport Index 2026 | 75 (up from 85 in 2025) | Henley & Partners (IATA data) | Visa-free/VoA access to 56 destinations |
| Global Hunger Index 2025 | 102 out of 123 | Concern Worldwide + Welthungerhilfe | 25.8 (serious) |
| Global Innovation Index 2025 | 38 out of 139 | WIPO | Climbed from 81 in 2015 |
| Global Peace Index 2026 | 127 out of 163 | Institute for Economics & Peace | Fell from 115 in 2025 |
| World Happiness Report 2026 | 116 out of 147 | Gallup + Oxford Wellbeing Centre | 4.536 on a 10-point scale |
Background and Historical Context
International ranking of nations is not new. The UN Human Development Index was launched by Pakistani economist Mahbub ul Haq in 1990. The World Bank’s Doing Business rankings began in 2004 and were retired in 2021 after a data-rigging scandal. The current crop of indices emerged mostly between 2005 and 2012, driven by think tanks, consultancies and UN agencies looking to benchmark policy outcomes that GDP alone cannot capture.
India entered these rankings in an era of rapid policy activism. Between 2015 and 2020 it climbed 40 places on the Global Innovation Index and 79 places on the old Ease of Doing Business list. However, its rank on welfare-oriented indices such as Hunger, Peace and Happiness has been more static, prompting government objections on methodology. The Ministry of External Affairs has periodically rejected the Global Hunger Index, calling it “an erroneous measure” that uses three out of four indicators limited to children and draws on small samples.
Two global shifts have shaped the 2024–25 numbers. First, the post-COVID recovery surfaced sharp inequalities in nutrition and mental health, pushing welfare rankings downward for large populous nations. Second, geopolitical realignments after the Russia–Ukraine war and the 2023 Israel–Hamas conflict pulled down the Global Peace Index for most countries, making India’s fall look less severe in comparative terms. Third, Gulf diplomatic breakthroughs, especially UAE’s Abu Dhabi Declaration of 2023, opened visa-free doors for Indian passport holders.
Key Features of Each Index
Henley Passport Index
The Henley Passport Index is published by the London-based citizenship-advisory firm Henley & Partners. It uses IATA (International Air Transport Association) data to rank 199 passports by the number of destinations their holders can enter without a prior visa or with visa-on-arrival. In the 2026 index, Singapore topped the ranking with visa-free access to 192 destinations. India climbed to 75th place with access to 56 destinations, a jump of ten positions from 85th in 2025, sharing the rank with Côte d’Ivoire, Gabon, Madagascar and Mauritania. It has a sub-index for “investment migration” that is less relevant for UPSC.
Global Hunger Index (GHI)
Published by Concern Worldwide and Welthungerhilfe, the GHI uses four indicators: undernourishment, child stunting, child wasting and child mortality. Scores fall on a 100-point scale where 0 is best. In the 2025 edition (released October 2025), India scored 25.8 and ranked 102 out of 123 countries, an improvement from 27.3 the previous year but still in the “serious” hunger band. India’s child wasting rate, at 18.7 per cent, remains the highest in the report. The Indian government has contested the methodology, arguing that three of the four indicators are specific to children under five.
Global Innovation Index (GII)
The GII is compiled by the World Intellectual Property Organization (WIPO), a UN agency, in partnership with INSEAD and Cornell. It tracks 80 indicators across seven pillars: institutions, human capital, infrastructure, market sophistication, business sophistication, knowledge and technology outputs, and creative outputs. India ranked 38 out of 139 economies in the 2025 edition, up from 39 in 2024 and 81 in 2015, retaining its position as the top-ranked economy in Central and Southern Asia. India leads the world on ICT services exports and among lower-middle-income economies on knowledge and technology outputs.
Global Peace Index (GPI)
The Institute for Economics and Peace, a Sydney-based think tank, publishes the GPI using 23 indicators in three domains: ongoing conflict, societal safety and security, and militarisation. India ranked 127 out of 163 in the 2026 edition, a sharp fall from 115th in 2025 following a 2.9 per cent decline in its peacefulness score. Iceland has topped the index every year since 2008. The GPI flagged India’s border tensions with Pakistan and Myanmar and the ethnic violence in Manipur as pull-down factors.
World Happiness Report (WHR)
Published annually on 20 March (International Day of Happiness) by the Gallup World Poll and Oxford Wellbeing Research Centre, the WHR ranks countries on Cantril Ladder self-reports, controlling for GDP per capita, social support, life expectancy, freedom, generosity and corruption perceptions. India ranked 116 out of 147 in 2026, with a score of 4.536, up two places from 118th in 2025. Finland retained top rank for the ninth straight year, while Afghanistan ranked last. India’s low position has been attributed to urban loneliness, inequality and governance perception rather than absolute poverty.
Significance for UPSC and General Knowledge
- Indices are the classic “easy-mark” Prelims current affairs cluster, with ranks, publishing bodies and year of launch as exam-worthy facts.
- They feature in GS Paper 2 (governance, international comparisons) and GS Paper 3 (innovation, economy).
- Government critiques of methodology are themselves a Mains question: is ranking India’s hunger by child indicators fair?
- They link to constitutional and policy goals such as Article 47 (duty to raise nutrition) and SDG 2 (Zero Hunger).
- They give essay-worthy material on the tension between economic size and welfare metrics, a recurring UPSC theme.
- Indices are regularly cited in Economic Survey and PIB releases, so examiners lift numbers directly from them.
Detailed Analysis: Why India’s Ranks Diverge Across Indices
India’s ranks on the five indices appear paradoxical at first glance. The country has one of the world’s largest economies and sits at 38 on innovation, yet ranks 102 on hunger and 116 on happiness. Three structural reasons explain the divergence.
The first is the scale effect. India’s 1.45 billion population means that any per-capita or per-household metric, from calories to green space, is diluted compared with smaller peers. Scandinavian countries top happiness and peace indices partly because they have fewer, more homogeneous populations with better-insured welfare. India’s diversity is a social strength but a statistical drag.
The second is the measurement mismatch. Indices like Henley and GII reward outward-facing capabilities: visa diplomacy, patent filings, research papers, ICT exports. India has invested aggressively in these. Indices like Hunger and Happiness measure domestic welfare, self-reported wellbeing and household food security, areas where the gains from macro growth lag by 10 to 20 years. India’s ranks therefore diverge depending on the metric’s proximity to the state’s administrative footprint.
The third is methodology contestation. The Ministry of External Affairs has pushed back against the Global Hunger Index, arguing that it uses the FAO’s undernourishment figure, which relies on a modelled “food supply” estimate from 3,000 respondents in a country of 1.4 billion. Similarly, the World Happiness Report relies on Gallup telephone polls that under-sample rural India. None of this means the indices are worthless, but it does mean they should be triangulated with domestic data such as NFHS, PLFS and NSO.
Comparative Perspective
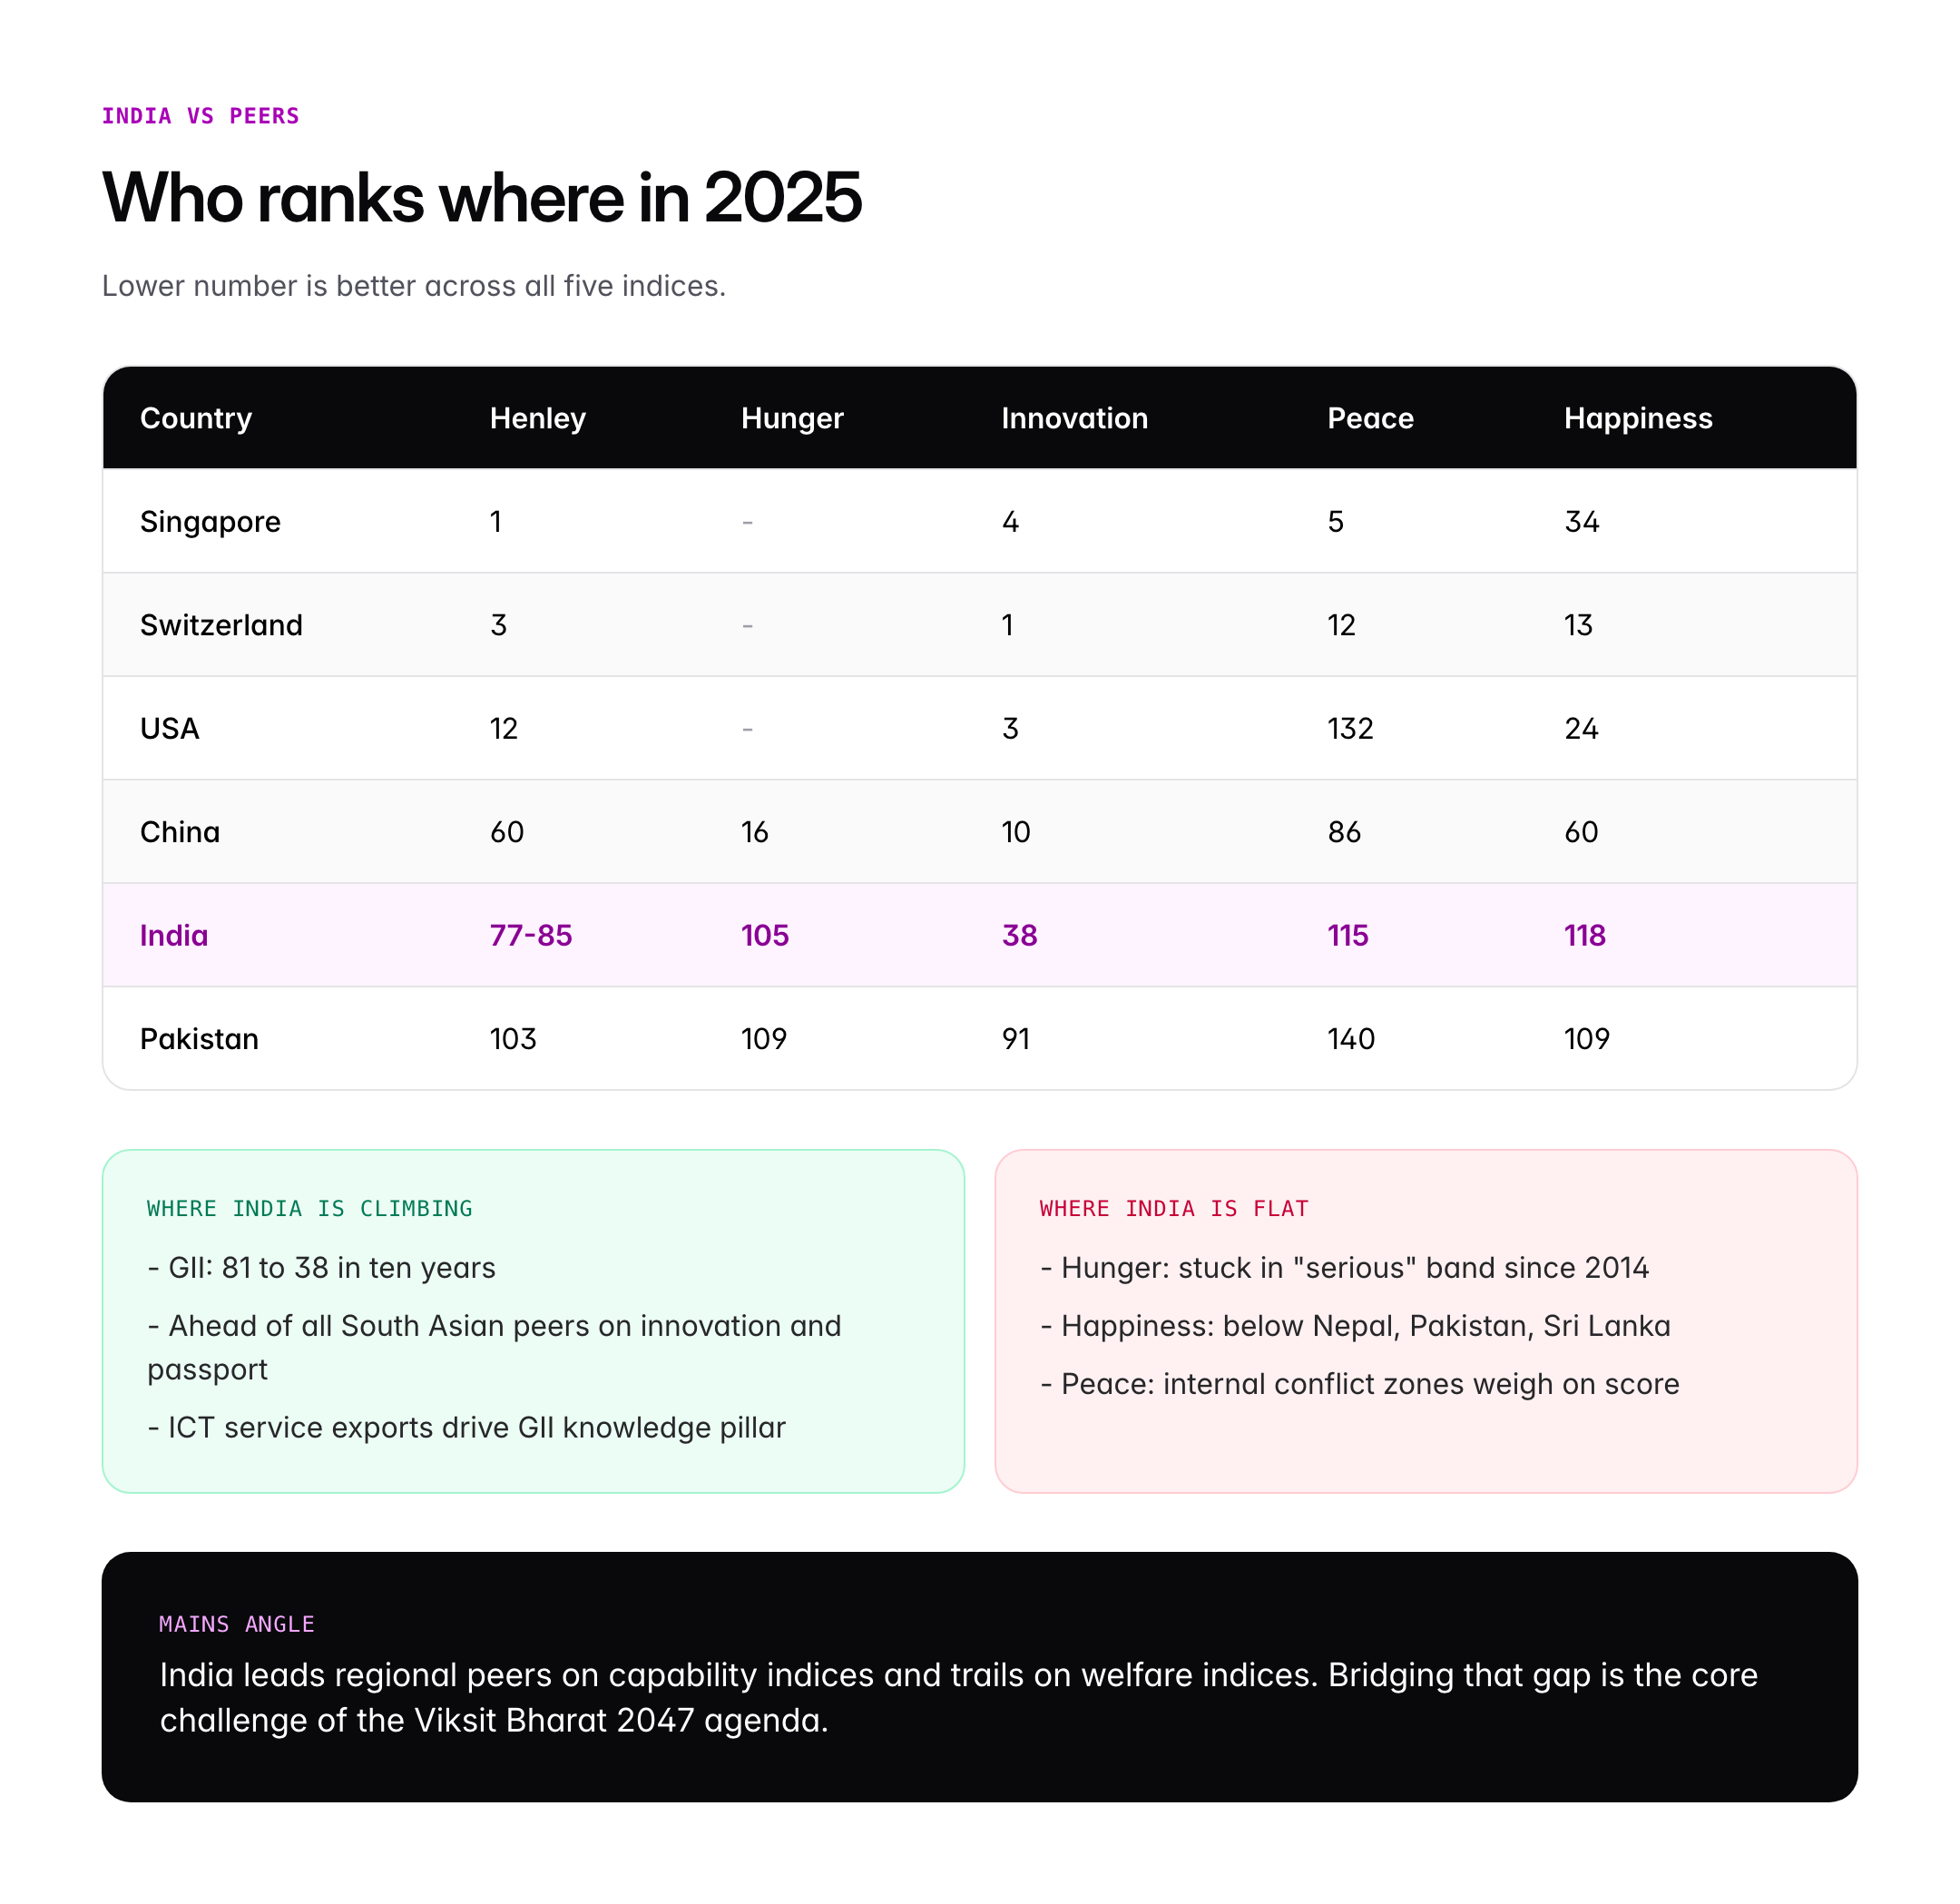
| Country | Henley 2026 | Hunger 2025 | Innovation 2025 | Peace 2026 | Happiness 2026 |
|---|---|---|---|---|---|
| Singapore | 1 | N/A | 4 | 8 | — |
| Switzerland | 3 | N/A | 1 | 3 | — |
| USA | 10 | N/A | 3 | 134 | 23 |
| China | 59 | 16 | 10 | 118 | 65 |
| India | 75 | 102 | 38 | 127 | 116 |
| Pakistan | 96 | 109 | 91 | 140 | 104 |
India trails high-income peers across the board but leads regional neighbours Pakistan, Nepal and Bangladesh on innovation and passport strength. The gap with China on peace and happiness is narrower than the gap on passport strength, reflecting China’s own governance trade-offs rather than superior welfare. India’s improvement trajectory on GII is unique among large economies, with a 43-place jump in ten years.
Controversies and Debates
The single biggest controversy surrounds the Global Hunger Index. The Indian government has consecutively rejected the 2021, 2022, 2023 and 2024 editions, arguing that three out of four indicators are exclusively about children and that the undernourishment metric uses Gallup World Poll samples of about 3,000 respondents. Critics counter that these same indicators are used for all 127 countries consistently, so methodological objections should apply uniformly. The debate is a set-piece example of how global rankings become diplomatic flashpoints.
The World Happiness Report has faced similar scrutiny. In 2022 a group of Indian economists published an open letter questioning the Cantril Ladder methodology’s cultural portability. The Henley Passport Index is less politically contentious but its sister “investment migration index” has drawn scrutiny for commercialising citizenship pathways. The Global Peace Index faces the challenge that militarisation is counted negatively, penalising countries like India that maintain large armies in response to hostile neighbours. Each index carries a point of view. For UPSC, being able to name the controversy is often more useful than memorising the exact rank.
Prelims Pointers
- Henley Passport Index is published by Henley & Partners using IATA data.
- Singapore ranks #1 on the Henley 2026 Index with visa-free access to 192 destinations.
- India ranked 75 on the 2026 Henley Index (56 destinations), up from 85 in 2025.
- Global Hunger Index is compiled by Concern Worldwide and Welthungerhilfe.
- GHI 2025 ranked India 102 out of 123 with a score of 25.8 (serious category).
- Global Innovation Index is published by WIPO, a UN agency.
- India ranked 38 out of 139 on GII 2025, up from 81 in 2015.
- Global Peace Index is by the Institute for Economics and Peace, Sydney.
- GPI 2026 ranks India 127 out of 163; Iceland tops.
- World Happiness Report 2026 ranks India 116 of 147; Finland tops (9th year).
- WHR is released on 20 March (International Day of Happiness).
- The Indian government has formally rejected the GHI methodology multiple times.
Mains Practice Questions
- “International indices measure what governments report, but development is what citizens experience.” Evaluate this claim in the context of India’s divergent ranks on innovation and hunger.
- Outline scale, measurement and methodology issues
- Contrast GII 38 with GHI 105 and explain why both can be simultaneously true
- Argue for triangulation with domestic NFHS and PLFS data
- Discuss the diplomatic and policy relevance of the Henley Passport Index for India’s foreign policy.
- Visa-free access as a proxy for diplomatic capital
- UAE 2023 Abu Dhabi Declaration as a case study
- Link to Indian diaspora, skilled migration and soft power
Conclusion
India in 2025–26 presents a split-screen image across global indices. On innovation and passport strength, the country is climbing. On hunger, peace and happiness, it is flat or slipping. No single ranking captures the whole story, which is why UPSC questions tend to blend two or three indices and ask for reconciliation. Memorising India’s rank is necessary but not sufficient; understanding who compiles the index, what it measures and why the government contests it is what earns the higher band of marks.
For the informed citizen as much as the aspirant, these indices are a mirror held up to Indian policy. They reward what the state builds and expose what it neglects. Taken together, they argue that India’s 2047 Viksit Bharat vision will need to close the welfare-innovation gap before the macro-level climb translates into lived experience at the household level.
Frequently Asked Questions
What is India’s rank on the Henley Passport Index 2026?
India ranked 75th on the 2026 Henley Passport Index, giving Indian passport holders visa-free or visa-on-arrival access to 56 destinations — a jump of ten places from 85th in 2025. Singapore holds the number-one spot with access to 192 destinations. The index is compiled by Henley & Partners using International Air Transport Association data.
Why is the Henley Passport Index important for UPSC?
The Henley Index is a proxy for a country’s diplomatic capital and soft power. It appears in Prelims current affairs questions and in GS Paper 2 discussions of international relations. UPSC frequently tests the publishing body (Henley & Partners), the data source (IATA), top and bottom countries, and diplomatic developments like UAE’s 2023 Abu Dhabi Declaration that widened visa-free access for Indians.
How is the Global Hunger Index related to India’s nutrition policies?
The Global Hunger Index measures undernourishment, child stunting, child wasting and child mortality, which mirror NFHS-5 metrics for India. It relates directly to PM POSHAN (Mid-Day Meal), the Integrated Child Development Services and Poshan Abhiyaan. India ranks 102 out of 123 on GHI 2025, a gap the central government contests on methodology, citing the child-focused weighting of three of the four indicators.
Who publishes the Global Innovation Index?
The Global Innovation Index is published annually by the World Intellectual Property Organization, a UN specialised agency headquartered in Geneva, in partnership with INSEAD and Cornell’s SC Johnson College of Business. It ranks 139 economies on 80 indicators across seven pillars and was launched in 2007. India ranked 38 on GII 2025, up dramatically from 81 in 2015.
What is India’s rank on the Global Peace Index 2026?
India ranks 127 out of 163 countries on the 2026 Global Peace Index, compiled by the Australia-based Institute for Economics and Peace. The country fell sharply from 115th in 2025 after a 2.9 per cent decline in its peacefulness score. Iceland has topped the index every year since 2008. Border tensions with Pakistan and Myanmar and the ethnic violence in Manipur pull down India’s ranking.
Why does India rank low on the World Happiness Report?
India ranks 116 out of 147 on the World Happiness Report 2026 with a score of 4.536, up two places from 118th in 2025. Low self-reported life evaluations, urban loneliness, inequality, corruption perception and weaker generosity metrics explain the ranking. Finland topped the index for the ninth consecutive year. The report is published jointly by the Gallup World Poll and Oxford Wellbeing Research Centre on 20 March each year.
Why has the Indian government rejected the Global Hunger Index?
The Ministry of Women and Child Development and the Ministry of External Affairs have formally rejected recent GHI editions, arguing that three of its four indicators are exclusively child-focused and that the undernourishment figure relies on a Gallup World Poll sample of about 3,000 respondents for a nation of 1.4 billion. The government calls the method erroneous and flawed, though the index has been consistent across countries.
What is the difference between the Henley Index and the Arton Capital Passport Index?
Both rank passports by visa-free access, but Henley uses IATA data and a simple count of destinations with a tie-breaker system, while Arton Capital’s Passport Index is real-time and weighted by a ‘mobility score’ that includes visa-on-arrival and eTAs. Rankings can differ by several places. For UPSC, Henley is the more frequently cited benchmark in news reports and the PIB.
Tell Google you want more of this.
Add Anantam IAS as a preferred sourceOne tap, and this site shows up more often in your own Top Stories, AI Overviews and AI Mode. Remove it any time.