Introduction
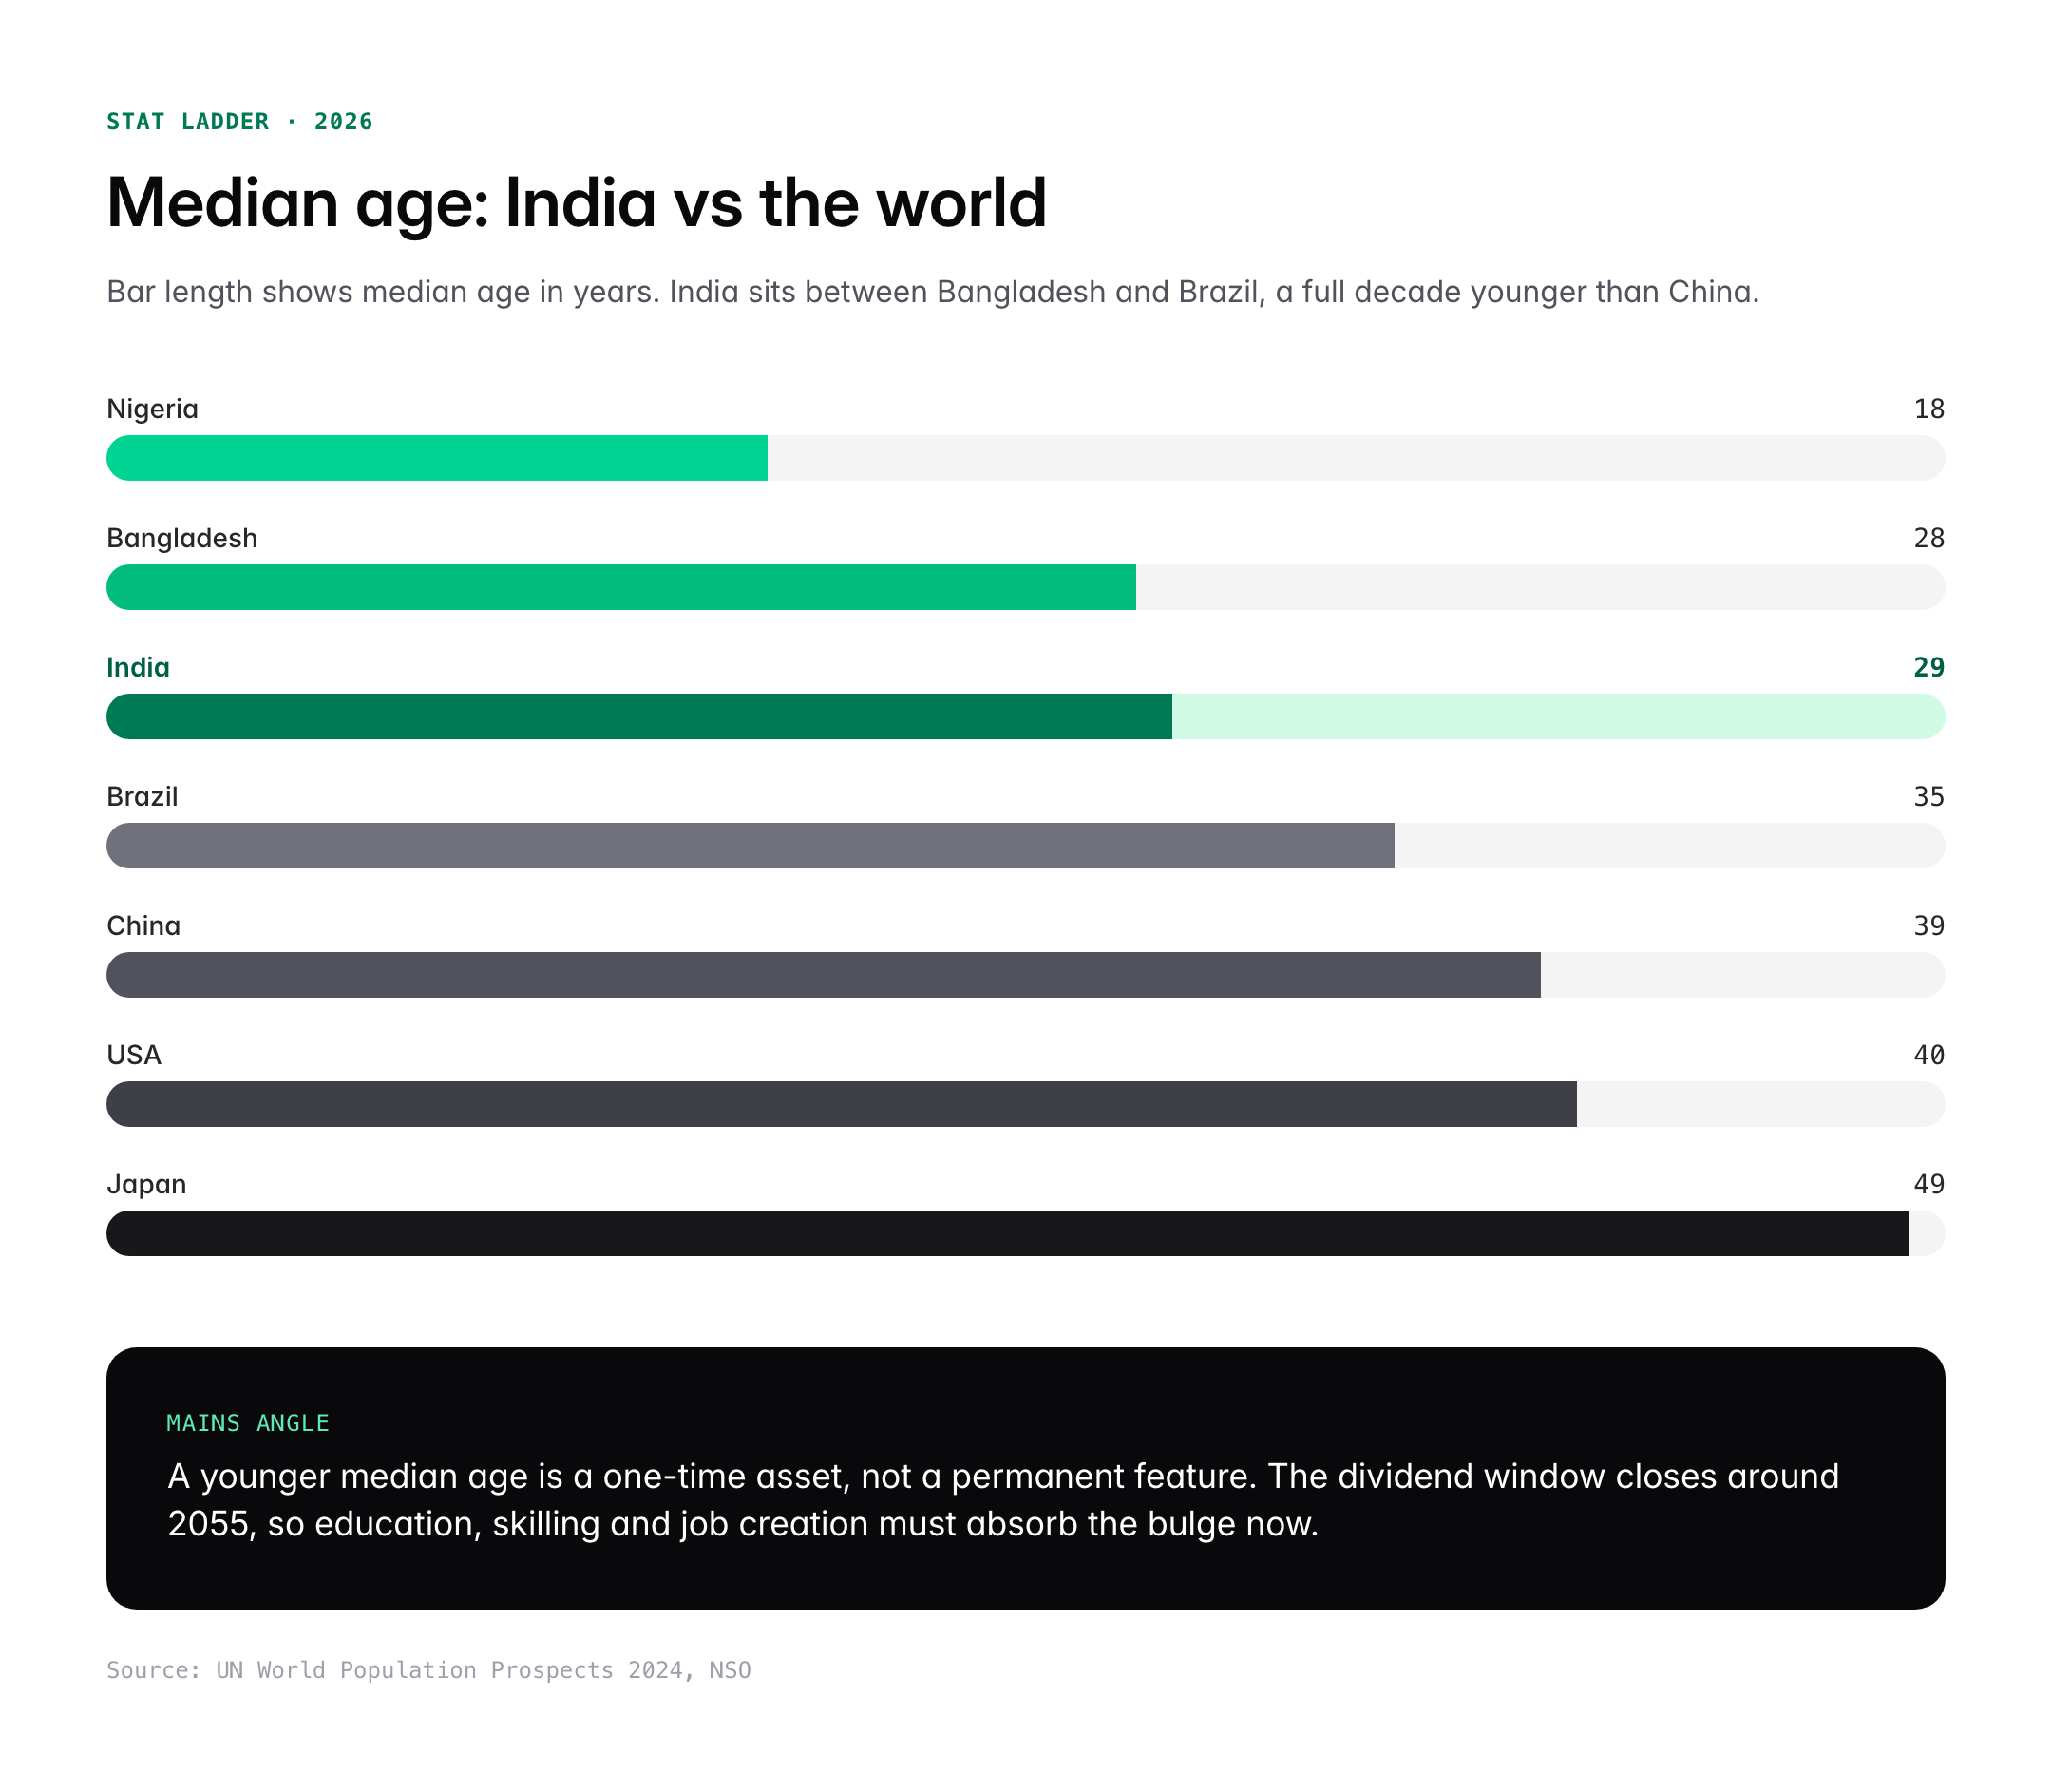
India in 2026 stands at a demographic moment that most large economies would envy. The United Nations Population Division and the National Statistical Office (NSO) estimate the country’s median age at roughly 29 years, meaning half of India’s 1.45 billion citizens are younger than 29. Compare that with 40 in the United States, 48 in Japan and 39 in China, and the scale of the Indian youth bulge becomes obvious. This single number shapes almost every debate in Indian public policy, from job creation and skilling to pension design and defence recruitment.
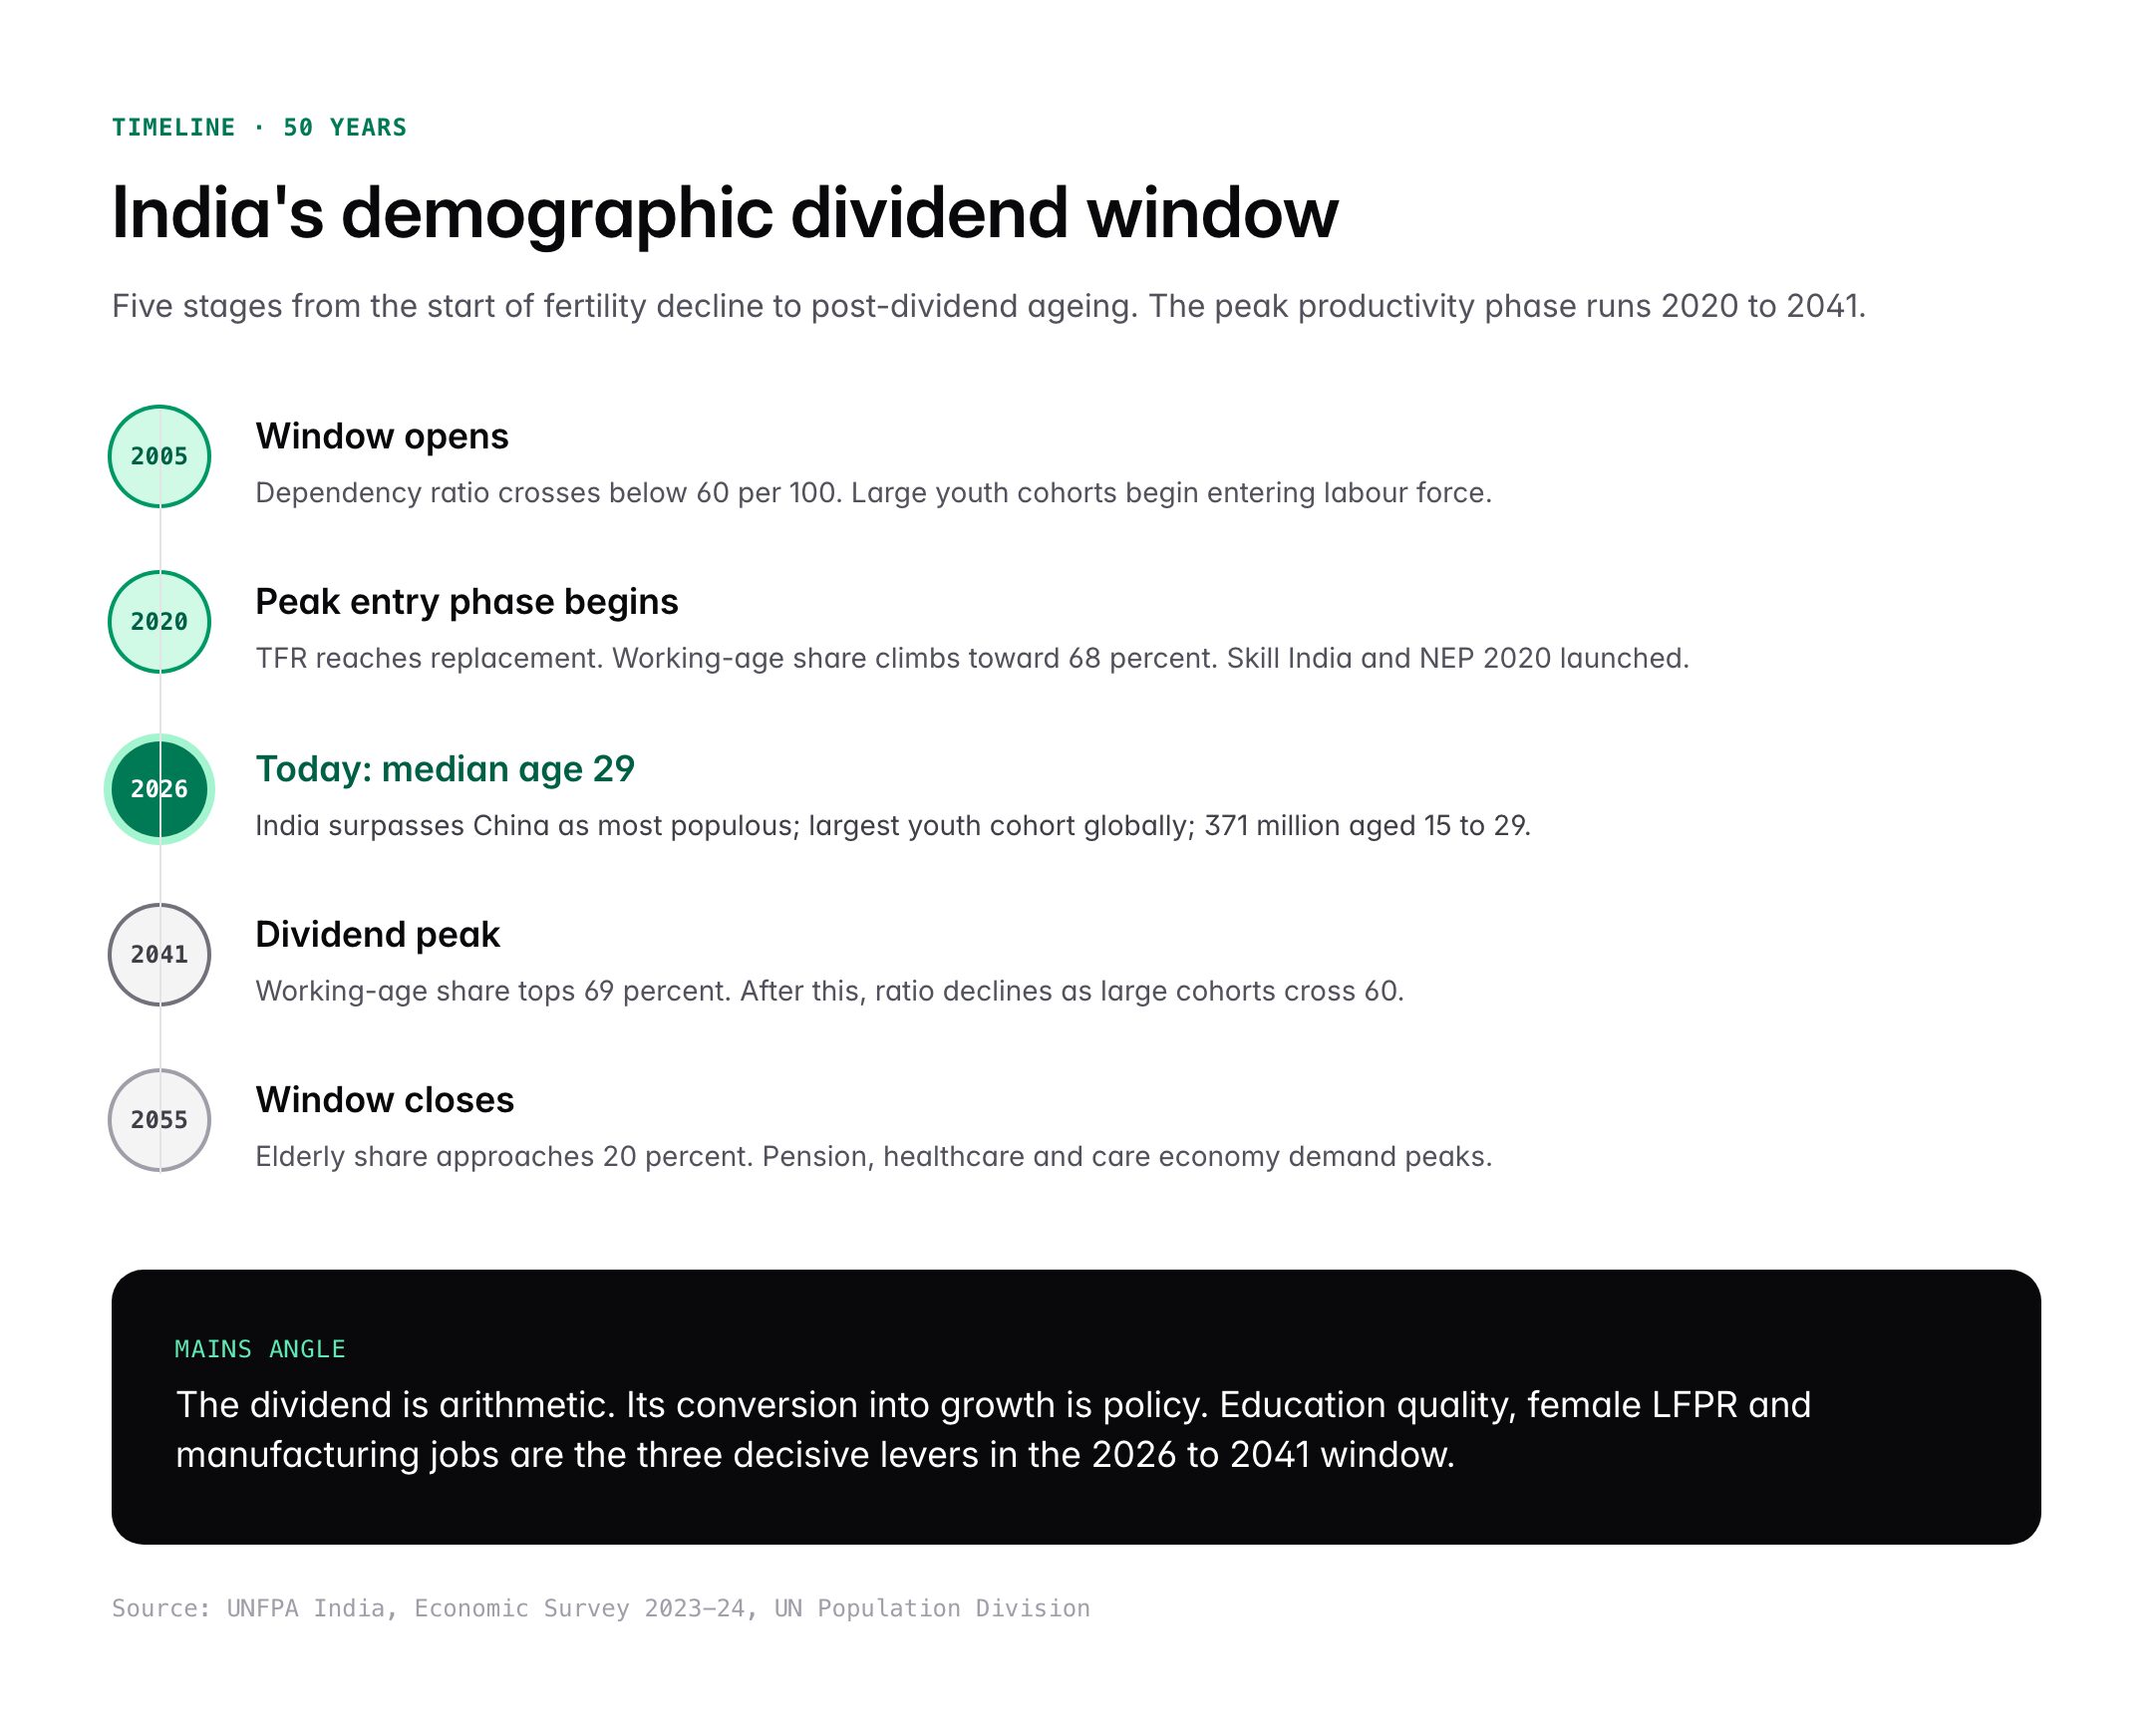
Yet the median age hides sharp internal divergences. Kerala has already crossed 33 years while Bihar remains close to 22. The window of the so-called demographic dividend is finite, closing around 2041 according to the Economic Survey and the UN’s World Population Prospects. For UPSC aspirants, mastering the arithmetic of age structure and its policy implications is essential across GS1 (Society), GS2 (Welfare Schemes) and GS3 (Economy and Employment).
Quick Facts at a Glance
| Indicator | Value (2026) | Source |
|---|---|---|
| Median age of India | ~29 years | UN WPP 2024 / NSO |
| Total population | ~1.45 billion | UN estimates |
| Working-age share (15–64) | ~68 percent | Economic Survey |
| Dependency ratio | ~47 per 100 | World Bank |
| Total Fertility Rate (TFR) | 2.0 | NFHS-5 (2019-21) |
| Life expectancy at birth | 72.4 years | SRS 2021 |
| Demographic dividend window | 2005–2055 (peak 2020–2041) | UNFPA |
| Youngest state by median age | Bihar (~22) | Census projections |
| Oldest state by median age | Kerala (~33) | Census projections |
Background and Historical Context
India’s age profile has transformed twice in living memory. At Independence in 1947, India’s population was about 340 million with a crude birth rate above 40 per 1,000 and a life expectancy below 32 years. The median age hovered around 20. Mortality declines triggered by antibiotics, the Green Revolution and mass immunisation caused a population explosion through the 1960s and 1970s, and the Registrar General’s data shows the population doubling to 683 million by 1981.
The National Family Planning Programme, launched in 1952 as the world’s first official population policy, began the long work of fertility reduction. By the time the National Population Policy 2000 was released, the Total Fertility Rate had fallen to 3.2. Replacement-level fertility of 2.1 was achieved nationally around 2019-20, as confirmed by NFHS-5. With fewer children being born and longer lives being lived, the median age began rising roughly 0.3 years every calendar year.
The current demographic moment is the mathematical consequence of these trends. Large birth cohorts from the 1990s and 2000s are now in their twenties and thirties, producing a working-age bulge unmatched in Indian history. The UNFPA State of World Population reports have repeatedly called this the single biggest asset India carries into the next three decades, provided education, health and employment keep pace.
Key Features of India’s Age Structure
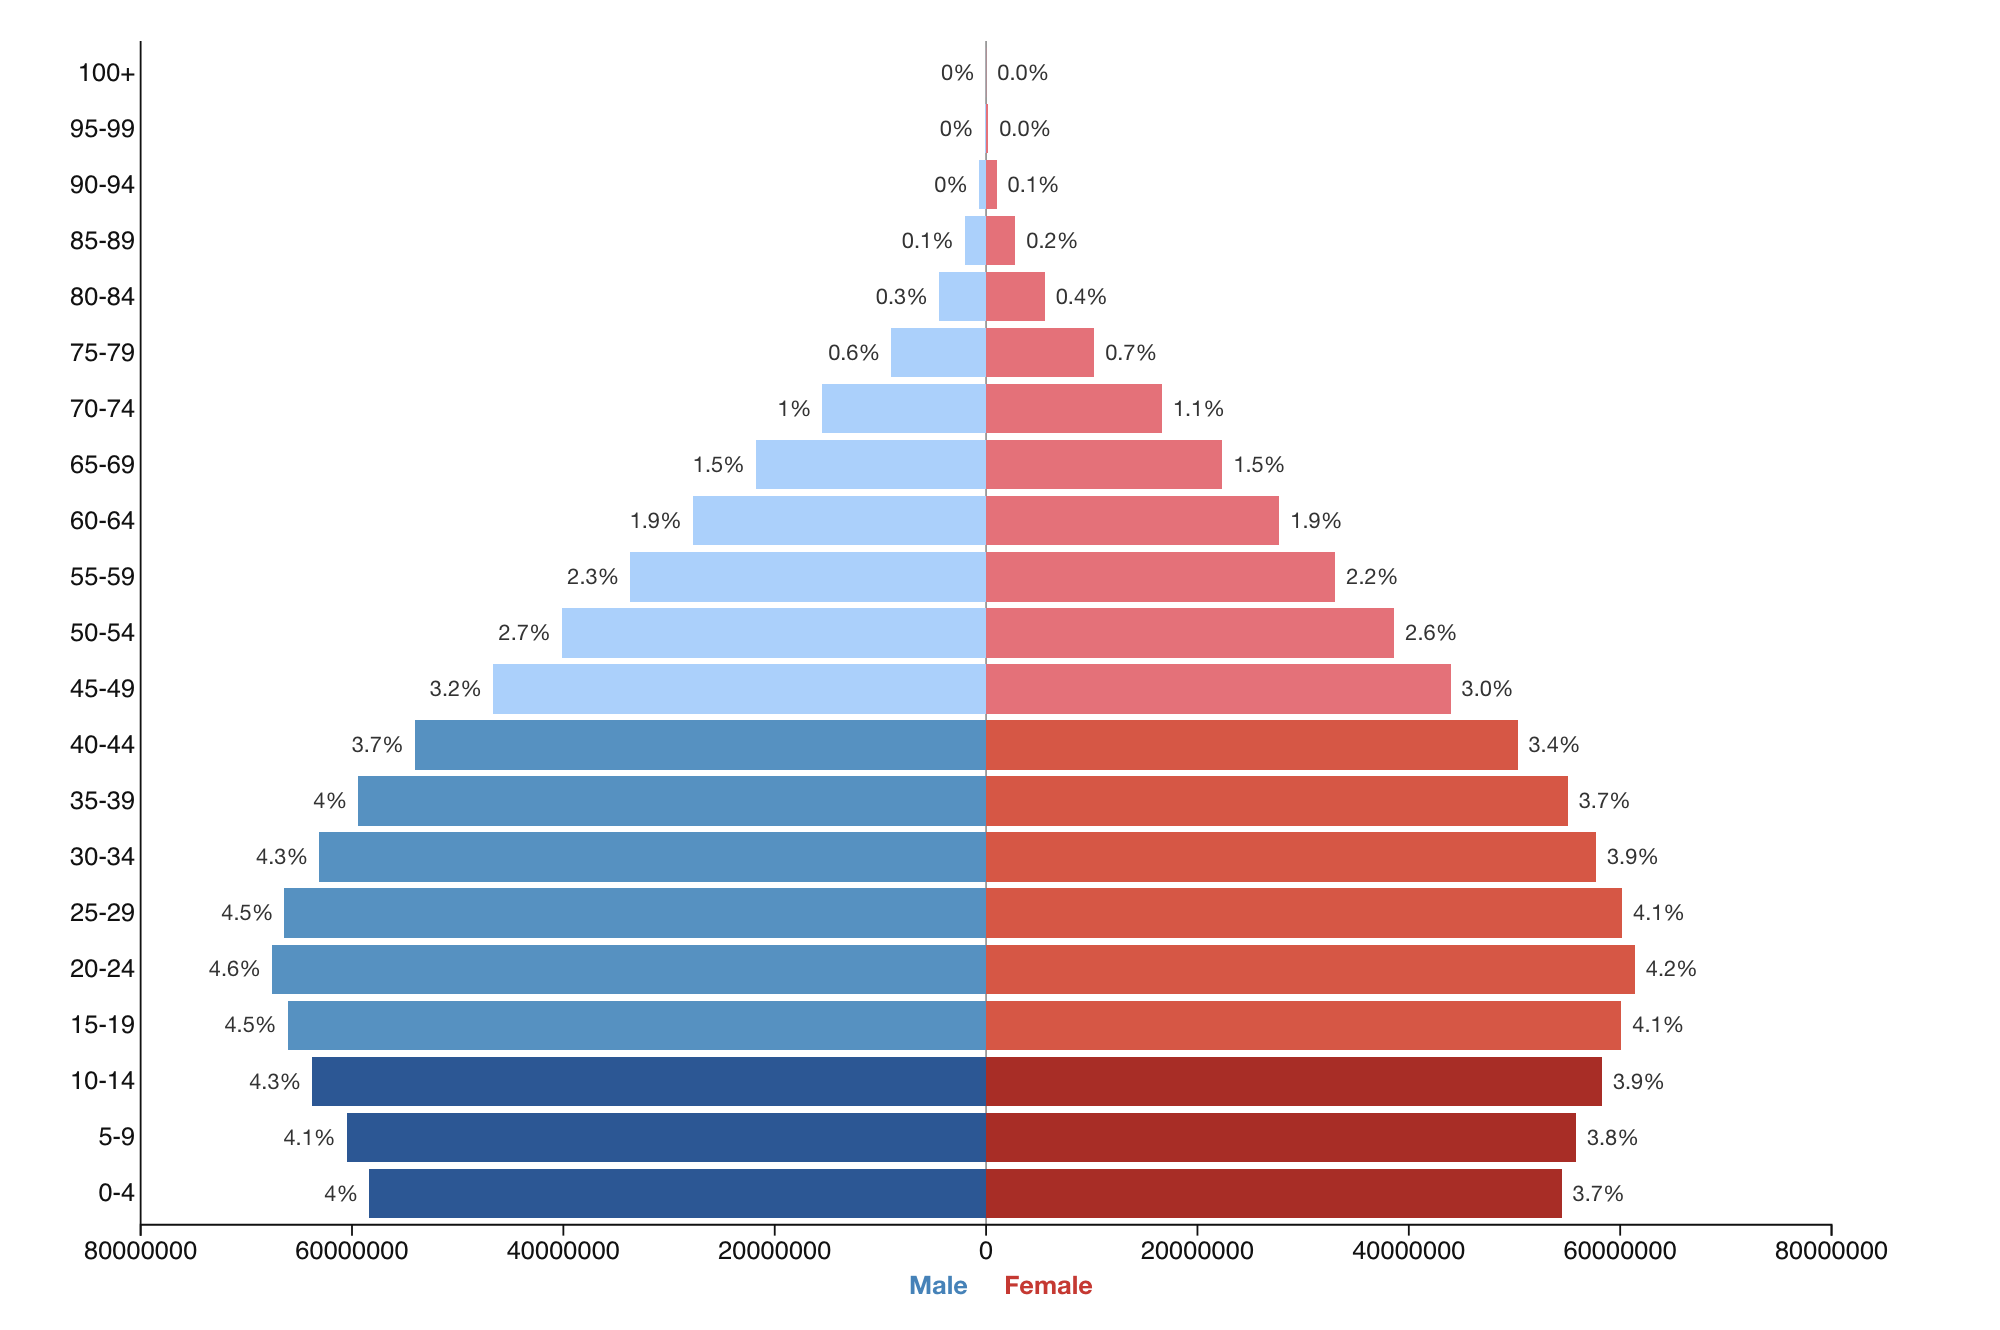
Youth Bulge and the 15–29 Cohort
India has roughly 371 million people aged 15–29, the largest youth cohort of any country. The Ministry of Youth Affairs defines youth as 15–29 under the National Youth Policy 2014, and this group drives higher education enrolment, first-time voter rolls and labour force entry. The Periodic Labour Force Survey (PLFS) 2022-23 recorded youth labour force participation at 44.5 percent, with significant gender gaps.
Working-Age Population
The working-age population (15–64) is approximately 988 million, about 68 percent of the total. This share is projected to peak near 69 percent around 2036 before declining. A higher working-age share, all else equal, raises per capita GDP through the accounting identity that links output to labour force size.
Elderly Population
Indians aged 60 and above now number about 157 million, roughly 10.8 percent. The Longitudinal Ageing Study in India (LASI) Wave 1 projects this share to reach 20 percent by 2050. Kerala, Tamil Nadu, Himachal Pradesh and Punjab are ageing fastest. The National Policy for Senior Citizens 2011 remains the umbrella framework, and schemes like the Atal Vayo Abhyudaya Yojana provide social security and healthcare.
Child Population
Children aged 0–14 are about 24 percent of the total, down from 42 percent in 1971. This shrinking share is the arithmetic mirror image of the youth bulge. It is good news for per-child public spending on nutrition (POSHAN Abhiyaan) and schooling (Samagra Shiksha), but only if absolute numbers keep falling.
Sex Ratio at Birth
The sex ratio at birth improved from 918 in NFHS-4 to 929 in NFHS-5. Continued skew affects long-term age-cohort dynamics, particularly marriage markets and old-age care.
Significance for UPSC and General Knowledge
- Core topic in GS1 Society syllabus under “Population and Associated Issues”
- Directly linked to GS3 Economy questions on employment, skilling and the informal sector
- Relevant to GS2 questions on welfare schemes for youth, women and the elderly
- Frequent Prelims subject: figures like TFR, sex ratio, life expectancy appear regularly
- Ethics and GS4 link through intergenerational justice and elder care
- Essay paper fodder: “Demographic dividend or demographic disaster” is a recurring prompt
Detailed Analysis: Demographic Dividend and Policy Response
The demographic dividend is not automatic. As the Nobel laureate economist Robert Fogel and demographer David Bloom have shown, it accrues only when the extra labour force is educated, healthy and productively employed. India’s policy architecture has three prongs.
The human capital prong includes the National Education Policy 2020, which targets a 50 percent Gross Enrolment Ratio in higher education by 2035, and the PM SHRI schools initiative. Health investment runs through Ayushman Bharat, whose PM-JAY arm covered 34 crore beneficiaries as of 2024. Nutrition is tackled via POSHAN 2.0 and the PDS under the NFSA 2013.
The employment prong centres on skilling and entrepreneurship. The Skill India Mission, through PMKVY 4.0 and the National Apprenticeship Promotion Scheme, targets formal skilling of 40 million youth by 2030. The PLI schemes across 14 sectors aim to create 6 million manufacturing jobs. MUDRA loans, Stand-Up India and the Startup India programme address self-employment.
The social protection prong addresses the tail risk that unorganised-sector workers face in old age. The Atal Pension Yojana, the e-Shram portal (over 30 crore registrations) and the new Labour Codes consolidate this effort. The Pradhan Mantri Shram Yogi Maan-dhan Yojana specifically targets informal workers aged 18–40.
The failure mode is a demographic disaster scenario in which the youth bulge translates into high unemployment, urban underemployment and social unrest. PLFS 2022-23 data showing 10 percent urban youth unemployment and the low female labour force participation of 32.7 percent are early warnings. Tackling these requires deep labour market reform and, increasingly, investment in care economy jobs as the elderly share rises.
Comparative Perspective
India’s demographic position differs sharply from both its neighbours and economic peers. A cross-country comparison sharpens the policy lessons.
| Country | Median Age (2026) | TFR | Working-age share | Dividend Status |
|---|---|---|---|---|
| India | 29 | 2.0 | 68% | Open, peak 2036 |
| China | 39 | 1.0 | 68% | Closing fast |
| USA | 40 | 1.6 | 65% | Mature |
| Japan | 49 | 1.3 | 58% | Post-dividend |
| Brazil | 35 | 1.6 | 68% | Peaking |
| Nigeria | 18 | 4.6 | 55% | Pre-dividend |
| Bangladesh | 28 | 1.9 | 67% | Parallel to India |
China’s ageing illustrates the “growing old before growing rich” risk that India must avoid. East Asian Tigers like South Korea and Taiwan converted their dividends into high-income status through manufacturing-led export growth between 1960 and 1990. India’s service-led path is different, making productivity growth in services and manufacturing both essential.
Challenges and Criticisms
The demographic-dividend narrative faces four serious critiques. First, jobless growth: GDP has grown at an average 6.5 percent in recent years but PLFS data suggests formal employment elasticity remains low. Second, female labour force participation at 32.7 percent (PLFS 2022-23) is far below comparable economies, halving the effective dividend. Third, regional divergence means southern states are ageing while northern states still have high fertility, creating an internal migration burden that strains urban infrastructure and federal fiscal arithmetic (the 15th Finance Commission terms of reference debate).
Fourth, critics including economist Amartya Sen have highlighted the skill mismatch: NASSCOM reports estimate only 45 percent of engineering graduates are employable in their core field. The ASER surveys show foundational literacy and numeracy gaps in early grades. Without fixing school quality, the dividend converts into underemployment rather than productivity.
A further concern is the ageing lag in the South. Kerala and Tamil Nadu will need to scale geriatric care, pension systems and healthcare before the rest of the country, raising complex questions about fiscal federalism and inter-state transfers.
Prelims Pointers
- Median age of India 2026: approximately 29 years
- Working-age share (15-64): about 68 percent
- Total Fertility Rate (NFHS-5): 2.0
- Replacement TFR: 2.1
- Life expectancy at birth 2021 (SRS): 72.4 years
- Sex ratio at birth (NFHS-5): 929
- Dependency ratio: about 47 per 100
- Demographic dividend window: 2005-2055, peak 2020-2041
- Youngest major state: Bihar (~22)
- Oldest major state: Kerala (~33)
- National Population Policy: year 2000
- LASI Wave 1 report published: 2021
Mains Practice Questions
Q1. “India’s demographic dividend risks becoming a demographic disaster unless accompanied by deep labour market reforms.” Discuss. (15 marks, 250 words)
- Define dividend, cite median age 29 and 68 percent working-age share
- Identify risks: jobless growth, low female LFPR, skill gaps, regional divergence
- Suggest reforms: NEP 2020 implementation, labour codes, care economy, PLFS-driven monitoring
Q2. Examine the regional divergence in India’s age structure and its implications for cooperative federalism. (10 marks, 150 words)
- Contrast Kerala (ageing) with Bihar (youthful)
- Migration pressure on urban infrastructure and Finance Commission devolution debates
- Need for differentiated state policies; elder care in South, skilling in North
Conclusion
India’s median age of 29 in 2026 is not a statistic for almanacs. It is the demographic backdrop against which every policy debate of the next two decades will unfold. The arithmetic is in India’s favour for roughly fifteen more years. After that, the same cohorts will age and dependency ratios will climb.
Whether the country converts this window into a high-income economy or drifts into middle-income stagnation depends on three levers: education quality, female workforce participation and labour-intensive job creation. The National Education Policy, the labour codes and missions like Skill India set the direction. Execution, monitored through credible statistics and evaluated honestly, will decide the outcome.
Frequently Asked Questions
What is the median age of India in 2026?
India’s median age in 2026 is approximately 29 years, according to the UN World Population Prospects 2024 and the National Statistical Office. This means half of India’s roughly 1.45 billion citizens are younger than 29, making India one of the youngest major economies in the world.
Why is the median age of India important for UPSC?
Median age is central to the GS1 Society syllabus on population, GS2 welfare schemes for youth and elderly, and GS3 Economy questions on employment and skilling. It also features in Prelims through figures like TFR, sex ratio, and life expectancy, and is a recurring essay paper prompt on the demographic dividend.
How is median age related to the demographic dividend?
The demographic dividend occurs when the working-age share (15 to 64) is large relative to dependents. A rising median age in the 20s and early 30s signals that earlier large birth cohorts are entering the workforce. India’s dividend window runs roughly 2005 to 2055, peaking around 2036 to 2041.
Which Indian state has the highest and lowest median age?
Kerala has the highest median age at around 33 years due to low fertility and high life expectancy, while Bihar has the lowest at roughly 22 years because of higher Total Fertility Rate and a younger demographic profile. This divergence shapes internal migration patterns.
What is India’s Total Fertility Rate in 2026?
India’s Total Fertility Rate, per the National Family Health Survey-5 (2019 to 2021), is 2.0, which is below the replacement level of 2.1. This confirms that fertility has been falling steadily since the 1990s and is driving the increase in median age.
When will the demographic dividend end for India?
The UN Population Division and the Economic Survey estimate that India’s demographic dividend will peak around 2036 to 2041 and effectively close by 2055. After that, the share of population above 60 will rise sharply, requiring substantial investment in pensions, healthcare and elder care.
What is the elderly population of India in 2026?
Indians aged 60 and above number approximately 157 million in 2026, about 10.8 percent of the population. The Longitudinal Ageing Study in India projects this share to reach 20 percent by 2050, with Kerala, Tamil Nadu, Himachal Pradesh and Punjab ageing fastest.
How does India’s median age compare to China’s?
India’s median age of 29 is a decade younger than China’s 39 in 2026. China is ageing rapidly with a fertility rate of 1.0, while India’s 2.0 TFR keeps it younger. This gives India a longer demographic window but also a larger job creation challenge over the next 15 years.