Introduction
Per capita income (PCI) is one of the most quoted but least understood economic indicators in public debate. It is the average income of a person in an economy over a year, and it serves as a rough measure of the standard of living. For the Indian aspirant, understanding per capita income is essential because it pops up everywhere, from the Economic Survey and Union Budget documents to the Fifteenth Finance Commission criteria and the National Statistical Office’s quarterly press releases.
This article explains what per capita income is, how it is calculated, why India’s national figure hides vast state-level inequalities, and how India compares with peers such as China, Bangladesh and the world average. It also lays out the statistical distinctions between nominal and purchasing power parity (PPP) figures, the difference between Net National Income per capita and GDP per capita, and the reasons why per capita income alone cannot capture well-being.
Quick Facts at a Glance
| Parameter | Value (reference year 2024-25) |
|---|---|
| Nominal per capita Net National Income (India) | Around INR 2.15 lakh at current prices |
| Real per capita NNI (2011-12 base) | Around INR 1.14 lakh |
| Nominal per capita GDP | Around USD 2,700 |
| PPP per capita GDP | Around USD 10,200 (IMF estimate) |
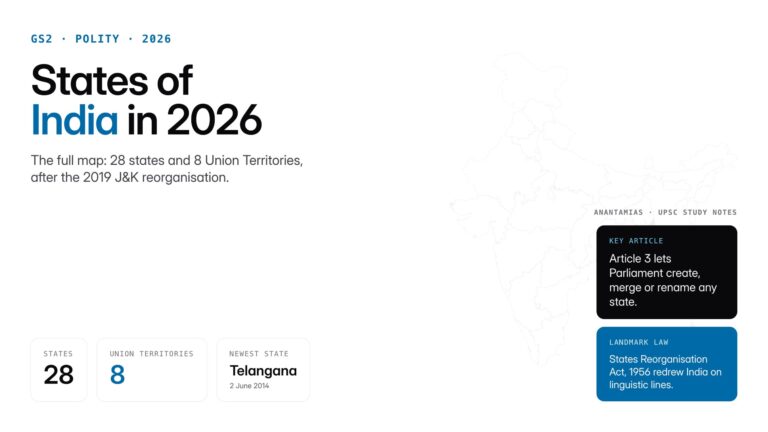
| Highest per capita among states | Sikkim, followed by Goa and Delhi |
| Lowest per capita among major states | Bihar |
| World average per capita GDP | Around USD 13,900 |
| Data source | National Statistical Office, MoSPI |
| World Bank income classification (India) | Lower-middle income |
Note: precise figures vary by revision and source; always cite the latest Press Information Bureau release for competitive examinations.
Background and Historical Context
In the first decades after Independence, Indian per capita income grew at what economists J. Bhagwati and T. N. Srinivasan called the Hindu rate of growth, roughly 3 per cent of GDP growth annually translating into less than 1.5 per cent real per capita income growth. The 1991 balance-of-payments crisis triggered the opening of the economy under finance minister Manmohan Singh, and the subsequent decade saw a sharp acceleration in per capita income.
Between 2003 and 2011 India averaged over 7 per cent real GDP growth, pulling per capita income up significantly. By 2015 the World Bank had moved India from the low-income to the lower-middle-income category. Nominal per capita Net National Income rose from around INR 63,500 in 2010-11 to around INR 2.15 lakh in 2024-25 at current prices, more than a three-fold rise in fifteen years.
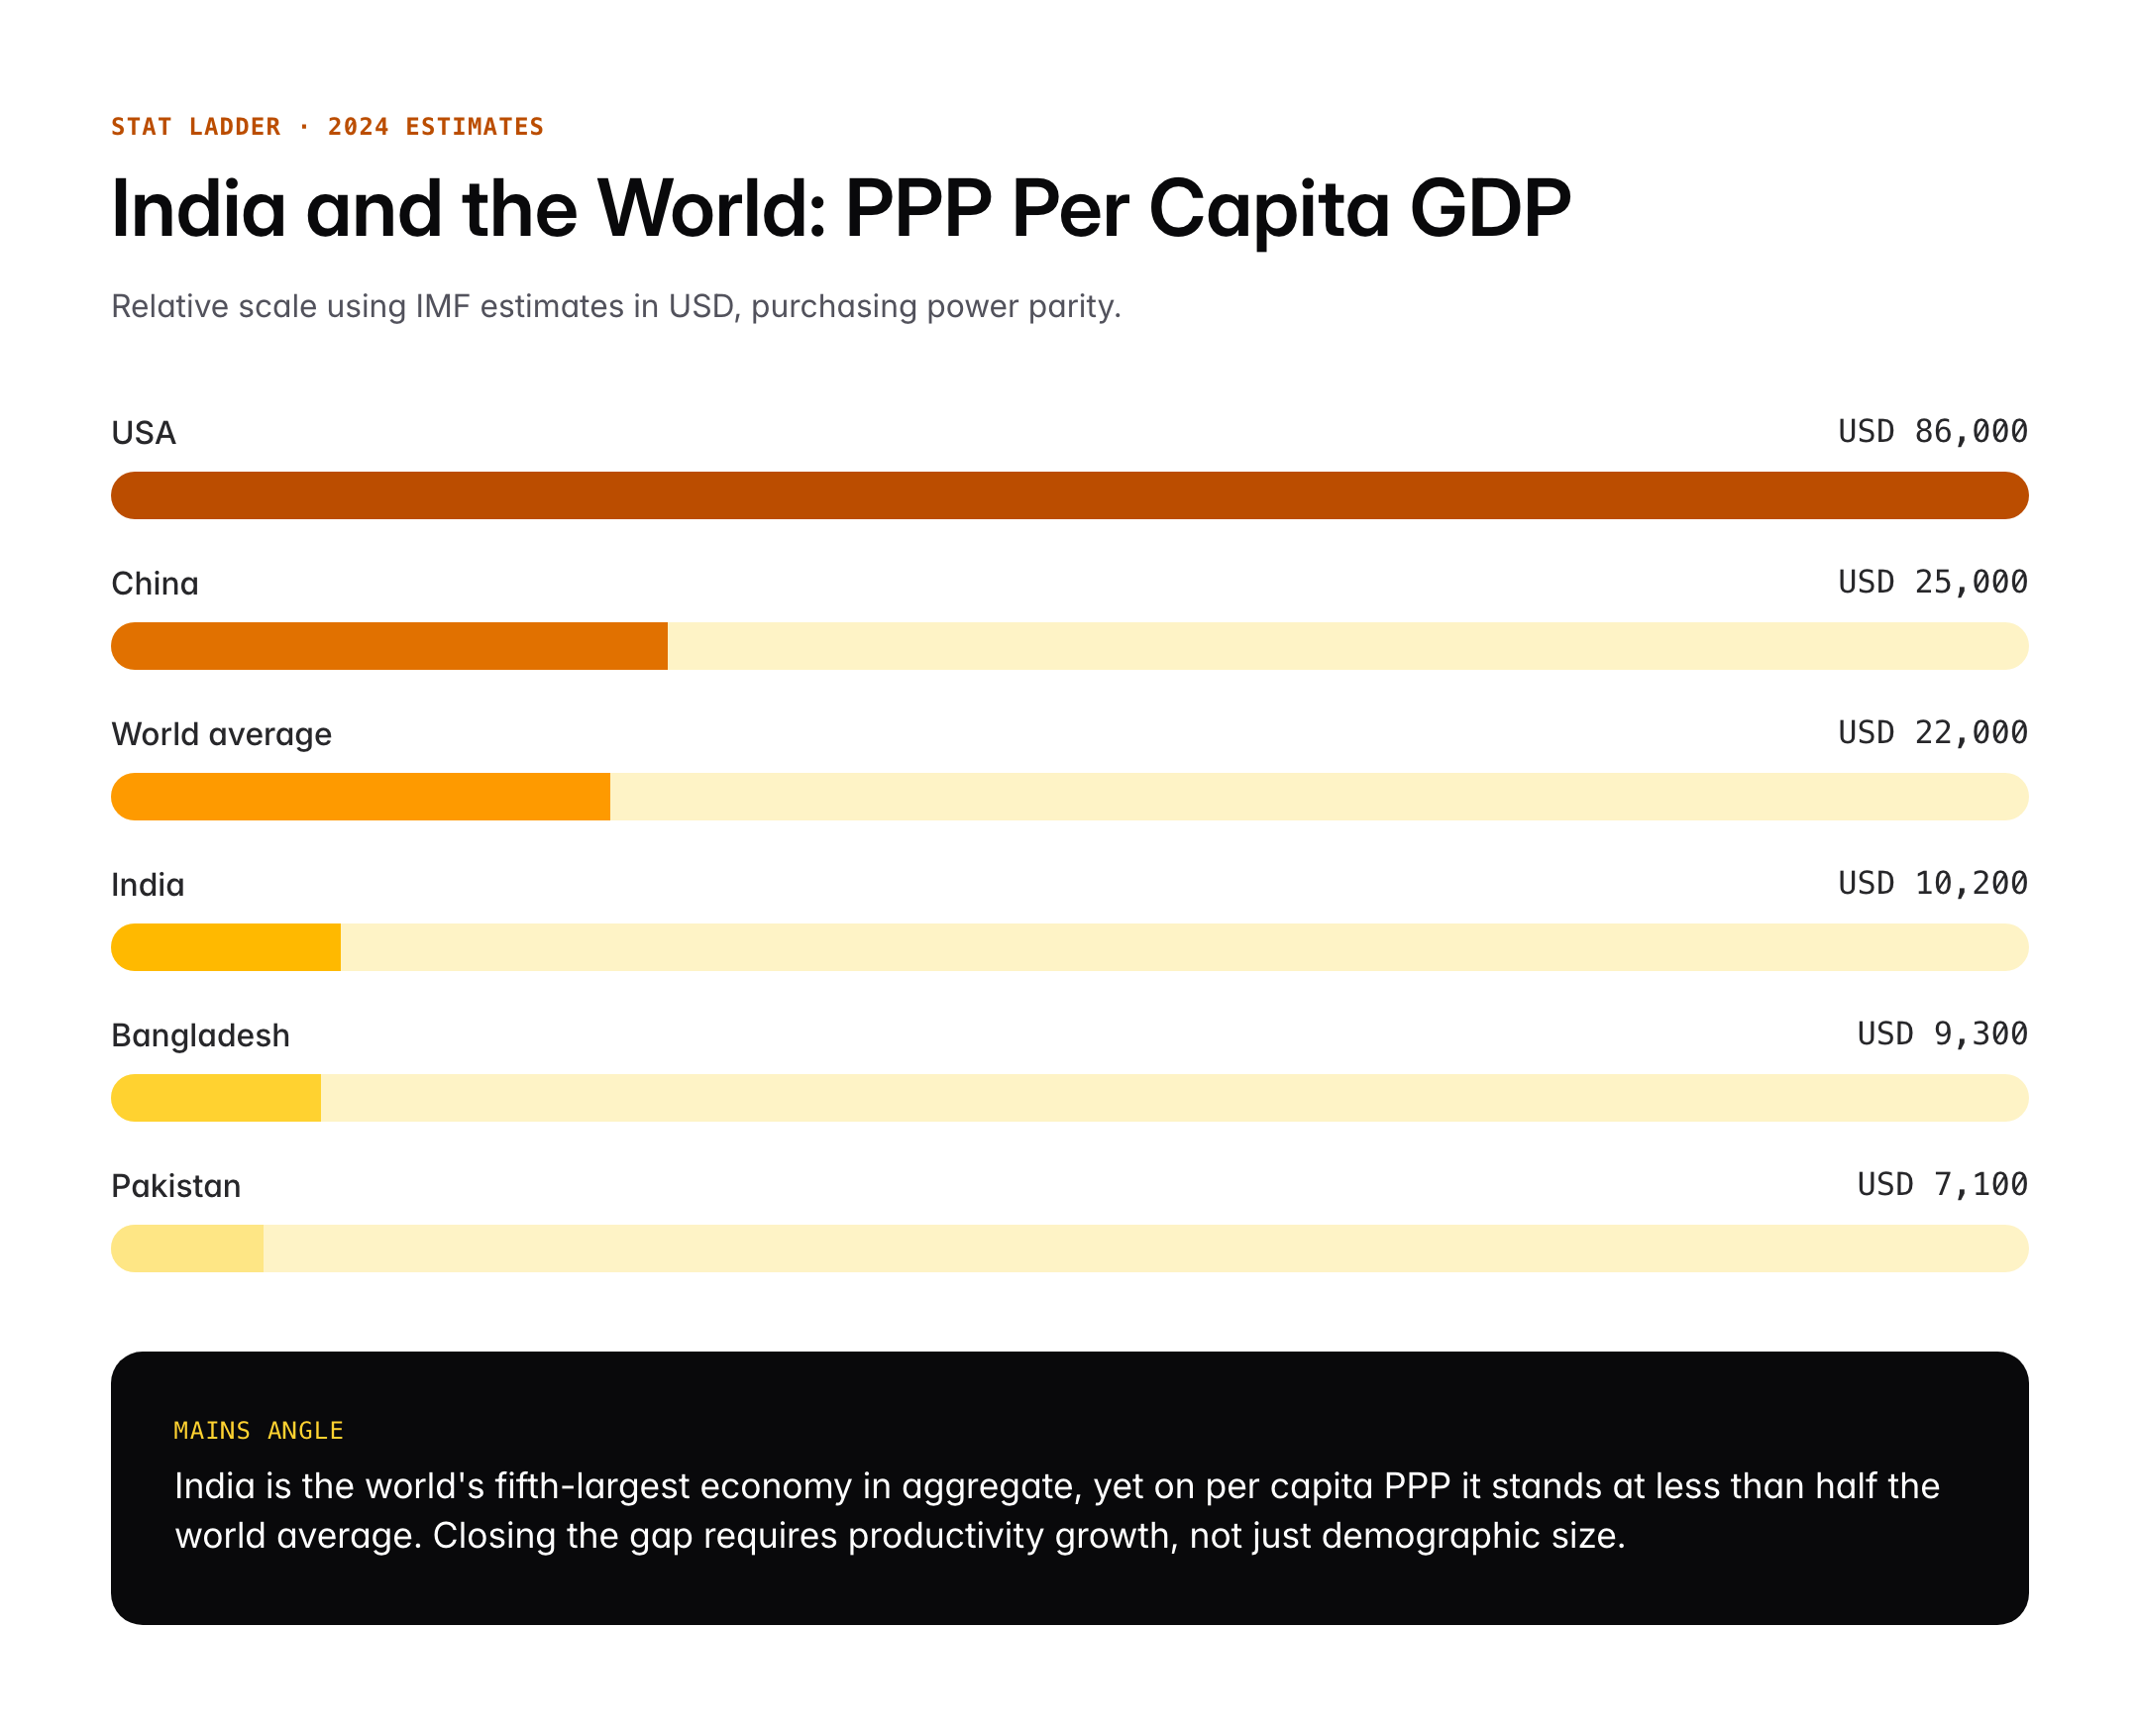
PPP data from the IMF show India’s per capita GDP at around USD 10,200 in 2024, still well below the world average of about USD 22,000 at PPP. Comparable figures for China are above USD 25,000 PPP, while Bangladesh has closed part of the gap over the last decade with around USD 9,300 PPP. India’s per capita figure remains modest at global scale even as the aggregate economy has become the fifth largest in the world.
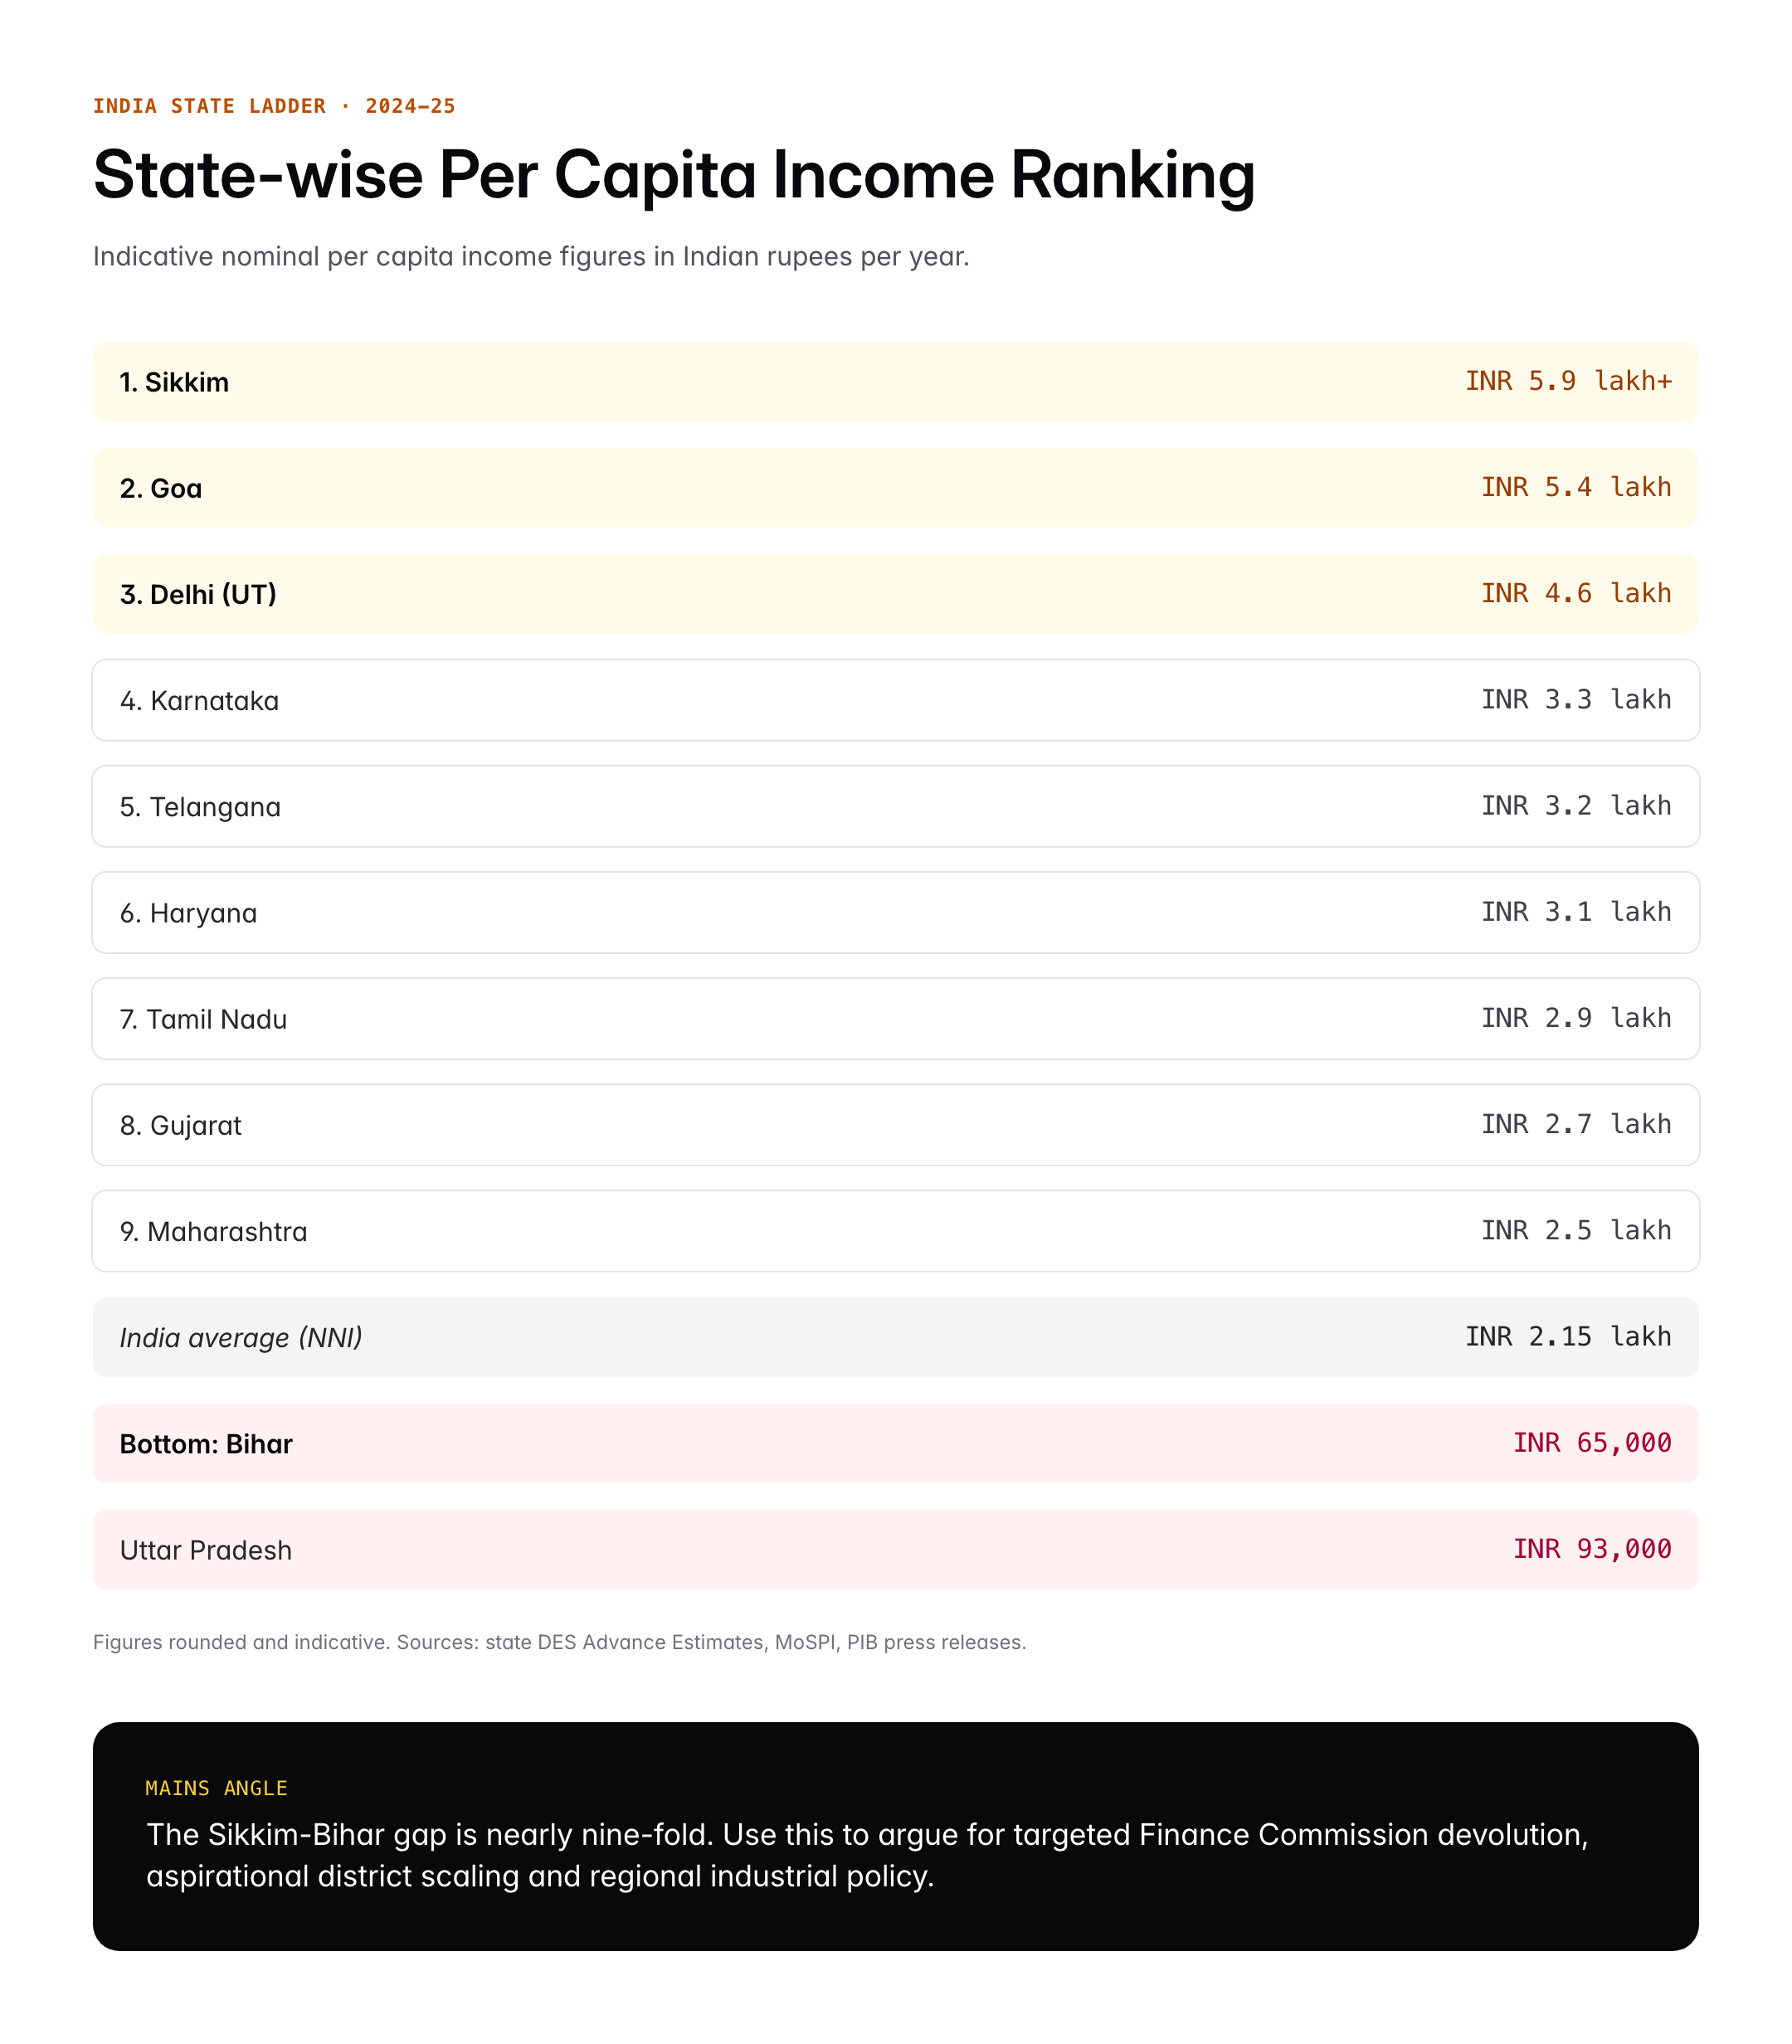
Behind the aggregate lies deep regional divergence. The small hill state of Sikkim records a per capita income several times that of Bihar. This spread has widened, not narrowed, over the reform period, raising questions for Finance Commissions and for the new NITI Aayog’s growth agenda.
Key Concepts and Formulas
Definition
Per capita income is the total national income divided by the total population over a specified period. The most widely cited Indian statistic is per capita Net National Income (NNI) at current prices, published by the National Statistical Office.
Core formula
Per capita income can be expressed as:
- Per capita NNI = Net National Income / Total Population
- Per capita GDP = Gross Domestic Product / Total Population
- Per capita GNI = Gross National Income / Total Population
Where NNI = GNI minus Consumption of Fixed Capital (depreciation). Each of these can be computed at current prices (nominal) or at constant prices (real, base year 2011-12 in India) and in rupees or in US dollars.
Nominal versus PPP
The nominal per capita figure converts the rupee value at the market exchange rate. The PPP figure uses a conversion factor that equalises the price of a common basket of goods. Because non-traded services are cheaper in India, PPP per capita is typically three to four times the nominal figure.
Real versus nominal
Real per capita income strips out inflation using a deflator. A rise in nominal per capita income of 9 per cent with inflation of 5 per cent implies a real per capita income growth of about 4 per cent.
Variants
Economists also use per capita household final consumption expenditure and per capita disposable income to capture how much households actually spend or can spend. The Human Development Index uses per capita Gross National Income in PPP USD.
Significance for UPSC and General Knowledge
- Indicator of the average economic well-being and a key input to the Human Development Index.
- Used by the Finance Commission in horizontal devolution; the Fifteenth Finance Commission gave 45 per cent weight to income distance.
- Used by the World Bank to classify countries as low, lower-middle, upper-middle or high income.
- Measures the growth of real incomes over time, feeding into the poverty line debate.
- Separates states into the Empowered Action Group and other categories for centrally sponsored schemes.
- Critical in UPSC Prelims for distinguishing GDP, GNI, NNI and per capita versions.
State-wise Distribution
India’s per capita income map shows a clear pattern. Small, tourism- or services-heavy states sit at the top. Sikkim leads among all states, thanks to pharmaceuticals, tourism and a small population. Goa follows with mining, tourism and a narrow demographic base. The National Capital Territory of Delhi is among the highest union territory per capita incomes driven by services and public administration. Southern and western states such as Karnataka, Telangana, Tamil Nadu, Haryana, Gujarat and Maharashtra cluster well above the national average, reflecting strong industrial and services bases.
At the bottom sit the BIMARU plus Jharkhand block, with Bihar consistently recording the lowest per capita income among major states. Uttar Pradesh, Jharkhand and Madhya Pradesh follow. Odisha has moved up thanks to minerals and the Paradip export corridor. The North-East is a mixed picture, with Sikkim, Mizoram and Arunachal Pradesh above the average and Assam and Manipur below it.
Economists use the ratio of richest to poorest state per capita income as a measure of regional disparity. In India this ratio today is several times, higher than the ratio between the richest and poorest provinces in China. The Raghuram Rajan Committee Report (2013) on backwardness and the subsequent Fifteenth Finance Commission deliberations used such measures to recommend higher devolution to low-income states. The reform-era divergence has persisted because investment tends to go where skills, roads, power and governance already exist, a pattern often called the club convergence effect. State-specific human capital and institutional reforms are required to break the cycle.
Comparative Perspective
| Country | Nominal per capita GDP (USD, 2024 est.) | PPP per capita GDP (USD, 2024 est.) |
|---|---|---|
| USA | around 86,000 | around 86,000 |
| China | around 13,100 | around 25,000 |
| India | around 2,700 | around 10,200 |
| Bangladesh | around 2,700 | around 9,300 |
| Pakistan | around 1,500 | around 7,100 |
| World average | around 13,900 | around 22,000 |
Figures are rounded IMF estimates and fluctuate with exchange rates and revisions. India’s nominal per capita GDP is close to Bangladesh’s, but PPP figures show India ahead because services and food prices are lower. Compared with China, India is more than two decades behind on PPP per capita. The United States still has a per capita GDP more than thirty times India’s at nominal exchange rates, illustrating the long journey ahead for the Viksit Bharat 2047 vision.
Challenges and Criticisms
Per capita income has serious limitations as a welfare measure. First, it is an average that hides distribution. India’s Gini coefficient for consumption is around 0.35, and for wealth far higher, meaning median income is well below the mean. Second, it ignores the informal economy. The National Statistical Office estimates informal employment at over 80 per cent of non-farm jobs, and household survey data often diverge from the National Accounts figures.
Third, per capita income says little about human development. Sikkim’s high per capita income does not mean it beats Kerala on literacy and health. Fourth, nominal comparisons with the United States or China are misleading because they ignore purchasing power differences. Fifth, measurement issues remain. The revision of GDP back-series to the 2011-12 base year in 2015 caused a debate on whether earlier growth rates were over or under-estimated.
The Committee on Real Sector Statistics under Sudipto Mundle and the NITI Aayog’s National Income working paper have urged the government to accelerate the new GDP base year revision, improve household consumption surveys and publish a regular poverty estimate. Until then, per capita income will remain a rough average open to varied political interpretation.
Prelims Pointers
- Per capita Net National Income (NNI) is the official headline Indian figure, released by the NSO under MoSPI.
- The current base year for real income series in India is 2011-12.
- GDP minus depreciation equals Net Domestic Product. NNP adds net factor income from abroad, then NNI equals NNP at factor cost.
- India is classified as a lower-middle-income country by the World Bank.
- Sikkim records the highest per capita income among states.
- Bihar records the lowest per capita income among major states.
- PPP per capita adjusts for differences in price levels across countries.
- HDI uses Gross National Income per capita at PPP US dollars.
- Fifteenth Finance Commission used 45 per cent weight for income distance criterion.
- World average per capita GDP in 2024 is around USD 13,900 nominal.
- The Raghuram Rajan Committee (2013) proposed a composite development index for state-level backwardness.
- The Committee on Real Sector Statistics (Mundle Committee) reviewed GDP estimation.
Mains Practice Questions
- Despite rapid growth in aggregate GDP, per capita income inequality across Indian states has widened. Examine the reasons and suggest policy measures.
- Bring out the divergence between Sikkim, Goa and Delhi on one side and Bihar, UP, Jharkhand on the other.
- Discuss drivers: investment, human capital, governance, connectivity.
- Suggest measures such as targeted Finance Commission grants, North-East capital expenditure and aspirational districts scaling.
- Critically evaluate per capita income as a measure of economic well-being. Should policymakers prefer alternative indicators?
- Explain limitations: averaging, informality, distribution, environment.
- Compare with HDI, Multidimensional Poverty Index, Gini coefficient.
- Suggest a dashboard approach anchored in the Sustainable Development Goals.
Conclusion
Per capita income remains the headline indicator of India’s journey from a low-income agrarian economy to an aspiring developed nation. Nominal per capita NNI around INR 2.15 lakh in 2024-25 reflects real progress since the reforms of 1991, but the gap with the world average, and especially with China, underscores the long road ahead.
For the UPSC aspirant, master the difference between GDP, GNI, NNI and their per capita versions, memorise the state-wise extremes, and connect the indicator to Finance Commission criteria, World Bank classification and the Viksit Bharat 2047 vision. A confident answer on per capita income blends statistics with structural analysis, a combination that scores in both Prelims and Mains.
Frequently Asked Questions
What is per capita income?
Per capita income is the total national income of a country divided by its population for a given period, usually a financial year. It represents the average income of a person in the economy and is commonly used as a rough indicator of living standards. In India the official headline figure is per capita Net National Income released by the National Statistical Office under MoSPI.
Why is per capita income important for UPSC?
Per capita income is a GS3 economy topic and a recurring Prelims question. It is the basis for World Bank income classification, the Finance Commission income-distance criterion that carries a 45 per cent weight in the Fifteenth Commission, the Human Development Index component and several centrally sponsored scheme allocations. It also links to poverty, inequality and regional disparity debates.
How is per capita income related to GDP?
Per capita GDP is obtained by dividing nominal or real Gross Domestic Product by the population. Per capita GNI adds net factor income from abroad, and per capita Net National Income subtracts depreciation. India’s headline measure is per capita NNI, but international comparisons typically use nominal or PPP per capita GDP. All three move in the same direction but can differ substantially in level.
What is India’s per capita income in 2024-25?
India’s nominal per capita Net National Income in 2024-25 is estimated at around INR 2.15 lakh at current prices, according to National Statistical Office data. Real per capita NNI at 2011-12 prices is around INR 1.14 lakh. Per capita GDP in nominal dollars is around USD 2,700 while PPP per capita GDP is around USD 10,200 per IMF estimates. Figures revise with each data release.
Which Indian state has the highest per capita income?
Sikkim records the highest per capita income among Indian states, driven by pharmaceutical manufacturing, tourism, hydropower and a small population base. Goa and the National Capital Territory of Delhi follow at the top of the table, while Karnataka, Haryana, Telangana, Tamil Nadu, Gujarat and Maharashtra rank well above the national average. Exact ranking varies by release year.
Which Indian state has the lowest per capita income?
Bihar consistently records the lowest per capita income among major Indian states. Uttar Pradesh, Jharkhand and Madhya Pradesh follow. This is a legacy of low industrialisation, lower human development indicators, and agrarian dependence. Policy responses include Finance Commission devolution, the North-East and BIMARU-focused capital expenditure push, and Aspirational Districts Programme interventions.
What is the difference between nominal and PPP per capita income?
Nominal per capita income converts income at the market exchange rate and reflects actual dollar earnings. PPP, or purchasing power parity, per capita income adjusts for differences in price levels, converting income using a common basket of goods. Because services and food are cheaper in India, its PPP per capita is roughly three to four times its nominal figure, putting it closer to the world average.
Is per capita income a good measure of development?
Per capita income is useful but limited. It averages across rich and poor, ignores distribution, excludes unpaid household work, and does not measure environment or human rights. Economists therefore complement it with the Human Development Index, the Multidimensional Poverty Index, the Gini coefficient and Sustainable Development Goal indicators. A dashboard approach captures well-being more accurately than per capita income alone.