Daily Digest
UPSC · Civil Services Examination
Current Affairs · Tuesday, 13 October 2026
Current affairs curated and edited by Anantam IAS faculty — pulled from The Hindu, PIB, IDSA, Foreign Affairs and the ministries. Read, annotate, revise.
Old Rajinder Nagar · Delhi 110005 · anantamias.com
Healthcare Rate Display: Transparency and State Enforcement
Why in News?
On October 12, 2026, the Union Health Secretary asked states and Union Territories to strengthen compliance with applicable rules on displaying healthcare service rates.
- The letter asks Chief Secretaries to review compliance and issue appropriate advisories through the authorities concerned.
- It stresses visible, accessible rate information for patients and attendants at clinical establishments.
- States are also asked to encourage international patient package-rate disclosure, wherever applicable, for visitors on Medical or Ayush Visas.
- Patients need cost information before decisions; an unexplained final bill arrives too late to support meaningful comparison.
- The issue connects patient protection with state enforcement capacity, rather than establishing a single national treatment price.
UPSC Relevance
Prelims Relevance
- Clinical Establishments (Registration and Regulation) Act, 2010.
- Clinical Establishments (Central Government) Rules, 2012.
- Applicable rules require conspicuous rate display in the local language and English.
- State and Union Territory authorities implement applicable regulatory provisions.
Mains Relevance
GS Paper 2
- Health governance: patient information, accountability and financial protection.
- Federal implementation: common policy objectives operating through different applicable regulatory frameworks.
Essay
- Access to information strengthens choice, but does not guarantee affordability.
Background and Context
What Does the Existing Framework Require?
The letter reinforces existing obligations; the applicable legal framework must be identified before judging whether an establishment complies.
- According to the Health Ministry release, the 2010 Act and 2012 Rules provide the cited framework. The letter seeks effective implementation, rather than announcing a newly enacted nationwide pricing law.
- Where that Act applies, the Rules require rates for each service and facility to be displayed conspicuously. A patient should be able to locate the information without depending entirely on an oral quotation.
- The release specifies display in the local language and English. This makes language accessibility part of the cited obligation, alongside visibility; a technically present display may still be difficult for patients to use.
- Where the Act does not apply, establishments fall under respective state or Union Territory frameworks. The release says several also contain rate-display provisions; it does not establish that every jurisdiction has identical requirements.
- The Ministry identifies states and Union Territories as responsible for implementation and enforcement of applicable provisions. Sending the letter to every Chief Secretary does not itself extend the central Act to every establishment.
How Can Rate Disclosure Help Patients?
Disclosure reduces the information gap between the provider quoting a service and the household deciding how to pay for care.
- Information asymmetry arises when providers know more about treatment and charging practices than patients. Visible service rates give households a starting point for questions, even when they cannot independently judge clinical necessity.
- For planned care, advance price information can help families compare providers and estimate expenditure. The comparison remains meaningful only when the quoted services are similar; differently defined packages can conceal very different coverage.
- A package rate needs understandable boundaries to support choice: what is included, what is excluded and when extra charges may arise. These are practical disclosure improvements, not new requirements announced by this letter.
- Billing disputes can be easier to examine when a patient can compare a quoted charge with the final bill. A displayed rate alone does not explain additional services, treatment changes or contested charges.
- For international patients, the letter encourages package-rate display wherever applicable. This can support decisions before travel, but the source describes an encouragement to states, not a newly imposed universal package-price regime.
Why Is Disclosure Different From Price Control?
A visible price improves information; its visibility alone neither fixes the price nor proves that treatment has become affordable.
- Rate disclosure tells patients what a provider charges. Price regulation constrains what may be charged under its operative rules; the October letter does not announce a uniform national tariff for medical treatment.
- The distinction matters alongside cancer medicine price protection: medicine margin regulation targets a pricing mechanism, while this initiative targets service-charge information. Neither measure alone establishes the total cost of a hospital episode.
- Emergency care illustrates the limits of comparison: a patient may lack time or nearby alternatives to act on displayed information. Disclosure is useful, but cannot substitute for access, appropriate care or financial protection.
- Implementation quality should be assessed through information patients can actually use. An outdated board, inaccessible location or unclear service description can weaken transparency even when an establishment appears to have a rate list.
- The release presents fewer disputes and better-informed choices as intended benefits. It provides no measured reduction in bills or complaints; evaluating results requires evidence beyond the issuance of an advisory or installation of displays.
Way Forward
Make Disclosure Usable and Accountable
- Authorities should first identify the applicable framework, then check visibility, language accessibility and whether displayed information remains current.
- Providers should explain package inclusions and exclusions clearly and make comparable information available before planned treatment decisions.
- Enforcement reviews should examine patient complaints and billing discrepancies, separating evidence of compliance from evidence that patients can use the information.
Conclusion
- Healthcare transparency begins with usable information about service charges and continues through accountable implementation. The October letter reinforces applicable rules; it should not be presented as a universal national tariff or proof of lower bills.
- A balanced assessment separates disclosure, affordability and enforcement. States must implement the relevant framework, while the practical value of displayed rates depends on understandable information and patients having meaningful opportunities to use it.
UPSC Practice Questions
Prelims MCQ 1
With reference to the October 2026 healthcare rate-display letter, consider the following statements:
- It seeks compliance with applicable regulatory provisions.
- Where the cited Act applies, rates must be displayed in the local language and English.
- The letter creates a uniform national tariff for all hospital services.
How many of the above statements are correct?
(a) Only one (b) Only two (c) All three (d) None
Answer: (b) Only two
Explanation:
The Health Ministry release supports statements 1 and 2. Statement 3 is incorrect: the letter reinforces applicable disclosure rules and does not announce a uniform national treatment tariff.
Prelims MCQ 2
Which situation best demonstrates a limitation of healthcare rate disclosure?
(a) A displayed rate automatically removes all information asymmetry. (b) A patient in an emergency may be unable to compare providers despite visible rates. (c) Publishing service rates necessarily fixes the maximum permissible treatment price. (d) Every displayed package necessarily includes all possible treatment expenses.
Answer: (b) A patient in an emergency may be unable to compare providers despite visible rates.
Explanation:
Information can support choice without guaranteeing the ability to act on it. Urgency and limited alternatives constrain comparison; disclosure alone neither caps prices nor establishes package inclusions.
UPSC Mains Questions
- Explain how healthcare rate disclosure can reduce information asymmetry. Why is it insufficient by itself to ensure affordable care?
- Discuss the implementation challenges of healthcare price transparency when clinical establishments operate under different applicable state regulatory frameworks.
Source: PIB, Ministry of Health and Family Welfare.
Frequently Asked Questions
Does the October letter create a national hospital tariff?
No. The letter seeks compliance with applicable rate-display provisions. It does not announce a uniform national treatment tariff or establish that every hospital must charge the same amount.
Does the Clinical Establishments Act apply everywhere?
The release distinguishes jurisdictions where the Act applies from those governed by their respective state or Union Territory frameworks. Addressing every Chief Secretary does not make the central Act universally applicable.
What language must the displayed rates use?
Under the Rules cited by the Ministry, establishments where the Act applies must display service and facility rates conspicuously in the local language and English, for patients and their attendants.
Why does the letter mention international patients?
It asks states to encourage prominent package-rate display wherever applicable for visitors on Medical or Ayush Visas. The stated aim is informed choice and fewer pricing or billing grievances.
Does disclosure guarantee lower treatment costs?
No. Disclosure helps patients understand and compare charges, but does not itself reduce them. Affordability also depends on the price level, available alternatives, treatment needs and financial protection.
Source: https://anantamias.com/current-affairs/clinical-establishment-rate-display-state-enforcement/
Cyclone Decision Support: Reading Tracks and Multiple Hazards
Why in News?
On 12 October 2026, IMD launched its Cyclone Warning and Marine Weather Services Decision Support System to bring cyclone forecasts and hazard information together.
- The WebGIS platform presents cyclone tracks, intensity, winds, rainfall, storm surge and rainfall forecasts for river catchments through interactive maps.
- Demonstrations showed the cone of uncertainty alongside district rainfall warnings, with additional views displaying wind distribution and storm surge warnings.
- The launch accompanied the pre-cyclone exercise for the post-monsoon season; disaster authorities, technical agencies and other operational users participated.
- The system is publicly accessible through IMD and RSMC New Delhi websites. The announcement does not report measured disaster-loss reductions attributable to it.
- A cyclone track answers where the storm centre may move; it cannot alone show every place exposed to damaging weather.
- Combining hazard layers helps users consider different threats together, but local response still depends on exposure, vulnerability and practical options.
UPSC Relevance
Prelims Relevance
- India Meteorological Department
- WebGIS and decision support
- Cone of uncertainty
- Storm surge versus rainfall flooding
- River catchment rainfall forecasts
Mains Relevance
GS Paper 3
- Interpreting cyclone forecasts for multi-hazard preparedness
- Connecting scientific warnings with protective action
GS Paper 2
- Coordination between technical agencies and local disaster authorities
Essay
- Acting responsibly under uncertainty requires both scientific information and capable public institutions.
Background and Context
What an Integrated Cyclone Map Adds
The system places related forecasts in one geographic view, helping users compare hazards that require different decisions before a cyclone reaches the coast.
- A decision support system organizes information for users assessing a developing situation. IMD’s platform combines cyclone and marine weather products; the announcement does not describe an automatic evacuation authority or a replacement for local administration.
- Observed tracks describe where the cyclone has been, while forecast tracks describe its expected movement. Reading them separately avoids treating a projected location as something already measured or a future path as a certainty.
- The platform displays intensity and wind distribution alongside the track. Their separate presentation matters: knowing the centre’s projected location does not, by itself, identify the spatial extent of potentially damaging winds around the storm.
- District rainfall warnings and catchment rainfall forecasts provide different spatial perspectives. One supports area-based communication; the other helps users consider rain falling across the land draining toward a river, beyond an individual coastal location.
- Like weather observations and early warning, a shared map supports interpretation. Its practical value should be assessed through the decisions it improves, rather than simply the number of layers displayed on screen.

Why the Cone Is Not a Safety Boundary
Track uncertainty and hazard extent describe different things; confusing them can make a place outside the cone appear safer than the warning evidence supports.
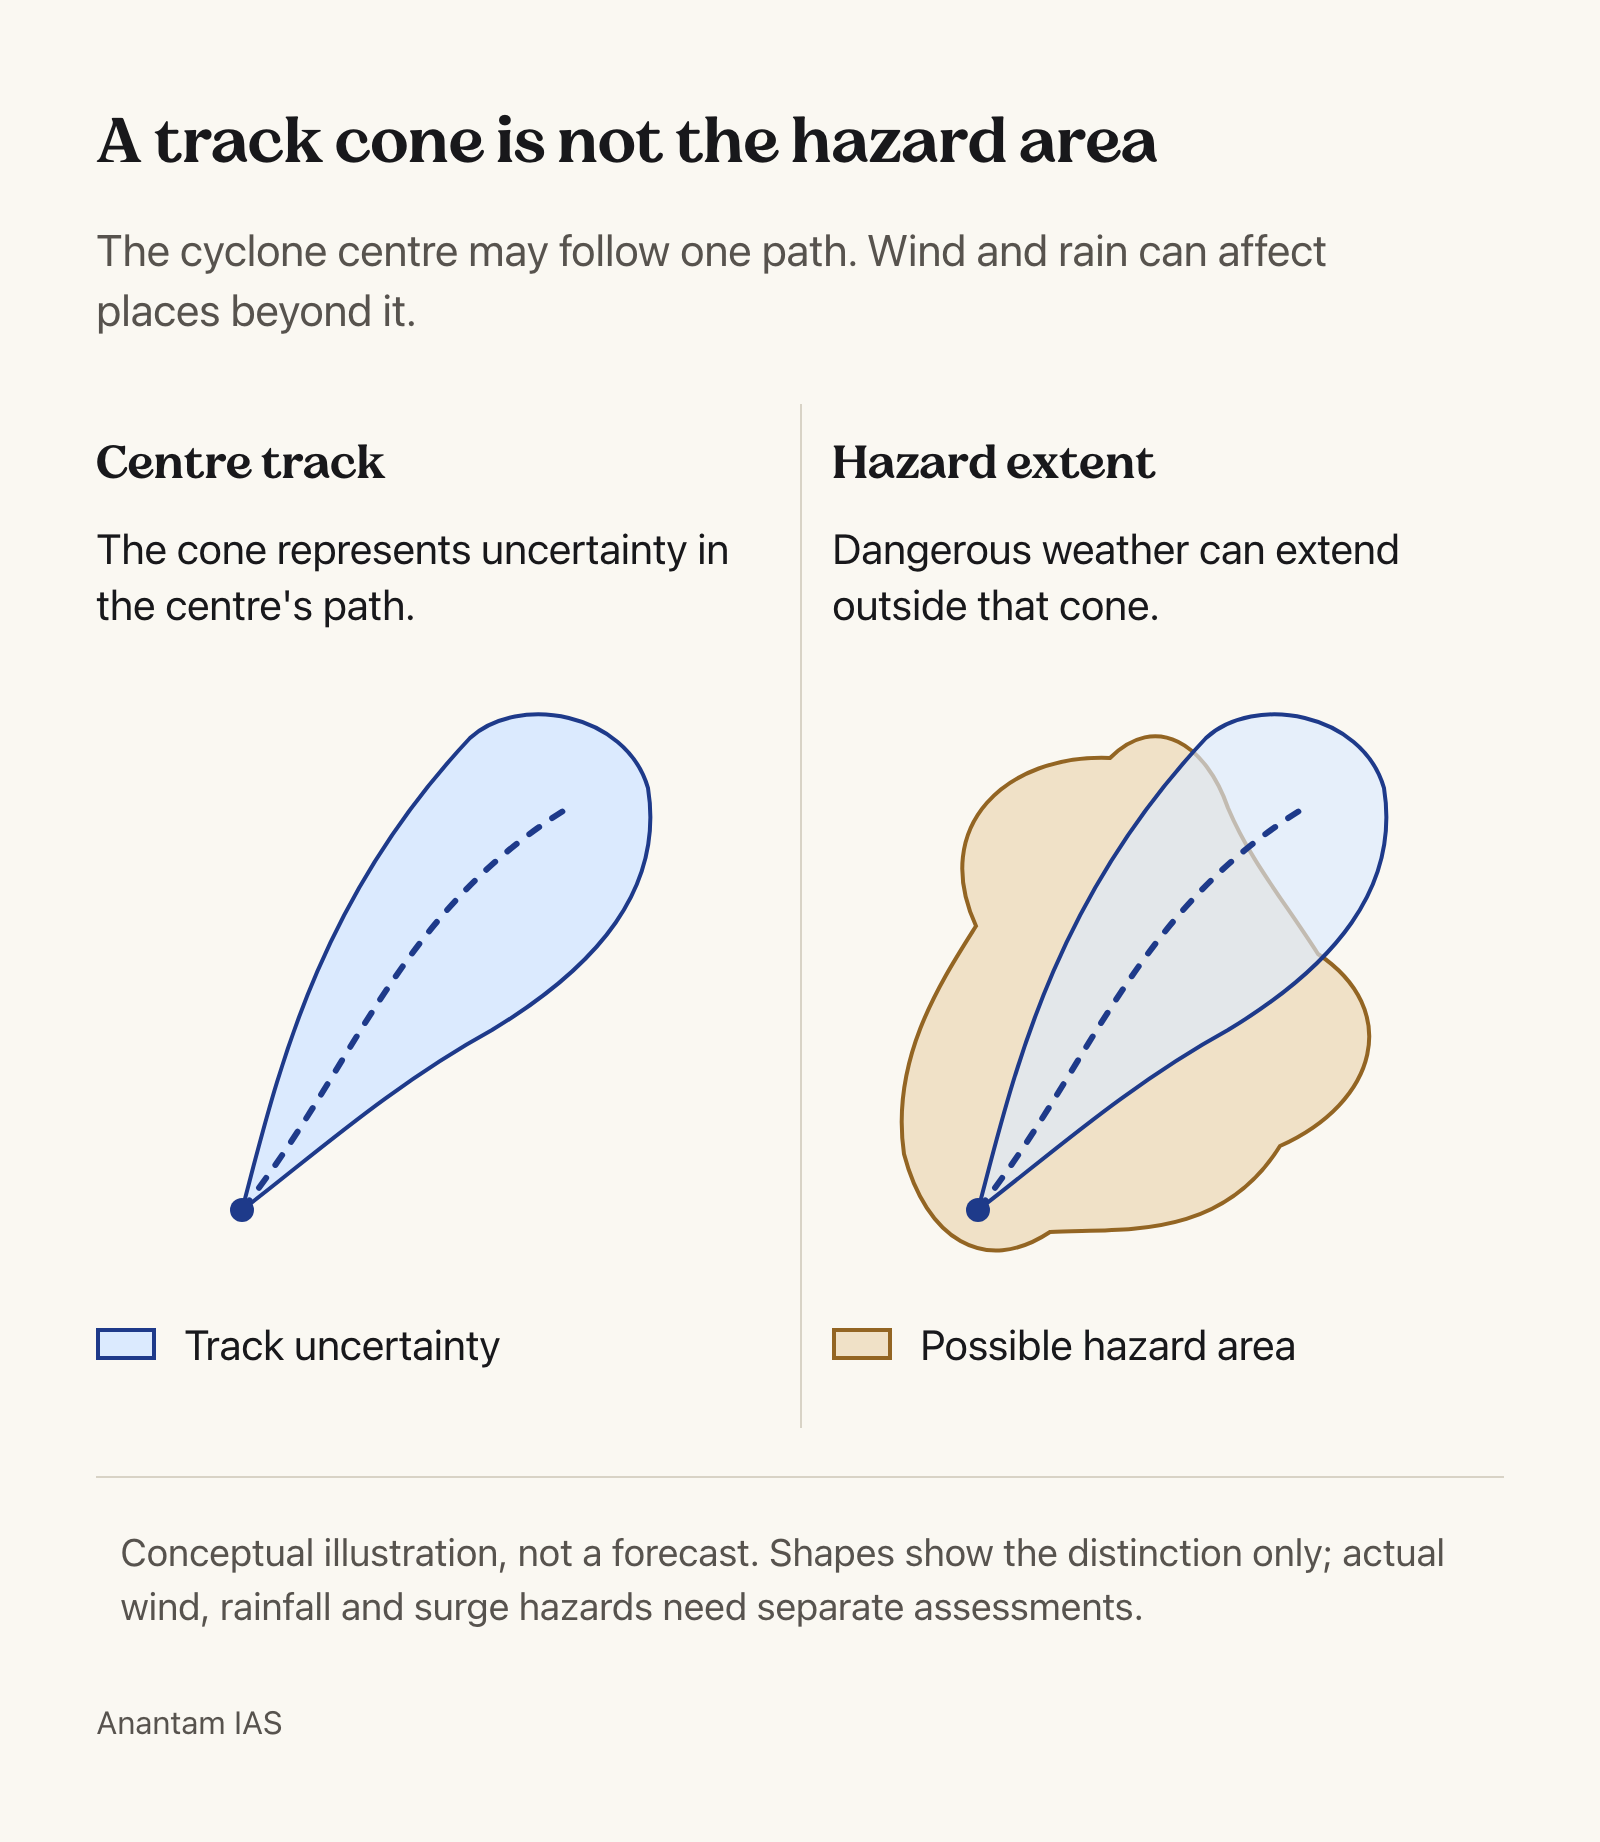
- The cone of uncertainty concerns the possible path of the cyclone’s centre. It is not an outline of the storm itself, nor a map containing every location that could experience damaging weather during its passage.
- Official track-cone guidance distinguishes centre-track uncertainty from the storm’s size. Wind and rainfall hazards can extend beyond that track envelope, so being outside it does not establish that a settlement faces no threat.
- Storm surge involves cyclone-driven seawater affecting the coast. It differs from flooding caused by heavy rainfall; a warning assessment should identify the water source instead of treating every flooded location as a surge impact.
- WMO identifies torrential rainfall as a cause of flooding and possible landslides. This explains why preparedness cannot end with the expected coastal crossing point: inland communities may also face substantial hazards from the same cyclone.
- Read track, wind, rainfall and surge products together for the location concerned. A plausible centre path is only part of the assessment; each hazard layer supplies information that the centre line cannot communicate by itself.
How Forecasts Should Inform Local Decisions
The following are preparedness principles, not newly announced operating rules or evidence that every district has already implemented an effective response plan.
- Combine hazard information with knowledge of exposed settlements, infrastructure and people needing assistance. A forecast of dangerous weather becomes useful for action when authorities understand what lies in its potential path and who needs support.
- Check the forecast’s issue time before interpreting a saved map or forwarded screenshot. Decisions should use current official updates, because an earlier picture may no longer represent the assessment available to the responsible warning agencies.
- Assess overlapping hazards when choosing routes and shelters. For example, a proposed response should account for both coastal flooding and heavy rain, rather than assuming a location suitable for one threat is suitable for all.
- The lesson from dam emergency action plans is relevant: technical information needs an operational handoff. Authorities should connect the forecast with clear public instructions, responsible recipients and arrangements for people who cannot move independently.
- Judge the system through usable warning and response: whether relevant users understand the forecast and can act in time. A successful launch demonstrates availability, while claims of improved outcomes require evidence from subsequent operational use.
Way Forward
Rehearse Decisions Using All Relevant Hazards
- Use scenario exercises that change track, rainfall and surge assumptions; check whether local plans adapt without treating the cone as an evacuation boundary.
- Make public instructions specific about affected locations, required action and reliable updates; test whether recipients understand them before severe weather disrupts communication.
- Review warning-to-action delays after exercises and events, assigning corrections to named agencies instead of treating platform access alone as preparedness.
Conclusion
- Integrated cyclone warnings are useful when users distinguish the probable centre track from the wider distribution of hazards and connect both with local exposure and vulnerability.
- The strongest disaster-management argument links forecast interpretation, multi-hazard planning and protective action. A new information platform supports that chain, but its launch alone cannot establish that disaster losses have fallen.
UPSC Practice Questions
Prelims MCQ 1
With reference to cyclone forecast interpretation, consider the following statements:
- A track cone concerns uncertainty in the cyclone centre’s path.
- Damaging weather can occur outside the track cone.
- The track cone alone defines the full extent of storm surge flooding.
How many of the above statements are correct?
(a) Only one (b) Only two (c) All three (d) None
Answer: (b) Only two
Explanation:
The first two statements are correct. Track uncertainty and hazard extent differ; storm surge requires its own hazard information.
Prelims MCQ 2
Which approach best uses an integrated cyclone decision support system?
(a) Treat the forecast centre line as the complete hazard zone (b) Assume every district outside the cone is safe (c) Combine relevant hazard layers with local exposure and response arrangements (d) Treat a map display as an automatic evacuation order
Answer: (c) Combine relevant hazard layers with local exposure and response arrangements
Explanation:
Integrated forecasts support decisions when interpreted with local conditions and response capacity. Neither the centre line nor the cone represents every hazard.
UPSC Mains Questions
- Explain why a cyclone track forecast cannot substitute for multi-hazard preparedness. Illustrate with wind, rainfall and storm surge.
- How can decision support systems improve cyclone preparedness? Discuss the institutional steps needed to translate forecast information into protective action.
Sources: PIB, Ministry of Earth Sciences and World Meteorological Organization.
Frequently Asked Questions
What did IMD launch on 12 October 2026?
IMD launched a WebGIS-based Cyclone Warning and Marine Weather Services Decision Support System. It brings cyclone tracks, intensity, winds, rainfall, storm surge and catchment rainfall forecasts into an interactive platform.
Does being outside the cyclone cone mean a place is safe?
No. The cone concerns uncertainty in the cyclone centre’s track, rather than the full storm or all its hazards. Users must also consult relevant wind, rainfall and storm surge warnings.
How does storm surge differ from rainfall flooding?
Storm surge concerns cyclone-driven seawater affecting coastal areas. Rainfall flooding results from rain and the resulting accumulation or movement of water. Both hazards can matter during the same cyclone.
Does the decision support system automatically order evacuation?
The announcement describes a platform that supports informed decisions. It does not establish automatic evacuation orders. Protective action still requires responsible authorities to interpret warnings alongside local exposure and response arrangements.
Source: https://anantamias.com/current-affairs/cyclone-marine-dss-multihazard-warning-decisions/
Economics Nobel: Household Decisions and Policy Expectations
Why in News?
On 12 October 2026, the Royal Swedish Academy of Sciences awarded the Economics Nobel to Robert E. Hall and Michael Woodford for microeconomic foundations of macroeconomic stabilisation.
- The formal award is the Sveriges Riksbank Prize in Economic Sciences in Memory of Alfred Nobel.
- Robert E. Hall and Michael Woodford were recognised for rebuilding stabilisation models around decisions by individual households and businesses.
- The Academy highlighted forward-looking behaviour: expectations about future policy can influence saving and price decisions today.
- Stabilisation policy seeks to moderate economic fluctuations; its success depends on how people respond to its instruments.
- The useful question is whether a measure changes resources, incentives or expectations, and which households or firms can act on that change.
UPSC Relevance
Prelims Relevance
- Microfoundations: explaining economy-wide outcomes through individual decisions and constraints.
- Consumption smoothing: spreading spending across time instead of following each income fluctuation.
- Liquidity constraint: insufficient readily available funds or borrowing capacity to support desired spending.
- Sticky prices: prices that do not adjust immediately to changing conditions.
- Expectations: beliefs about future conditions that affect present choices.
Mains Relevance
GS Paper 3
- How household constraints affect stabilisation policy.
- Why credible communication matters alongside monetary and fiscal instruments.
Essay
- Public policy works through human decisions, not merely administrative announcements.
Background and Context
Why Individual Decisions Matter
A national consumption total combines many household choices, each shaped by resources, expectations and limits on available options.
- Microfoundations start with how households allocate resources and firms choose prices, then connect these decisions to economy-wide outcomes. The objective is to explain behaviour, rather than merely record variables moving together.
- Forward-looking behaviour means that decisions reflect anticipated conditions as well as current circumstances. A household assessing future resources or a firm considering future demand may respond before those changes actually arrive.
- Policy announcements can change the information entering these decisions. A measure’s effect depends partly on what people believe will follow, making communication relevant even before every planned action has been implemented.
- Aggregation connects individual choices to total spending and production, but does not erase differences among people. Similar national outcomes can conceal households facing very different constraints and making different adjustments.
- Model discipline means specifying the assumptions behind a predicted response. An explanation should identify who changes behaviour, why that change is feasible, and how the decisions affect the wider economy.
Consumption Smoothing Has Limits
Households may plan spending over time, but a plan requires accessible resources to become an actual purchase.
- Consumption smoothing describes using saving or borrowing to avoid sharp spending changes when income fluctuates. It distinguishes the timing of income receipts from the timing of purchases a household would prefer.
- Future income expectations enter a forward-looking household’s spending plan alongside current resources. This makes anticipated circumstances relevant today, without implying that expectations provide either certain income or immediately spendable money.
- A liquidity constraint limits this adjustment: a household may expect better income but lack cash or borrowing access today. Its desired spending and affordable spending can remain far apart despite that expectation.
- Wealth and liquidity are different. Owning an asset does not necessarily make funds available for immediate purchases; the Federal Reserve’s household research identifies spending differences even among wealthier households with limited liquid assets.
- Unequal spending responses matter for policy design. An identical income gain need not generate identical consumption across recipients, so judging support requires attention to household circumstances rather than assuming one universal response.

Price Setting and Credible Expectations
Businesses also look ahead, while delays in price adjustment make the timing and credibility of policy relevant.
- Sticky prices adjust infrequently rather than instantly whenever conditions change. Firms setting such prices must consider the period ahead, making their expectations relevant to the prices buyers face in the present.
- Expected inflation can influence price-setting behaviour. Assessing inflation requires attention to what firms believe about future conditions, alongside the prices already recorded in statistical releases and the shocks affecting costs.
- Credible communication helps policy influence expectations when people believe the announced approach. The Academy’s explanation treats communication as part of stabilisation, because savings and product-price decisions depend partly on views of the future.
- Monetary transmission is the next step: changed policy and expectations must affect economic decisions. The separate RBI rate-transmission note follows this practical channel; here, the focus is the behavioural foundation behind it.
- Stabilisation is conditional: models help assess responses to shocks, but their usefulness depends on assumptions matching circumstances. Neither forward-looking behaviour nor an announced policy guarantees that every household or business responds identically.
Way Forward
Match Instruments to Behaviour
- Check constraints: distinguish households able to adjust saving from those whose immediate spending depends on accessible funds.
- Explain the policy logic: connect announced actions to the conditions that would change the response, helping households and businesses interpret future decisions.
- Compare predictions with evidence: examine actual spending and price-setting responses before assuming that a model’s average household represents everyone.
Conclusion
- The central lesson is that stabilisation policy operates through household and business decisions. Explaining these choices makes the connection between an official announcement and an economy-wide outcome more concrete and open to examination.
- A balanced assessment connects expectations with actual capacity to respond. Consumption smoothing explains a possible adjustment; liquidity constraints explain why the adjustment may be limited, uneven or unavailable to some households.
UPSC Practice Questions
Prelims MCQ 1
With reference to macroeconomic microfoundations, consider the following statements:
- They connect individual household and business decisions to economy-wide outcomes.
- Forward-looking behaviour means future expectations can influence present decisions.
- They require all households to have unrestricted access to borrowing.
How many of the above statements are correct?
(a) Only one (b) Only two (c) All three (d) None
Answer: (b) Only two
Explanation:
The first two statements are correct. Liquidity constraints can limit borrowing and consumption smoothing; unrestricted borrowing is not required for every microfounded model.
Prelims MCQ 2
Which situation best illustrates a liquidity constraint?
(a) A household has sufficient accessible savings for its preferred spending. (b) A firm changes a product’s price immediately after a cost change. (c) A household expects higher future income but lacks cash or borrowing access for a necessary purchase today. (d) A household voluntarily saves despite having sufficient funds for current purchases.
Answer: (c) A household expects higher future income but lacks cash or borrowing access for a necessary purchase today.
Explanation:
The household’s spending is restricted by available funds and borrowing capacity. Expected future income alone does not remove that constraint.
UPSC Mains Questions
- How do microeconomic foundations improve the analysis of macroeconomic stabilisation policy? Discuss with reference to household consumption and business price setting.
- Policy communication can influence expectations, but its effects depend on people’s capacity to respond. Examine with reference to consumption smoothing and liquidity constraints.
Sources: Royal Swedish Academy of Sciences / NobelPrize.org and Royal Swedish Academy of Sciences.
Frequently Asked Questions
What did the 2026 Economics Nobel recognise?
The award recognised Robert E. Hall and Michael Woodford for microeconomic foundations of macroeconomic stabilisation: models connecting individual household and business decisions with economy-wide fluctuations and policy responses.
What is consumption smoothing?
Consumption smoothing means spreading spending across time rather than allowing every income fluctuation to cause an equally sharp consumption change. Saving or borrowing can support this adjustment, subject to available resources.
Why does liquidity matter even when a household owns assets?
Assets may not be readily available for immediate purchases. A household can own wealth but lack accessible funds or borrowing capacity, limiting its ability to maintain desired spending when current income changes.
How do expectations affect stabilisation policy?
Households and businesses consider future conditions when making present decisions. Credible policy communication can influence these expectations, but the resulting spending and price responses also depend on constraints and economic circumstances.
Source: https://anantamias.com/current-affairs/economics-nobel-consumption-expectations-stabilisation/
India–UK JETCO: Measuring Use of Trade Preferences
Why in News?
India and the UK agreed at JETCO on October 12, 2026, to monitor CETA preference utilisation through annual data exchanges and business feedback.
- The joint statement says the Comprehensive Economic and Trade Agreement has entered into force; it reports early preferential shipments in both directions.
- Annual data exchange will begin one year after entry into force, covering use of lower tariffs alongside firms’ implementation feedback.
- Both governments agreed a plan for committees, working groups and contact points; the statement does not establish that every body is already operational.
- A negotiated tariff concession helps a business only when its goods qualify and the preference can be claimed without disproportionate compliance costs.
- The implementation question differs from domestic value retained from exports: preference utilisation asks whether eligible trade actually receives the concession.
UPSC Relevance
Prelims Relevance
- JETCO: Joint Economic and Trade Committee.
- CETA: Comprehensive Economic and Trade Agreement.
- Preference utilisation: use of available preferential tariffs.
- Rules of origin: criteria determining a product’s originating status.
- Tariff-rate quota: lower duty within a specified import quantity.
Mains Relevance
GS Paper 3
- Trade facilitation: compliance costs and small exporters’ access to tariff preferences.
- Policy evaluation: separating eligibility, utilisation and wider economic outcomes.
GS Paper 2
- Bilateral institutions: turning treaty commitments into continuing administrative cooperation.
Essay
- Implementation determines how far formal opportunities become practical access.
Background and Context
What Does Preference Utilisation Measure?
Preference utilisation follows the concession into the customs declaration, revealing a gap that headline bilateral trade totals cannot explain.
- A preferential tariff is a lower import duty available under a trade arrangement. Its advantage depends on the applicable ordinary duty: a concession offers little immediate saving where that alternative is already low.
- The standard utilisation rate compares the value of imports receiving preferences with the value eligible for them. Using all bilateral imports as the denominator would mix covered opportunities with goods outside that opportunity.
- Eligibility and use answer separate questions: is a lower rate available for this product and partner, and did the shipment receive it? Trade can expand while businesses still leave available concessions unclaimed.
- The UK methodology uses customs information to distinguish tariff regimes. Analysts should check coverage and comparable definitions before interpreting changes; a different composition of traded goods can change an aggregate utilisation rate.
- A high rate establishes take-up among eligible trade, not that an agreement caused export growth or higher employment. Those outcomes require separate evidence and consideration of demand, exchange rates and other influences.
How Do Origin Rules Affect a Claim?
A shipment’s departure point does not by itself establish originating status; production and the applicable product rule matter.
- Rules of origin determine which goods qualify as originating under an agreement. They prevent goods from an unrelated country obtaining preferences merely by passing through a partner, while allowing qualifying production to benefit.
- The CETA origin chapter sets product criteria and proof requirements. Imported inputs do not automatically disqualify a manufactured good; the relevant product-specific rule determines whether the processing or material requirements are met.
- For an illustrative garment exporter, production records connect materials and manufacturing to the origin claim. Packing clothing in an Indian warehouse alone cannot establish eligibility; exporters must examine the rule applicable to that garment.
- The joint statement reports early self-certified origin documentation supporting Indian exports. Self-certification changes how proof is provided; it does not remove the need to meet origin conditions or the possibility of customs verification.
- Compliance costs include understanding rules and assembling evidence. As the WTO explains, such costs can outweigh small tariff savings, helping explain why eligible trade does not always enter under preferences.

What Should Implementation Monitoring Diagnose?
Monitoring becomes useful when customs data identifies the problem and business evidence explains which administrative obstacle needs attention.
- A tariff-rate quota permits a specified quantity at a lower duty, with a higher rate beyond that quantity. Quota availability and allocation can matter alongside origin compliance when a business plans its shipment.
- The joint statement reports cars clearing customs under a tariff-rate quota. This illustrates an administered concession, not unlimited duty-free vehicle trade; the note does not infer quota volumes or tariff rates from that example.
- Compare sector-level take-up with firms’ reported difficulties to distinguish weak incentives from administrative friction. Low utilisation is a diagnostic signal; it does not, by itself, establish customs failure or justify abandoning origin safeguards.
- The planned annual exchange can support a shared diagnosis, but evidence must first accumulate. Early successful shipments establish that some firms accessed concessions; they cannot establish that small businesses generally face no barriers.
- Contact points and committees provide a route for recurring problems to reach responsible officials. Their practical value should be judged by clarified procedures and resolved cases, rather than meetings or institutional announcements alone.
Way Forward
Make the Concession Usable
- Publish product-specific origin guidance with worked examples, distinguishing production requirements from the documents needed to demonstrate compliance.
- Pair sectoral utilisation data with small-business feedback; target assistance where meaningful tariff savings are being lost to avoidable procedural costs.
- Use named contact points to track recurring customs issues and communicate resolutions, while retaining verification against unsupported origin claims.
Conclusion
- Evaluate CETA through a chain: available concession, qualifying origin, successful claim and realised benefit. Failure at any stage can separate a treaty promise from the experience of an exporter.
- For policy analysis, treat preference utilisation as a diagnostic measure. Combine it with business feedback and separate outcome evidence before claiming that administrative access has produced broad economic gains.
UPSC Practice Questions
Prelims MCQ 1
With reference to tariff preferences, consider the following statements:
- Preference utilisation compares preferential imports with imports eligible for preferences.
- Dispatch from a partner country alone establishes originating status.
- A tariff-rate quota can provide a lower duty within a specified quantity.
How many of the above statements are correct?
(a) Only one (b) Only two (c) All three (d) None
Answer: (b) Only two
Explanation:
Statements 1 and 3 are correct. Origin depends on the agreement’s production and product-specific criteria, not merely the country of dispatch.
Prelims MCQ 2
Which finding most directly demonstrates use of a negotiated tariff concession?
(a) An increase in total bilateral trade (b) Creation of a trade committee (c) Customs records showing eligible imports received the preferential tariff (d) A rise in the number of business delegations
Answer: (c) Customs records showing eligible imports received the preferential tariff
Explanation:
Customs records of preferential treatment directly establish take-up. Trade growth and institutional activity alone do not show that a concession was claimed.
UPSC Mains Questions
- Why may tariff concessions in a trade agreement remain underused? Discuss the role of rules of origin and trade facilitation. (150 words)
- How can preference-utilisation data and business feedback improve implementation of the India–UK CETA? Explain the limits of utilisation as an outcome indicator. (250 words)
Sources: PIB, Ministry of Commerce and Industry and UK Government, Preference Utilisation Technical Annex.
Frequently Asked Questions
What is preference utilisation?
It measures how much eligible trade actually receives available tariff preferences. The usual rate compares the value of preferential imports with the value eligible for preferences, rather than all bilateral imports.
Does shipping goods from India prove Indian origin?
No. Departure from India alone does not prove originating status. The good must satisfy the agreement’s applicable origin rule, and the claim must be supported through the prescribed proof arrangements.
What is a tariff-rate quota?
It allows a specified quantity of imports at a lower tariff, with a higher tariff applying beyond that quantity. It differs from an unrestricted tariff concession covering every qualifying shipment.
Has the annual CETA data exchange already begun?
The October 12 joint statement commits both governments to annual exchanges starting one year after entry into force. It describes a future monitoring commitment, not a completed first annual exchange.
Source: https://anantamias.com/current-affairs/india-uk-jetco-ceta-preference-utilisation/
Peptide Self-Assembly: How Molecular Shape Changes Materials
Why in News?
On 12 October 2026, the science ministry reported CeNS research showing how a methylene spacer alters peptide self-assembly and the resulting material’s optical behaviour.
- Researchers at the Centre for Nano and Soft Matter Sciences, Bengaluru, introduced a methylene spacer between a peptide and a fluorescent pyrene unit.
- The change affected molecular packing, supramolecular chirality, fluorescence lifetime behaviour and nanoscale organisation while retaining the fundamental peptide framework.
- The work appeared in Polymer Chemistry; the official report identifies possible applications rather than announcing a commercial material or clinical product.
- For materials design, what molecules contain and how they organise are separate questions; the arrangement can change the properties that a device would use.
- The practical challenge is controlling self-assembly to obtain desired structures, rather than merely observing that molecules form an ordered arrangement.
UPSC Relevance
Prelims Relevance
- Peptides and amino-acid chains
- Methylene spacer and molecular geometry
- Supramolecular self-assembly
- Chirality and mirror images
- Fluorescence lifetime
Mains Relevance
GS Paper 3
- Linking molecular design to functional nanomaterials
- Distinguishing laboratory findings from validated biomedical applications
Essay
- Small changes can produce large effects when relationships within a system change.
Background and Context
What Is Peptide Self-Assembly?
Peptide self-assembly concerns the organisation of molecules into a larger structure, so understanding the building block is only the first step.
- A peptide is a chain of amino-acid residues connected through peptide bonds. A single amino acid is a building block; it should not be described as an entire peptide chain.
- In self-assembly, molecular components spontaneously form an organised structure through molecular recognition. The resulting arrangement belongs to a collection of molecules, rather than being the structure of one isolated molecule.
- The term supramolecular directs attention beyond an individual molecule to the organisation of multiple molecules. For this study, the important question is how peptide-based units arrange themselves at the nanoscale.
- The studied system links a peptide with a fluorescent pyrene unit. The researchers changed their connection, allowing them to examine how relative orientation affects assembly without replacing the fundamental peptide framework.
- Self-assembly describes organisation, not biological reproduction. Molecules arranging themselves into an ordered material do not, on that basis, constitute a living system or demonstrate the ability to produce biological offspring.
How Does a Small Spacer Change Properties?
The central relationship runs from molecular geometry to collective packing and then to observable material properties.
- A methylene spacer, written as –CH₂–, was inserted between the peptide and pyrene components. This small chemical modification changed their relative orientation, creating a different geometry for molecular organisation.
- Changed geometry led to different packing: the way neighbouring molecules arrange themselves. The finding shows why retaining a peptide framework does not guarantee that the resulting material retains identical properties.
- Chirality means that a structure cannot be superimposed on its mirror image. In supramolecular chirality, the relevant handedness concerns the organised assembly, extending the discussion beyond the geometry of an individual molecule.
- Fluorescence lifetime describes how fluorescent intensity decays with time. A difference in lifetime behaviour is an optical finding; it should not automatically be translated into a claim of greater brightness or better imaging.
- The reported changes in nanoscale organisation and optical behaviour support a structure–packing–property relationship. They demonstrate a design strategy in the studied system, without proving that every spacer produces the same outcome.

What Has Been Demonstrated, and What Remains Possible?
The research offers a way to tune materials, while the usefulness of a finished sensor or imaging product remains a separate question.
- The demonstrated result is control through molecular modification: a small structural change alters collective organisation and function. The official report does not establish a clinically validated imaging agent or a market-ready electronic component.
- Biosensing and bioimaging are proposed application areas because the material has tunable optical behaviour. Naming these possibilities does not establish detection accuracy, biological safety or effectiveness inside a living organism.
- Photonics, optoelectronics and molecular electronics are also listed as possible directions. These are research opportunities in the release, rather than evidence that a functioning commercial device has already been manufactured or deployed.
- The design significance lies in changing organisation without extensively replacing the underlying peptide framework. This provides researchers another variable to investigate when seeking a chosen material response through molecular design.
- For evaluating a future application, ask whether the desired performance survives the conditions of use. A useful laboratory relationship must still be connected to the requirements of the specific proposed product.
Way Forward
Test the Proposed Function
- Compare related designs under defined conditions to establish which changes in geometry and packing reliably produce the desired optical response.
- For proposed biological uses, investigate safety and application-specific performance before describing the material as suitable for diagnosis or use in living systems.
- Evaluate reproducibility and manufacturing feasibility separately from the initial molecular finding; a tunable laboratory system and a dependable product answer different questions.
Conclusion
- The durable lesson is the structure–packing–property relationship: a small change in a molecular connection can alter collective organisation and optical behaviour even when the fundamental peptide framework remains intact.
- Use this example to explain rational materials design, while distinguishing measured laboratory behaviour from a proposed application. Scientific promise becomes practical value only when the relevant performance requirements are demonstrated.
UPSC Practice Questions
Prelims MCQ 1
With reference to peptide self-assembly, consider the following statements:
- A peptide consists of amino-acid residues connected through peptide bonds.
- Self-assembly necessarily implies biological reproduction.
- Changing the connection between molecular components can alter their collective packing.
How many of the above statements are correct?
(a) Only one (b) Only two (c) All three (d) None
Answer: (b) Only two
Explanation:
Statements 1 and 3 are correct. Self-assembly concerns spontaneous molecular organisation; it does not necessarily involve living systems or reproduction.
Prelims MCQ 2
Which interpretation best describes the significance of the reported methylene-spacer research?
(a) It establishes the clinical safety of all peptide materials. (b) It proves that a longer fluorescence lifetime always means greater brightness. (c) It shows that a small geometry change can alter packing and optical behaviour. (d) It demonstrates that peptides are individual amino acids.
Answer: (c) It shows that a small geometry change can alter packing and optical behaviour.
Explanation:
The report connects the spacer-induced geometry change with different molecular packing, supramolecular chirality and fluorescence lifetime behaviour. Clinical safety and universal brightness improvements are not established.
UPSC Mains Questions
- Explain the structure–packing–property relationship in functional materials using peptide self-assembly as an example.
- A promising laboratory material is not necessarily a usable biomedical product. Discuss with reference to peptide-based optical materials.
Source: PIB, Ministry of Science & Technology.
Frequently Asked Questions
What is peptide self-assembly?
Peptide self-assembly is the spontaneous organisation of peptide-based molecular components into ordered structures. It describes how molecules arrange collectively; it does not by itself imply a living system or biological reproduction.
What did the methylene spacer change?
The spacer changed the relative orientation of peptide and pyrene components. The official report links this geometry change to different packing, supramolecular chirality, fluorescence lifetime behaviour and nanoscale organisation.
What is supramolecular chirality?
It concerns handedness in the organised assembly of molecules. Chirality means a structure cannot be superimposed on its mirror image; the supramolecular level focuses attention on collective organisation rather than an isolated molecule.
Are these materials ready for medical use?
The official report identifies biosensing and bioimaging as potential applications. It does not establish a clinically validated product, biological safety or diagnostic performance; those require evidence relevant to the proposed use.
Source: https://anantamias.com/current-affairs/peptide-spacer-self-assembly-smart-biomaterials/
PM-SETU ITIs: Industry Control and Public Accountability
Why in News?
On 12 October 2026, the government announced PM-SETU shareholder agreements involving the Centre, Gujarat, Andhra Pradesh and AM/NS India for upgrading government ITI clusters.
- Surat and Visakhapatnam are the clusters covered by the agreements; their approved investment plans will guide implementation.
- Dedicated special purpose vehicles (SPVs) will now be established to manage cluster upgrades and operations.
- AM/NS India will hold 51% equity; the Centre and respective state government will each hold 24.5%.
- Modernised workshops, revised curricula and instructor training are planned interventions; improved employability remains an expected outcome.
- Industry participation can connect classroom skills with workplace requirements, but public training must also prepare students for opportunities beyond one employer.
- Institutional design matters because equipment purchases alone cannot establish whether students learn useful skills or secure sustainable employment.
UPSC Relevance
Prelims Relevance
- PM-SETU and government Industrial Training Institutes
- Shareholders’ agreements and special purpose vehicles
- Industry-majority equity participation
- Directorate General of Training
- Distinction between planned outputs and measured outcomes
Mains Relevance
GS Paper 2
- Public-private participation and institutional accountability
- Access and quality in vocational education
GS Paper 3
- Skills mismatch, employability and industrial workforce development
Essay
- Education should prepare workers for a changing economy without narrowing their future choices.
Background and Context
What the Shareholder Model Changes
The central change is an industry-majority management structure for government vocational institutions, rather than equipment support alone.
- PM-SETU stands for Pradhan Mantri Skilling and Employability Transformation through Upgraded ITIs. The scheme seeks to improve vocational education through industry partnerships and institutional reform, alongside better training infrastructure.
- The shareholders’ agreements establish a framework connecting the industry partner, Centre and state governments. Signing this framework enables implementation of approved plans; it does not establish that workshops have already been upgraded.
- A dedicated SPV is the proposed vehicle for managing each ITI cluster’s upgrades and operations. Its role connects project execution with running the institutions, making operational accountability relevant beyond the construction stage.
- The industry-majority stake makes this more than an advisory partnership. However, equity percentages alone do not reveal every board rule, reserved decision or safeguard; these require examination of the governing documents.
- The Directorate General of Training, within the skills ministry, is a signatory alongside the state governments and industry partner. This brings central coordination, state participation and industrial expertise into the implementation framework.
How Industry Participation Could Improve Training
The intended learning pathway links suitable equipment, updated teaching and practical experience; each part needs to work for students.
- AM/NS India will contribute manufacturing experience and industry insights. This can help identify workplace requirements, but curriculum choices should preserve transferable skills rather than prepare trainees exclusively for one company’s production processes.
- NAMTECH, the industry partner’s academic and technical collaborator, will support curriculum enhancement, training delivery, faculty development and academic innovation. These are assigned future roles, not evidence that teaching quality has already improved.
- Workshop and laboratory modernisation is a planned intervention. Its educational value depends on students actually using equipment under suitable instruction; procurement records alone cannot demonstrate competence in operating, maintaining or troubleshooting machinery.
- Instructor development connects new equipment with practical teaching. An upgraded machine adds limited learning value if instructors cannot demonstrate its operation, explain safety procedures or assess whether trainees can perform the relevant tasks.
- Hands-on learning is intended to expand alongside industry-relevant trades and curricula. Assessment should distinguish completing a course from independently performing a task, since attendance and certification alone do not demonstrate occupational readiness.

Where Public Accountability Becomes Essential
Industry leadership creates an opportunity to improve relevance, alongside a need to protect access, educational breadth and credible outcome reporting.
- Public participation should protect the educational purpose of government ITIs. Reviewers should examine admission practices, student costs and grievance arrangements before concluding that an industry-led institution remains accessible to learners with limited resources.
- Employer concentration is a potential design risk, not a reported failure of these clusters. Training should develop skills useful across workplaces, allowing graduates to change employers when opportunities or technologies change.
- Outcome evaluation should separate upgraded facilities, acquired skills and employment results. These answer different questions: what the institution provided, what the learner can do and whether the labour market rewarded that capability.
- Employment evidence would require follow-up on jobs, earnings and retention rather than placement announcements alone. Comparing trainees’ starting circumstances would also help avoid attributing every subsequent improvement solely to the new management structure.
- Implementation status remains the immediate caution: agreements have been signed and SPVs are to be established. The announcement reports planned reforms and expected benefits, without measured employment gains attributable to these arrangements.
Way Forward
Make Management Answerable to Learners
- Set publicly reviewable milestones for workshop readiness, instructor preparation and practical teaching, identifying which partner is responsible for each deliverable.
- Protect transferable learning through assessment of core technical skills, safety and problem-solving, alongside training on industry-specific equipment.
- Publish student-access and outcome evidence, with clear definitions and follow-up periods, while giving trainees a usable route to raise complaints.
Conclusion
- PM-SETU’s governance question is how to combine industry expertise with a continuing public educational purpose. Majority industry participation may improve training relevance, but its value depends on implementation and safeguards that protect learners’ choices.
- Judge the reform through a causal chain: management decisions, teaching improvements, demonstrated skills and employment outcomes. The signed agreements establish the framework; evidence from later implementation must establish whether the promised benefits reach trainees.
UPSC Practice Questions
Prelims MCQ 1
With reference to the announced PM-SETU arrangements for Surat and Visakhapatnam ITI clusters, consider the following statements:
- AM/NS India will hold a majority equity stake in the proposed SPVs.
- The Centre and respective state government will have equal equity participation.
- Signing the agreements establishes that employment outcomes have already improved.
How many of the above statements are correct?
(a) Only one (b) Only two (c) All three (d) None
Answer: (b) Only two
Explanation:
The industry partner will hold 51%, while the Centre and respective state will each hold 24.5%. Improved employability is expected; the release does not report measured employment gains.
Prelims MCQ 2
What is the proposed role of the dedicated SPVs under these PM-SETU agreements?
(a) Setting a uniform national wage for ITI graduates (b) Replacing all state education authorities (c) Managing the upgradation and operations of the ITI clusters (d) Guaranteeing employment to every enrolled trainee
Answer: (c) Managing the upgradation and operations of the ITI clusters
Explanation:
The release assigns cluster upgradation and operations to the dedicated SPVs that will now be established. It announces no universal employment guarantee.
UPSC Mains Questions
- How can industry-majority management of government ITIs improve training relevance while preserving public accountability? Discuss with reference to PM-SETU.
- Distinguish infrastructure outputs, learning outcomes and employment outcomes in evaluating vocational education reform. Suggest safeguards against overstating success.
Source: PIB, Ministry of Skill Development and Entrepreneurship.
Frequently Asked Questions
What is PM-SETU?
PM-SETU is the Pradhan Mantri Skilling and Employability Transformation through Upgraded ITIs scheme. It seeks to improve government vocational institutions through industry partnerships, institutional reform and better training infrastructure.
Who will hold equity in the proposed ITI cluster SPVs?
AM/NS India will hold the majority stake. The Centre and respective state government will participate equally as the other shareholders. This structure places industry within management rather than merely an advisory role.
Have the announced ITI upgrades already been completed?
No. The announcement reports signed shareholder agreements and states that dedicated SPVs will now be established. Workshop modernisation, curriculum improvements and expanded practical learning remain planned interventions in this release.
Why does public accountability matter in industry-led ITIs?
Government vocational education should remain accessible and develop transferable skills. Reviewing student costs, admission practices, grievance arrangements and independently assessed learning can help ensure employer participation serves trainees’ broader interests.
Does the announcement demonstrate improved employment?
No. Improved employability is an expected benefit, not a measured result in the announcement. Evidence would need to follow trainees beyond course completion and examine employment, earnings and job retention.
Source: https://anantamias.com/current-affairs/pm-setu-iti-shareholder-governance-industry-control/
RDI Fund Managers: Routing Patient Capital to Research
Why in News?
On October 12, 2026, the RDI Fund announced its first cohort of Second Level Fund Managers, following approval by the Empowered Group of Secretaries on October 8.
- The approved cohort comprises 19 managers: 14 Alternative Investment Funds and five Focused Research Organisations, creating intermediary channels for research finance.
- The announced RDIF commitment totals ₹7,131 crore; the release does not establish that this amount has already reached technology enterprises.
- Managers are expected to mobilise private capital equivalent to the RDIF contribution. This is an expectation, not confirmation that matching investment has been secured.
- Patient capital addresses the long period between research expenditure and possible commercial returns, when private investors may hesitate to fund uncertain development.
- Delegating investment decisions raises an accountability question: how can public institutions assess specialist managers without treating every unsuccessful research project as misconduct?
UPSC Relevance
Prelims Relevance
- ANRF: Anusandhan National Research Foundation, housing the RDIF’s Independent Business Unit.
- SLFMs: Second Level Fund Managers channel RDIF capital to eligible technology enterprises.
- AIFs and FROs: Alternative Investment Funds and Focused Research Organisations, respectively.
- EGoS: Empowered Group of Secretaries, which approved the announced cohort.
- Commitment and disbursement: an approved funding amount and money actually released are different stages.
Mains Relevance
GS Paper 3
- Patient capital for private research and development.
- Assessing whether public finance attracts additional private investment.
GS Paper 2
- Delegated decision-making, expert appraisal and accountability for public resources.
Essay
- Supporting uncertainty requires institutions that can distinguish responsible experimentation from avoidable failure.
Background and Context
How the Funding Chain Works
The arrangement separates management of the public fund from the intermediary role of directing capital toward eligible technology enterprises.
- The Independent Business Unit within ANRF manages RDIF under the Department of Science and Technology. This identifies the institutional home of the fund, while intermediary managers handle the next stage of capital routing.
- The selected Second Level Fund Managers channel RDIF capital to Eligible Technology Enterprises undertaking research, development and innovation. The announcement concerns approval of these intermediaries, rather than a complete list of final enterprise recipients.
- Both Alternative Investment Funds and Focused Research Organisations appear in the approved cohort. Their shared role here is intermediary financing; being selected as a manager does not itself make an institution a funded technology enterprise.
- Eligible activities must be at Technology Readiness Level 4 or above, according to the release. This is an eligibility boundary; it neither certifies commercial success nor means every supported enterprise has an operational product.
- The earlier ePlane RDI case concerns enterprise-level development support. The present announcement instead explains the institutional channel through which the wider fund seeks to direct capital, so the two developments answer different policy questions.

Who Evaluates and Approves the Managers?
Selection passes through expert assessment and institutional consideration before approval, creating several decision points whose purposes should remain distinct.
- Applications underwent multi-stage evaluation, including detailed objective assessment and in-person interactions with an Expert Advisory Committee. This sequence brings specialist scrutiny into selection before proposals move to the institutions responsible for consideration and approval.
- Following evaluation, proposals went before the ANRF Executive Council and subsequently the Empowered Group of Secretaries. The official announcement identifies the latter as the body that approved this cohort, separating advisory scrutiny from final approval.
- The governance rationale is delegation with oversight: specialised intermediaries can assess research opportunities, while public institutions remain responsible for the funding framework. This is an analytical implication of the structure, not proof of successful implementation.
- A useful accountability test is whether selection quality and subsequent performance can be examined separately. A promising application supports approval, but later evidence is still needed to judge how an intermediary actually directs public resources.
- Oversight should address conflicts of interest wherever a manager’s commercial relationships could influence selection. Disclosure and independent review are safeguards to consider; the announcement alone does not establish the detailed controls applied to each manager.
What Would Demonstrate Success?
The strongest assessment follows money and decisions through the chain instead of equating an approval announcement with completed research outcomes.
- A commitment records an approved financing intention; disbursement records money actually released. Evaluation should distinguish both from expenditure by an enterprise, because approval at one point does not establish completion of the subsequent funding stages.
- Expected private mobilisation is a financing objective, not money already secured. Reporting should show what investors actually contribute and when, so public commitments are not mistaken for completed participation by private providers of capital.
- The case for public support depends on additionality: research investment enabled by intervention beyond what would otherwise occur. Evaluation requires evidence rather than assuming every accompanying private investment was caused by RDIF.
- Patient capital allows time for difficult research, but patience should not remove review. Managers should explain whether continued funding responds to credible progress, revised evidence or unresolved risks, rather than simply extending unsuccessful projects indefinitely.
- Technical failure and poor governance are different possibilities. A well-assessed experiment may fail, while weak appraisal can waste funds; evaluation should examine decision quality and documented learning alongside financial results and eventual technology outcomes.
Way Forward
Make the Funding Chain Accountable
- Report commitments, disbursements and private contributions separately, with clear definitions that prevent the same money from being counted at multiple stages.
- Use independent reviews to assess managers’ selection decisions, conflicts of interest and responses to evidence, alongside the progress of supported enterprises.
- Link further support to documented milestones, allowing justified changes in research direction while recording why funding is continued, revised or stopped.
Conclusion
- The RDI funding chain combines public oversight with intermediary expertise. Its value depends on whether this arrangement directs patient capital toward credible research while retaining clear responsibility for selection, monitoring and subsequent financing decisions.
- Judge progress through actual capital flows and research evidence. Manager approval establishes an institutional channel; it does not establish disbursement, secured private mobilisation or successful technologies, each of which requires evidence at a later stage.
UPSC Practice Questions
Prelims MCQ 1
With reference to the announced RDI Fund arrangements, consider the following statements:
- RDIF is managed by an Independent Business Unit housed within ANRF.
- The approved cohort includes both Alternative Investment Funds and Focused Research Organisations.
- The announcement confirms that the expected equivalent private capital has already been mobilised.
How many of the above statements are correct?
(a) Only one (b) Only two (c) All three (d) None
Answer: (b) Only two
Explanation:
The first two statements match the official release. Equivalent private capital mobilisation is expected; the announcement does not confirm that it has been secured.
Prelims MCQ 2
Which evidence would most directly establish disbursement under a research-financing programme?
(a) Selection of an intermediary manager (b) Announcement of an approved funding commitment (c) A record of funds actually released to the relevant recipient (d) An expectation that private investors will participate
Answer: (c) A record of funds actually released to the relevant recipient
Explanation:
Disbursement concerns actual release of money. Selection, commitment and expected participation describe other stages and cannot substitute for evidence of release.
UPSC Mains Questions
- Explain how intermediary fund managers can support public financing of research. What accountability safeguards should accompany delegated investment decisions?
- Distinguish funding commitment, disbursement and private capital mobilisation. Why do these distinctions matter when evaluating public support for innovation?
Source: PIB, Ministry of Science and Technology.
Frequently Asked Questions
What are Second Level Fund Managers?
They are approved intermediaries that channel RDIF capital to Eligible Technology Enterprises undertaking research, development and innovation. The announced cohort includes Alternative Investment Funds and Focused Research Organisations.
Who manages the RDI Fund?
An Independent Business Unit housed within the Anusandhan National Research Foundation manages RDIF under the Department of Science and Technology. Approved intermediaries provide the next link to eligible technology enterprises.
Has the announced commitment already been disbursed?
The release announces an approved RDIF commitment. It does not establish that the entire amount has been released to enterprises. Commitment, disbursement and actual research expenditure must be assessed separately.
Is equivalent private funding already secured?
No such conclusion follows from the announcement. Managers are expected to mobilise private capital equivalent to RDIF’s contribution; confirming actual mobilisation requires evidence of the private investment secured or contributed.
Why does research need patient capital?
Research can involve long development periods and uncertain commercial returns. Patient capital allows time to address those uncertainties, while milestone reviews and documented investment decisions remain necessary for responsible use of public resources.
Source: https://anantamias.com/current-affairs/rdi-fund-second-level-managers-capital-governance/
Solar Polar Brightening: What Radio Observations Reveal
Why in News?
On 12 October 2026, the Ministry of Science & Technology reported research linking solar polar brightening with large-scale polar magnetic fields and smaller magnetic structures.
- An ARIES-led collaboration combined radio, extreme-ultraviolet and magnetic observations to examine enhanced microwave emission near the Sun’s poles.
- The Nobeyama Radioheliograph observations used a frequency of 17 GHz, providing a consistent radio view for comparison with other measurements.
- The study found correlations with polar coronal-hole area and polar magnetic-field strength, alongside local associations with bright points and jets.
- The solar poles matter for magnetic-field evolution and the generation of the solar wind; observing them helps explain the Sun’s changing magnetic environment.
- The finding concerns observational research. It does not announce a deployed solar-storm warning service or establish that one structure explains every bright patch.
UPSC Relevance
Prelims Relevance
- Microwave polar brightening: enhanced radio brightness near the Sun’s poles.
- Coronal holes: EUV-dark regions with predominantly open magnetic fields.
- Coronal bright points: small bright features associated with compact magnetic loops.
- Multiwavelength observation: comparing different emissions from the same solar region.
Mains Relevance
GS Paper 3
- Scientific observation: combining independent measurements to investigate a physical mechanism.
- Research interpretation: distinguishing correlations, proposed mechanisms and operational applications.
Background and Context
Why Can the Same Region Look Dark and Bright?
Brightness is measured in a particular observing band; a region does not have one universal brightness across every view of the Sun.
- Microwave polar brightening means that polar regions show enhanced radio emission relative to the surrounding solar disk at certain frequencies. It does not mean that the poles look brighter to human eyes.
- Extreme-ultraviolet (EUV) images reveal coronal holes as relatively dark regions. The term describes their appearance in that diagnostic; it does not imply a physical cavity cut through the Sun or an absence of matter.
- Different wavelengths reveal different solar features and temperature conditions, as NASA’s wavelength comparison explains. A dark EUV region can overlap microwave enhancement without the two observations contradicting one another.
- Radio and EUV comparisons let researchers ask whether enhanced emission occupies the same region as a coronal hole or a smaller bright structure. Their value lies in connecting complementary observations of the same area.
- Diagnostic contrast is the key lesson: specify the observing band before interpreting brightness. Treating every bright pixel as the same physical phenomenon would erase the distinction that this study uses to investigate polar activity.

Open Fields and Compact Loops Describe Different Scales
The study connects broad polar magnetic conditions with local bright structures, rather than treating the entire polar atmosphere as one uniform feature.
- Coronal holes have predominantly open magnetic-field lines, permitting fast solar wind to escape. Open describes the large-scale field configuration; it does not mean that every magnetic structure inside the region has identical geometry.
- Coronal bright points are associated with small magnetic loops and commonly occur within polar coronal holes. These compact structures explain why a broadly dark EUV region can still contain individual bright features.
- Polar magnetic-field strength showed a stronger relationship with microwave brightening than coronal-hole area did. This comparison supports attention to the magnetic environment, instead of explaining brightness only through how much area a hole covers.
- North–south differences appeared in the long-term evolution of brightening and coronal-hole area. The finding cautions against assuming that observations from one solar pole automatically describe the behaviour of the other pole.
- Local microwave patches often coincided with EUV bright points, and several were associated with coronal jets. These observations connect small-scale activity with local enhancement without making jets a necessary feature of every patch.
What Does the Evidence Establish?
The strength of the study is agreement across observations; its limits matter when moving from an association to a causal explanation or prediction.
- Three complementary datasets supplied different evidence: Nobeyama recorded radio emission, NASA’s Solar Dynamics Observatory supplied EUV observations, and Wilcox Solar Observatory supplied magnetic measurements. Combining them allows comparisons unavailable from a single observing channel.
- Long-term correlation means that measured quantities vary together across the observations. It supports a relationship between polar brightness and magnetic evolution, but cannot by itself establish that one measured quantity is the sole cause.
- Spatial coincidence means that features overlap in the compared images. Simultaneous radio and EUV observations strengthen the association with local structures; they do not demonstrate that every bright patch has an identical emission mechanism.
- Large and small scales should remain separate in interpretation: overall brightness follows the evolving polar environment, while local enhancements associate with compact structures. Neither observation requires discarding the other as an explanation.
- Forecasting claims need additional evidence about prediction and performance. This report improves understanding of polar activity and solar-wind origins; it does not show that a tested operational solar-storm forecast system has been deployed.
Way Forward
Test the Interpretation Across Observations
- Compare both poles over time so hemispheric differences are retained rather than hidden inside a single average.
- Use simultaneous measurements to examine whether local radio enhancements repeatedly align with bright points or jets under different polar conditions.
- Require predictive validation before translating research associations into warning claims: a plausible physical connection is not itself evidence of reliable forecasts.
Conclusion
- Solar polar brightening illustrates why observing wavelength and magnetic scale must be specified together: EUV-dark coronal holes and microwave-bright polar features can coexist within a complex magnetic environment.
- The durable takeaway is complementary evidence: correlations and local overlap support magnetic interpretations, while causal completeness and operational forecasting remain separate claims requiring their own evidence.
UPSC Practice Questions
Prelims MCQ 1
With reference to solar polar brightening, consider the following statements:
- A region that appears dark in an EUV image can show enhanced microwave emission.
- Coronal holes have predominantly open magnetic-field lines.
- Every microwave bright patch necessarily coincides with a coronal jet.
How many of the above statements are correct?
(a) Only one (b) Only two (c) All three (d) None
Answer: (b) Only two
Explanation:
The first two statements are correct. Brightness depends on the observing band, and coronal holes have predominantly open fields. The study associated jets with several cases, not every bright patch.
Prelims MCQ 2
A correlation between polar microwave brightness and magnetic-field strength most directly supports which conclusion?
(a) Magnetic-field strength is proven to be the sole cause of every bright patch. (b) A solar-storm warning service has become operational. (c) Brightness and magnetic-field evolution are observationally related. (d) EUV observations are unnecessary for studying local solar features.
Answer: (c) Brightness and magnetic-field evolution are observationally related.
Explanation:
Correlation supports an observational relationship. It does not independently establish a sole cause, eliminate complementary observations or validate an operational forecasting service.
UPSC Mains Questions
- Explain how radio, extreme-ultraviolet and magnetic observations together improve understanding of solar polar activity.
- Distinguish long-term correlation from spatial coincidence using solar polar brightening. Why must both be interpreted cautiously when making causal or forecasting claims?
Sources: PIB, Ministry of Science & Technology and NASA.
Frequently Asked Questions
What is solar polar brightening?
Solar polar brightening is enhanced radio emission near the Sun’s poles at certain microwave frequencies. It describes brightness in the observing band, not necessarily how the poles would appear in visible light.
How can a coronal hole look dark and bright?
A coronal hole appears dark in EUV images, while overlapping polar regions can show enhanced microwave emission. Different observing bands reveal different features, so these descriptions do not represent a contradiction.
Are coronal holes and coronal bright points the same?
No. Coronal holes are broad regions with predominantly open magnetic fields. Coronal bright points are compact features associated with small magnetic loops and can occur inside those broader coronal holes.
Does the study provide a solar-storm forecast?
The report describes observational evidence linking polar microwave brightness with magnetic conditions and local structures. It improves physical understanding but does not announce a deployed, validated service for predicting solar storms.
Source: https://anantamias.com/current-affairs/solar-polar-microwave-brightening-magnetic-fields/
Why does India need a trained workforce for elderly care?
Why in news?
Budget 2026-27 announced training 1.5 lakh caregivers under NSQF, as NITI Aayog report frames caregiving as economic activity.
UPSC Relevance
Prelims – Care economy, schemes associated.
Mains
GS1: Role of women, population and associated issues.
GS2: Welfare schemes for vulnerable sections (elderly, persons with disabilities), issues relating to health.
GS3: Inclusive growth, employment, skill development
What is the Care Economy?
- Meaning – All work that goes into looking after people – children, the elderly, the sick and persons with disabilities. It includes both paid work (nurses, domestic workers, ASHA and Anganwadi workers) and unpaid work done mostly by family members.
- Direct care – Hands-on work like feeding, bathing, giving medicines.
- Indirect care – Cooking, cleaning, and fetching water – all that makes direct care possible.
- Invisible work – Unpaid domestic and care services within a household are not counted in GDP under the UN System of National Accounts. So the largest part of the care economy does not show up in national statistics.
- Care ecosystem – Families, the State (schemes, hospitals, Anganwadis), the market (agencies, old age homes, start-ups) and the community (SHGs, NGOs, volunteers) together form the care ecosystem.
Why India needs a care ecosystem now?
A. Demographic shift
- Ageing population – India’s 60+ population was about 149 million in 2022 and is projected to reach 347 million by 2050, about 20.8% of the population.
- Feminisation of ageing – Women live longer, so a growing share of the very old are widows – often with no income or property of their own.
- Health burden – The Longitudinal Ageing Study in India (LASI) found that about three out of four elderly persons have at least one chronic disease. Alzheimer’s and Parkinson’s add mental and behavioural care needs, not just physical ones.
- Disability – About 26.8 million persons with disabilities (Census 2011) depend largely on family members for care.
B. Social change
- Decline of the joint family – Earlier, three generations under one roof acted like an informal insurance system. Nuclear families and migration of the young to cities and abroad have left many elderly alone.
- Burden on women – With smaller families, care falls mostly on housewives, who learn by trial and error. The NSO Time Use Survey shows women spend about 299 minutes a day on unpaid domestic and care work, against 97 minutes for men.
- Caregiver burnout – Family caregivers face physical exhaustion, mental stress and loss of income, with no support system.
C. Economic logic
- Women’s workforce participation – Female LFPR has risen to about 41.7% (PLFS 2023-24) but is still far below men. Care duties are among the biggest reasons women stay out of paid work or drop out mid-career.
- Job creation – The Economic Survey 2023-24 noted that investing 2% of GDP directly in public care services could create almost 11 million jobs, nearly 70% of them for women.
- Viksit Bharat link – A country cannot reach high-income status while half its potential workforce is tied down by unpaid care.
- Silver economy – Home healthcare, assisted living, geriatric products, tele-medicine and assistive devices form a fast-growing market. SAGE was launched to back such start-ups.
- Global demand – Ageing countries like Japan, Germany and Israel need caregivers. Japan’s Specified Skilled Worker category includes nursing care. Like India’s nurses, trained Indian caregivers could find work abroad.
Existing initiatives
- Budget 2026-27 – Training of 1.5 lakh caregivers aligned to the National Skills Qualifications Framework (NSQF).
- Kudumbashree K4 Care (Kerala) – Launched in February 2024 to train SHG members as certified geriatric, patient and disability care executives. Only 838 people had completed the course – slow progress.
- ASHA workers – NHSRC has prepared a Training Manual on Elderly Care, delivered through Ayushman Arogya Mandirs (Health and Wellness Centres). Data on how many ASHAs have been trained is not public.
| Scheme / Law | Ministry | What it does |
| Maintenance and Welfare of Parents and Senior Citizens Act, 2007 | Social Justice & Empowerment | Legal duty on children/relatives to maintain parents; Maintenance Tribunals; old age homes in every district. |
| Atal Vayo Abhyuday Yojana (AVYAY) | Social Justice & Empowerment | Umbrella scheme for senior citizens – old age homes, day care, Rashtriya Vayoshri Yojana (assistive devices), Elderline 14567. |
| SAGE (Seniorcare Ageing Growth Engine) | Social Justice & Empowerment | Supports start-ups offering eldercare products and services. |
| Ayushman Vay Vandana (PM-JAY extension, 2024) | Health & Family Welfare | Health cover of up to Rs 5 lakh for all citizens aged 70+, irrespective of income. |
| Palna (under Mission Shakti) | Women & Child Development | Day-care crèches, including Anganwadi-cum-crèches, for children of working mothers. |
Challenges
- Invisibility – Unpaid care is not counted in GDP and is taken for granted as women’s natural duty.
- Shortage of care specialists – 1.5 lakh trained caregivers against an estimated 146 million informal caregivers is a drop in the ocean. There are Vvery few geriatricians, geriatric nurses and dementia care professionals, mostly concentrated in cities
- Informality and low pay – Paid care workers – domestic workers, home attendants – are largely informal, with no fixed wages, job security or social security. India has not ratified the ILO Domestic Workers Convention (C189).
- Scheme workers undervalued – ASHA and Anganwadi workers carry heavy care duties but get honorarium, not salaries. The Supreme Court in 2022 had to hold that Anganwadi workers are entitled to gratuity.
- No standard curriculum – There is no common national standard for caregiver training or certification; home-care agencies are barely regulated.
- Costs – Out-of-pocket spending on elderly care is high; long-term care insurance hardly exists in India.
- Social stigma – Old age homes and paid carers are often seen as a sign that children have failed in their duty.
- Fragmented policy – Elderly care, childcare and disability care sit with different ministries with little coordination.
Way Ahead
NITI Aayog – Reimagining Care: Strategies for Empowering Caregivers in Viksit Bharat@2047 (Aug 2026)
- Caregiving as economic activity – For the first time, a national policy document treats caregiving as economic activity and not just welfare work.
- National Caregiver Council – An apex body to set benchmarks, supervise skilling, update training modules, standardise curricula and run a national portal of certified caregivers.
- Recognise informal caregivers – Validate and train millions of unpaid family caregivers into recognised caregivers.
- Go global – Position India as a source of trained caregivers through migration and skill agreements, as with nurses.
ILO 5R Framework
- Recognise, Reduce, Redistribute – Recognise, reduce and redistribute unpaid care work (between women and men, and between families and the State).
- Reward and Represent – Reward paid care workers with decent pay and conditions, and give them representation and social dialogue.
The care economy is not a cost but an investment. If Budget announcements are followed by strong implementation on the ground, India can turn informal dedication into professional skill – bringing dignity to caregivers, better care to the elderly, and more women into paid work.
Mains Practice Question
Q. “Transforming India’s care economy is an economic strategy waiting to be unlocked.” In the context of India’s ageing population, discuss the need for a formal caregiving ecosystem. Examine the challenges involved and suggest measures to build it. (15 marks, 250 words)
Source: https://anantamias.com/current-affairs/why-does-india-need-a-trained-workforce-for-elderly-care/
Lakshadweep turns 100% literate
Why in news?
Lakshadweep declared a 100% literate UT under ULLAS after all 1,113 identified adult non-literates cleared the Foundational Literacy and Numeracy Assessment Test (FLNAT).
UPSC Relevance
Prelims – ULLAS-Nav Bharat Saaksharta Karyakram
Mains – GS2: Government policies and interventions, issues relating to development of education and human resources, welfare schemes for vulnerable sections
What ‘literate’ and ‘fully literate state/UT’ mean ?
- Literate – In August 2024, the Ministry of Education defined literacy as the ability to read, write and compute with comprehension, along with critical life skills like digital and financial literacy. Merely signing one’s name no longer counts.
- Fully literate State/UT – One that achieves 95% or more literacy among people aged 15+. The 5% margin accepts that some people cannot become literate due to very old age, illness or intellectual disability.
ULLAS – Nav Bharat Saaksharta Karyakram
- Full form – ULLAS stands for Understanding of Lifelong Learning for All in Society. It is also called the New India Literacy Programme (NILP).
- Nature – A Centrally Sponsored Scheme of the Ministry of Education (Department of School Education and Literacy), running from 2022-23 to 2026-27.
- Outlay – Rs 1,037.90 crore for the five years, shared between the Centre and States.
- Target – 5 crore non-literates aged 15 years and above – roughly 1 crore every year.
- Alignment – Built on NEP 2020, which calls for 100% youth and adult literacy, and on SDG target 4.6 (all youth and a substantial share of adults to achieve literacy and numeracy by 2030).
- Five components
- Foundational Literacy and Numeracy (FLN) – Reading, writing and arithmetic with understanding.
- Critical Life Skills – Financial literacy, digital literacy, legal literacy, health care, family welfare, and disaster management.
- Basic Education – Equivalency at preparatory, middle and secondary stage for those who want to continue.
- Vocational Skills – Skills that help neo-literates find work or improve incomes.
- Continuing Education – Courses in arts, science, culture and sports for lifelong learning.
States/UTs declared fully literate under ULLAS – 11
| Ladakh (UT) | First region in India declared fully literate under ULLAS. |
| Mizoram | First State under ULLAS; literacy about 98.2%. |
| Goa | Literacy about 99.7%. |
| Tripura | Crossed 95%; learning material in Bengali, English and Kokborok. |
| Himachal Pradesh | Literacy 99.3%. The State had only about 7% literacy at Independence. |
| Chandigarh (UT) | Literacy about 99.9%. |
| Andaman & Nicobar Islands (UT) | Island UT; outreach to scattered settlements. |
| Sikkim | Literacy 99.82% – highest among ULLAS-certified regions. |
| Uttarakhand | Literacy 98.7% (up from 83.8% in 2023-24); about 25,000 volunteers reached remote hill villages. |
| Jammu & Kashmir (UT) | Largest population to get the tag; 1.78 lakh of 1.80 lakh identified learners (99.09%) cleared FLNAT. |
| Lakshadweep (UT) | All 1,113 identified adult non-literates cleared FLNAT; declared 100% literate. |
Practice MCQ
Q1. With reference to ULLAS – Nav Bharat Saaksharta Karyakram, consider the following statements:
- It targets non-literate persons aged 15 years and above.
- It is a Central Sector Scheme fully funded by the Union Government.
- Learners who clear the FLNAT are certified jointly by NIOS and the Department of School Education and Literacy.
How many of the statements given above are correct?
(a) Only one
(b) Only two
(c) All three
(d) None
Answer: (b). Statement 2 is incorrect. ULLAS is a Centrally Sponsored Scheme, with costs shared between the Centre and States.
Source: https://anantamias.com/current-affairs/lakshadweep-turns-100-literate/
Warming Himalayas demand a rethink on development
Why in news?
International Centre for Integrated Mountain Development (ICIMOD) reports Himalayan ice loss has doubled since 2000, while Nepal’s August ice-rock collapse flood exposes risks of unplanned development.
UPSC Relevance
Prelims – Indian Himalayan Region
Mains
GS1: Salient features of world’s physical geography, distribution of key natural resources (water)
GS3: Conservation, environmental pollution and degradation, environmental impact assessment.
The Indian Himalayan Region (IHR)
- Extent – The IHR stretches about 2,500 km across 13 States and UTs, from Ladakh and J&K in the west to Arunachal Pradesh and the north-eastern hill States in the east. It covers roughly 16% of India’s area.
- Part of a larger system – The IHR is part of the Hindu Kush Himalaya (HKH), a 3,500 km mountain arc shared by eight countries – Afghanistan, Pakistan, India, Nepal, Bhutan, China, Bangladesh and Myanmar.
- Young fold mountains – Formed by the collision of the Indian and Eurasian plates. The plate is still moving northward, so the range is still rising and most of it falls in seismic zones IV and V.
- Third Pole of Cryosphere – Outside the Arctic and Antarctic, the HKH holds the largest store of ice on earth.
Significance of the Himalayas
A. Geographical importance
- Climate shield – Blocks the cold, dry winds from Central Asia in winter, keeping north India warmer than other places at the same latitude.
- Monsoon trap – Forces the moist south-west monsoon winds to rise and shed rain over the plains (orographic rainfall). Without the Himalayas, much of north India would be a dry zone.
- Water tower – Glaciers and snow feed the Indus, Ganga and Brahmaputra, which keep flowing even in summer. Meltwater is crucial for lean-season flow and irrigation. Its rivers support close to two billion people in the mountains and the plains below.
- Builder of plains – Rivers carry sediment down from the mountains, which built and still renews the fertile Indo-Gangetic plains.
- Natural frontier – Acts as a strategic barrier on the northern border; passes like Zoji La, Shipki La and Nathu La have shaped trade and defence.
- Energy – The bulk of India’s untapped hydropower potential lies in the Himalayan rivers.
B. Environmental and ecological importance
- Biodiversity hotspot – The Himalaya is one of India’s four biodiversity hotspots, with endemic species like the snow leopard, red panda, musk deer and Himalayan monal.
- Ecosystem services – Forests, alpine meadows and wetlands regulate water flow, hold soil, store carbon and give fuel, fodder and medicinal plants.
- Climate regulator – Snow and ice reflect sunlight and cool the region; their loss feeds further warming.
C. Economic importance
- Livelihood and culture – Supports farming, pastoral communities like the Gaddis, Bakarwals and Bhotiyas, pilgrimage (Char Dham, Amarnath, Kailash) and tourism.
Emerging threats to the stability of the Himalayas
A. Climate-driven threats
- Faster warming – According to the International Panel on Climate Change (IPCC) and World Meteorological Organization (WMO), high mountain Asia is warming at about 0.3°C per decade, nearly double the global average. Warming is uneven – the western Himalaya is heating faster, with night and winter temperatures rising most.
- Glacier retreat – ICIMOD (March 2026) found that ice-loss rates across the Hindu Kush Himalayas doubled since 2000. Less winter snow and more summer melt mean glaciers are shrinking and thinning.
- Warmer, weaker ice – Glacier ice that was once between -6°C and -20°C is now close to -2°C, making it much easier to melt.
- Permafrost thaw – Permafrost works like cement holding fractured rock together with ice. As it thaws, steep rock walls lose their grip, leading to rock avalanches, landslides and debris flows.
- Glacial Lake Outburst Floods (GLOFs) – New and expanding glacial lakes are held by loose moraine dams which can breach suddenly. One collapse can trigger a chain – avalanche, river damming, then a flash flood.
- Extreme weather – More cloudbursts and intense rain spells, alongside dry winters with poor snowfall.
- Other stressors – Black carbon and dust settling on snow speed up melting; forest fires in Uttarakhand and Himachal are becoming more frequent.
B. Human-made threats
- Hydropower cascades – Dams and tunnels built back-to-back on the same river, often in paraglacial zones. Blasting and tunnelling weaken slopes, and muck is often dumped into rivers.
- Road widening – Vertical cutting of slopes for highways and all-weather roads destabilises hills, as seen repeatedly in Himachal and Uttarakhand.
- River diversion projects – The proposed Chenab-Beas link (8.7 km tunnel through the Pir Panjal near Koksar, Lahaul-Spiti, at about 3,140 m) looks logical on paper, but sits in a fragile zone.
- Unplanned urbanisation – Multi-storey buildings on weak slopes, poor drainage and no attention to carrying capacity – Joshimath subsidence is the clearest example.
- Tourism overload – Pilgrim and tourist numbers far beyond what hill towns can handle, bringing traffic, waste and construction pressure.
- Loss of forests and traditional practices – Deforestation, invasive weeds like Lantana and the decline of earthquake-resistant traditional houses like Kath-Kuni in Himachal.
C. Governance gaps
- Data gaps – Scientists admit they are dealing with a fast-changing future using an incomplete map. Ground stations at high altitudes are few.
- Plains-based rules – Building codes, EIA norms and flood zoning are largely designed for the plains. The cumulative impact of many projects in one valley is rarely assessed.
- Transboundary risk – Hazards start in one country and hit another; there is no strong regional system for real-time data sharing.
National Mission for Sustaining the Himalayan Ecosystem (NMSHE)
- Background – One of the eight missions under the National Action Plan on Climate Change (NAPCC), 2008. The nodal ministry is the Department of Science and Technology (DST).
- Aim – To understand and continuously assess the health of the Himalayan ecosystem and help policymakers protect it in the face of climate change.
- Outcomes – Better glacier monitoring and a common-framework climate vulnerability assessment of 12 Himalayan states (DST, 2019), which ranked Assam and Mizoram as most vulnerable.
- Gaps – Research has not translated well into binding rules for project clearance, building codes or zoning. State cells are thinly staffed and real-time hazard monitoring is still weak.
Other related initiatives
- National Mission on Himalayan Studies (NMHS) – MoEFCC scheme (2015-16); funds research and solutions for the IHR.
- SECURE Himalaya – MoEFCC-UNDP-GEF project for high-range landscapes and snow leopard habitats in Ladakh, J&K, Himachal, Uttarakhand and Sikkim.
- Himalayan State Regional Council – Set up by NITI Aayog (2018) to push sustainable development in the IHR.
- Expert committees – The Avay Shukla Committee (constituted in Court on Its Own Motion vs State of Himachal Pradesh) and the Ravi Chopra Committee both suggested restricting major hydro projects or putting construction above 2,200 m under detailed expert review.
Way forward
- Early warning – Satellite and drone surveillance to catch cliff fracturing, permafrost thaw and glacier instability; acoustic and hydrological sensors along glacier-fed rivers to alert downstream villages.
- Glacial lakes – Continuous monitoring of high-risk lakes and, where possible, controlled lowering of water levels (as done at South Lhonak through siphoning in 2016).
- Slope-sensitive flood zoning – Steep valleys spread damage vertically, so buildings must sit much higher above the riverbed; gentle valleys spread damage sideways and need different zoning.
- Rethink hydropower – A firm limit on construction above a defined altitude, cumulative impact studies for each river basin, and a review of projects like the Chenab-Beas link.
- Carrying capacity – Every hill town and tourist route should have a carrying capacity study; tourist and vehicle numbers can be regulated on that basis.
- Himalaya-specific rules – Separate Environmental Impact Assessment (EIA) norms, building codes and road design standards (tunnels, slope protection, scientific muck disposal) for mountain areas.
- Community and tradition – Use local knowledge, traditional architecture and nature-based solutions; involve panchayats in early warning and evacuation drills.
- Regional cooperation – A shared HKH system for real-time data exchange through ICIMOD, and pushing for loss and damage finance under the UNFCCC.
- Strengthen NMSHE – Link its research directly to project clearances and state planning, and give State Climate Change Cells more staff and funds.
The Himalayas are not just a mountain range but the base on which north India’s water, weather and food rest. Warming has changed their geology faster than our policies have changed. Hazard-averse, climate-resilient planning is now a necessity, not a choice.
Practice MCQ
Q1. Consider the following statements:
Statement-I: Rising temperatures increase the risk of rock avalanches and debris flows in the high Himalayas.
Statement-II: Permafrost fills fractures and joints in rock with ice and holds steep rock walls together.
Which one of the following is correct in respect of the above statements?
(a) Both Statement-I and Statement-II are correct and Statement-II explains Statement-I
(b) Both Statement-I and Statement-II are correct, but Statement-II does not explain Statement-I
(c) Statement-I is correct, but Statement-II is incorrect
(d) Statement-I is incorrect, but Statement-II is correct
Answer: (a). Warming thaws permafrost, which acts as a natural cement. Once the ice binding the rock melts, slopes lose strength and fail.
Mains Practice Question
Q. “The Himalayas are warming faster than the global average, turning a natural shield into a zone of cascading disasters.” Discuss the geographical and ecological significance of the Himalayas and examine the emerging threats to their stability. Suggest a development approach suited to the region. (15 marks, 250 words)
Source: https://anantamias.com/current-affairs/warming-himalayas-demand-a-rethink-on-development/
