

Introduction: A Global Snapshot of Overlapping Hardships
On 21 October 2025, the United Nations Development Programme (UNDP) and the Oxford Poverty and Human Development Initiative (OPHI) jointly released the Global Multidimensional Poverty Index (MPI) 2025, themed “Overlapping Hardships.” The flagship report tracks acute, non-monetary deprivations across 112 countries covering 6.3 billion people, and once again places India at the centre of a complex story: rapid escape from poverty alongside persistent rural-urban and caste-based inequities. According to the report, India lifted approximately 135 million people out of multidimensional poverty between 2015–16 and 2019–21, the steepest reduction recorded in absolute terms by any country during the comparable interval (hdr.undp.org).
For UPSC aspirants, the Global MPI is more than a headline — it is a lens that connects GS-II (international reports, governance) with GS-III (poverty, inclusive growth) and forms a methodological counterpart to the NITI Aayog National MPI. This year’s “Overlapping Hardships” theme stresses that deprivations rarely arrive alone: a child without proper nutrition is also likely to live in a household lacking clean cooking fuel, sanitation, or schooling. Understanding this overlap is critical to designing convergent policies under Sustainable Development Goal 1 (No Poverty).
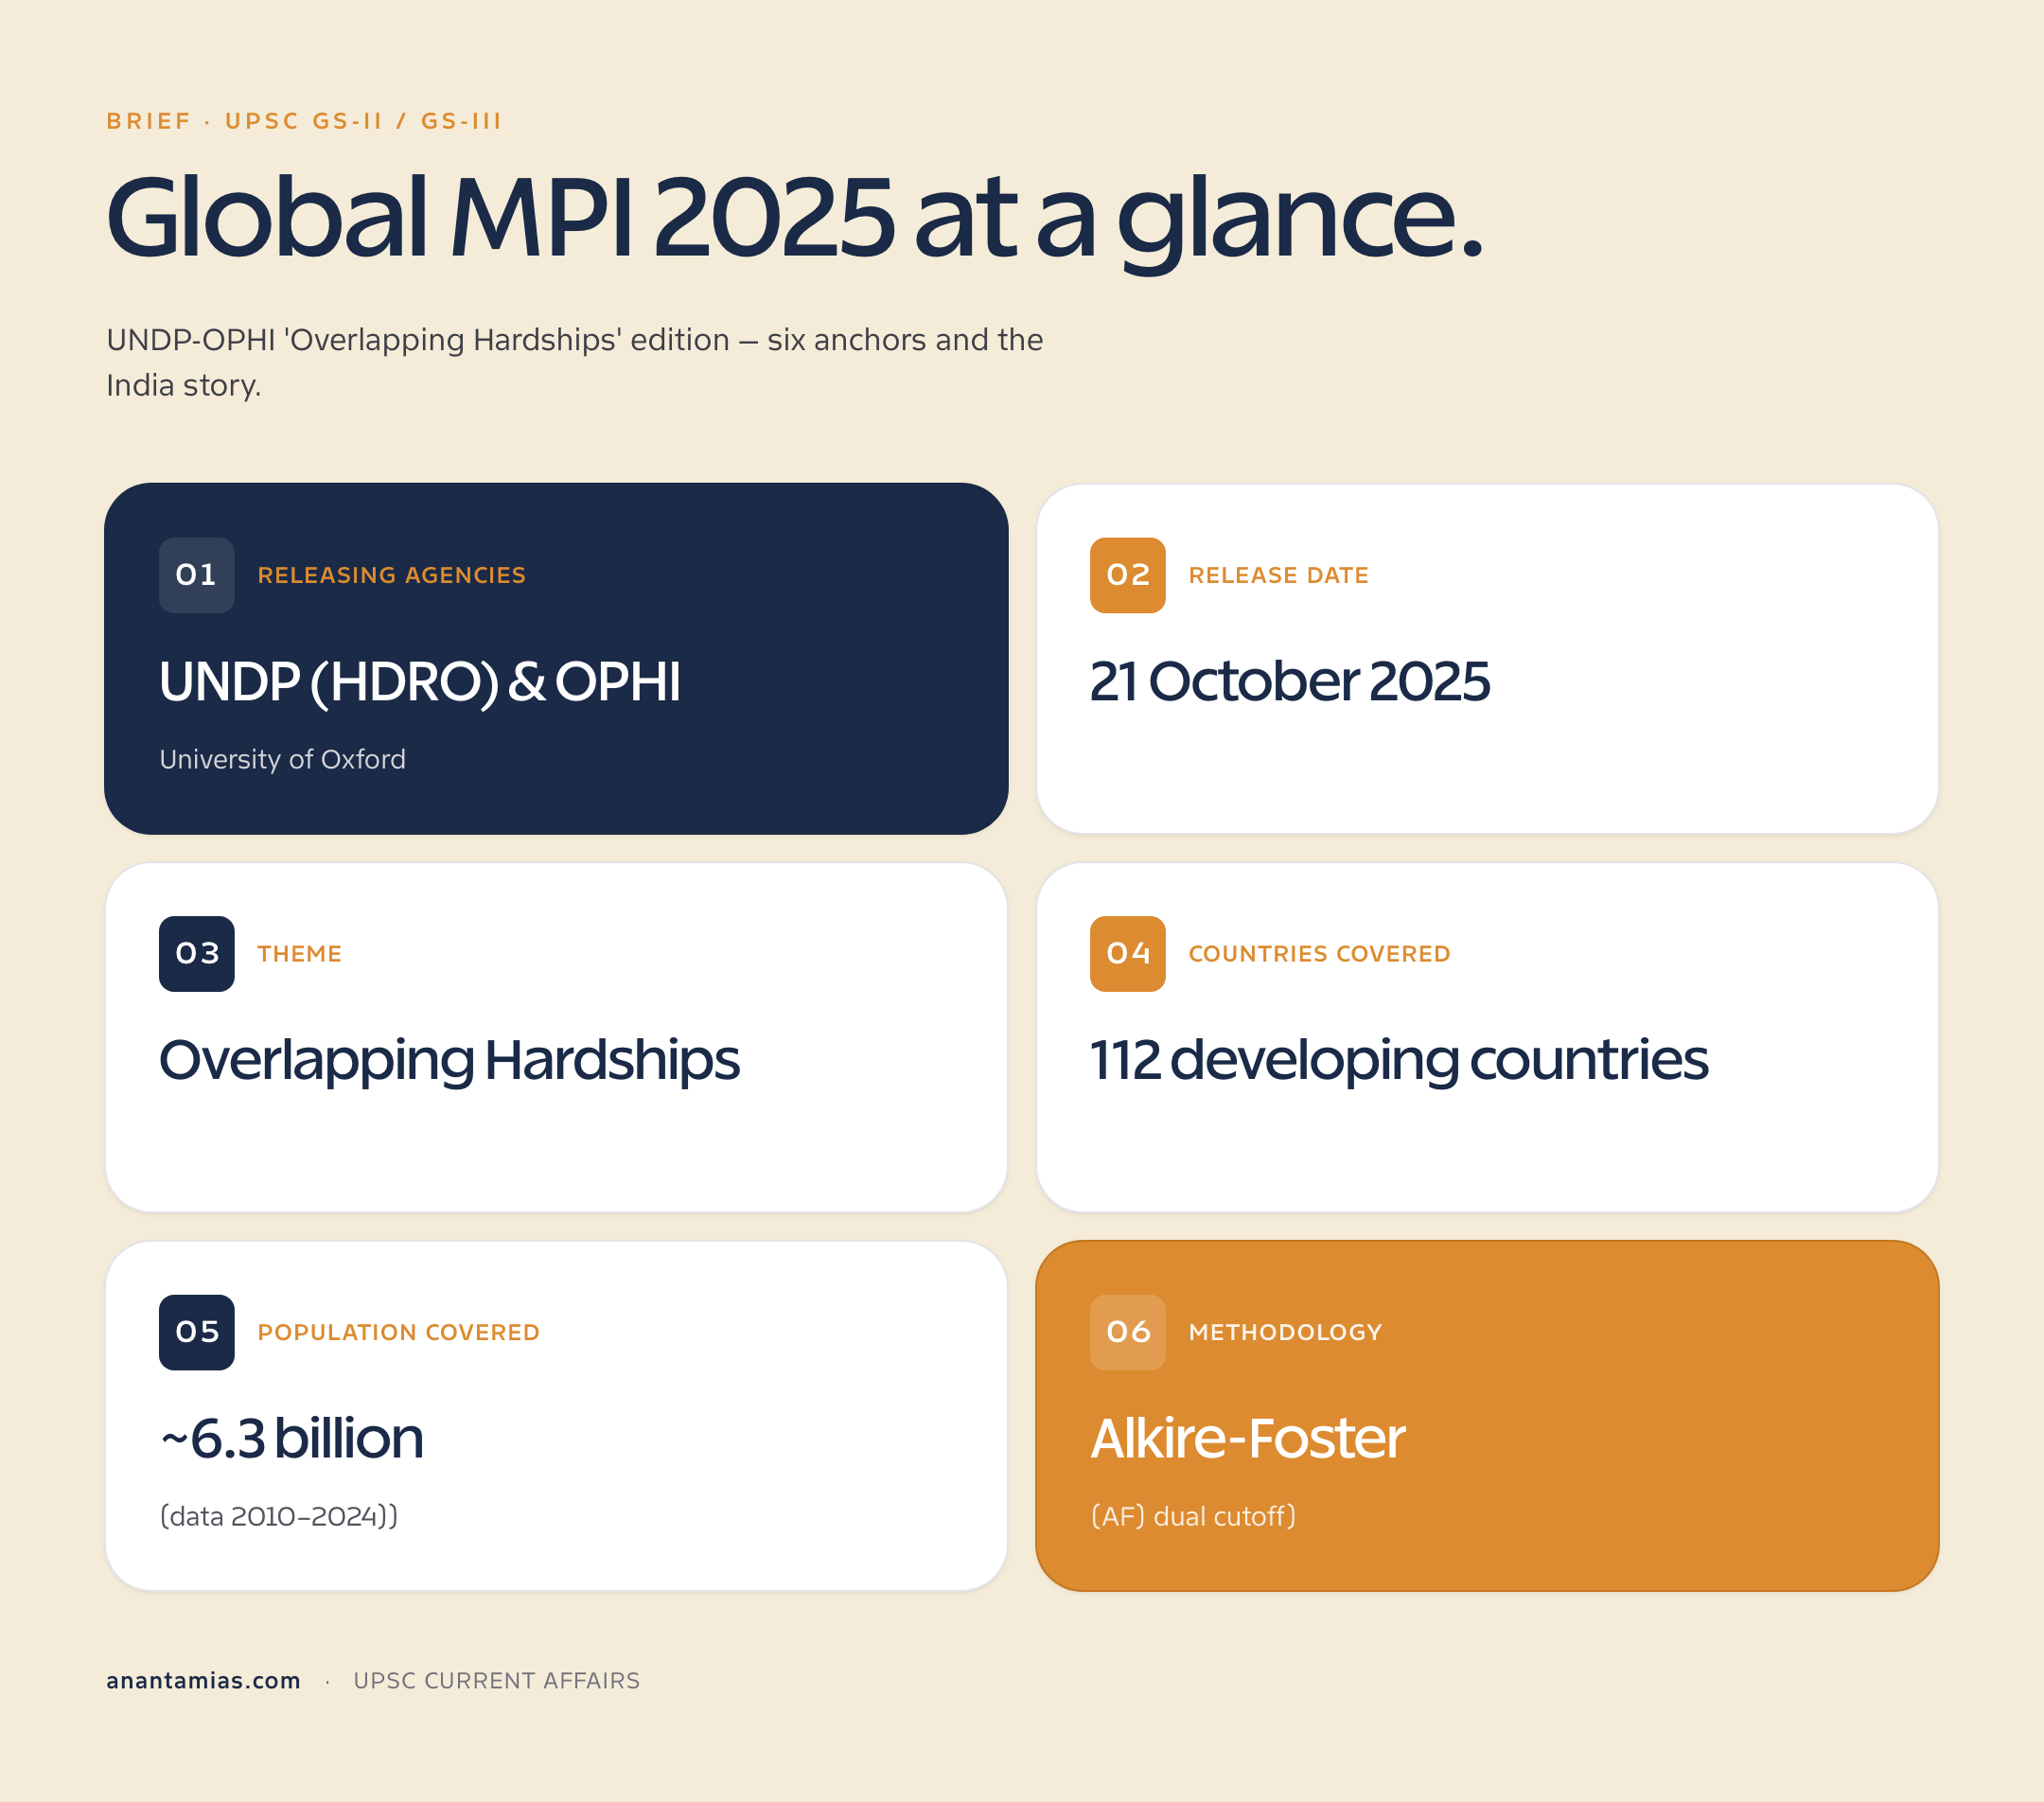
Quick Facts: Global MPI 2025 at a Glance
| Parameter | Detail | UPSC Tag |
|---|---|---|
| Releasing agencies | UNDP (HDRO) & OPHI, University of Oxford | GS-II IR |
| Release date | 21 October 2025 | Current Affairs |
| Theme | Overlapping Hardships | GS-III Poverty |
| Countries covered | 112 developing countries | Reports |
| Population covered | ~6.3 billion (data 2010–2024) | Coverage |
| Methodology | Alkire-Foster (AF) dual cutoff | GS-III |
| Dimensions | 3 — Health, Education, Living Standards | SDG 1, 3, 4, 6 |
| Indicators | 10 weighted indicators | Methodology |
| Poverty cutoff (k) | Deprivation score ≥ 33.3% | Threshold |
| India figure | ~135 million escaped MPI poverty (2015–16 to 2019–21) | India-specific |
Background: From Income Poverty to Multidimensional Poverty
For most of the twentieth century, poverty was treated almost exclusively as a money-metric concept — measured through household consumption expenditure or daily income thresholds such as the World Bank’s $2.15-a-day extreme poverty line. While monetary measures are tractable, they capture only one slice of deprivation. A family may earn just above the poverty line yet still lack a toilet, electricity, or schooling for its children. Conversely, a subsistence farming household with low monetary income may enjoy adequate housing, nutrition and community ties.
The conceptual shift was driven by Amartya Sen’s capability approach, which redefined development as the expansion of substantive freedoms. Building on this foundation, Sabina Alkire and James Foster developed the Alkire-Foster (AF) method in 2007–2010, which underpins the Global MPI launched by UNDP and OPHI in 2010. The MPI complements rather than replaces income measures, allowing policymakers to identify who is poor, in how many ways, and where the deprivations cluster. India was an early adopter: NITI Aayog released the National MPI Baseline Report in 2021 and the Progress Review in 2023, drawing on National Family Health Survey (NFHS-4 and NFHS-5) data (niti.gov.in).
The 2025 edition arrives at a critical juncture. With the 2030 deadline for the Sustainable Development Goals five years away, the world is significantly off-track on SDG 1.2, which aims to halve poverty in all its dimensions. The “Overlapping Hardships” theme zeroes in on the joint distribution of deprivations rather than headline counts — a methodological refinement that matters greatly for India’s heterogeneous states.
Key Features of Global MPI 2025
1. The Three-Dimension, Ten-Indicator Architecture
The Global MPI retains the architecture refined in 2018: three equally weighted dimensions — Health, Education, and Living Standards — operationalised through ten indicators, each carrying a fixed weight. A household is deprived in an indicator if it fails the international cutoff (for example, no member has completed six years of schooling). The deprivation scores are then summed; a household with a score of 33.3% or more is classified as “MPI poor.” Two headline measures emerge: the headcount ratio (H), the share of population that is poor, and the intensity (A), the average deprivation share among the poor. Their product, M0 = H × A, is the MPI value.
2. The “Overlapping Hardships” Lens
This year’s analytical innovation is the joint deprivation matrix, which maps how often specific deprivations co-occur within the same household. The 2025 report finds that nutrition deprivation overlaps with cooking-fuel deprivation in roughly 80% of South Asian poor households, and that sanitation, drinking water, and housing deprivations cluster heavily across rural sub-Saharan Africa. For India, the strongest overlap is between nutrition, cooking fuel, and housing — pointing to the continued relevance of Pradhan Mantri Ujjwala Yojana and PM Awas Yojana as convergence levers (ophi.org.uk).
3. India’s Trajectory and Inter-State Divergence
The 2025 update reaffirms that India’s MPI headcount fell from 27.7% (2015–16, NFHS-4) to roughly 16.4% (2019–21, NFHS-5), translating to about 135 million people escaping multidimensional poverty. The decline was sharpest in Bihar, Jharkhand, Uttar Pradesh, Madhya Pradesh and Rajasthan — the so-called BIMARU states — though absolute deprivation levels there remain among the highest. Urban poverty declined faster than rural; female-headed households and Scheduled Caste/Scheduled Tribe households continue to register higher MPI values, underscoring the equity question. Aspirants can read more in our deep-dive on NITI Aayog National MPI.
Significance for UPSC Aspirants
- GS-II Reports: Direct factual relevance — UNDP/OPHI is a high-frequency Prelims source; the report’s name, theme, and India-specific numbers are quotable.
- GS-III Inclusive Growth: Framework for analysing rural distress, regional inequality, and the limits of money-metric poverty lines.
- Methodological literacy: Understanding the Alkire-Foster dual cutoff distinguishes top scripts from average ones in Mains answers on poverty estimation.
- Policy convergence: Links to flagship schemes — POSHAN Abhiyaan, Jal Jeevan Mission, Swachh Bharat, Saubhagya, Ujjwala, PMAY.
- Federal angle: State-wise MPI data is the empirical backbone for cooperative federalism, finance commission devolution criteria, and Aspirational Districts Programme outcomes.
- Ethics & GS-IV: The “overlapping hardships” lens reinforces concepts of capability, dignity, and distributive justice in welfare delivery.
Detailed Analysis: India’s MPI — Dimensions, Indicators, and Weights
The table below decomposes the Global MPI architecture as applied to India. Note that the National MPI developed by NITI Aayog adds two India-specific indicators — maternal health and bank account — bringing the total to 12 indicators across the same three dimensions, with adjusted weights.
| Dimension (Weight) | Indicator | Weight | Deprivation Cutoff |
|---|---|---|---|
| Health (1/3) | Nutrition | 1/6 | Any adult or child is undernourished (BMI / stunting / underweight) |
| Health (1/3) | Child Mortality | 1/6 | Any child died in the household within the past 5 years |
| Education (1/3) | Years of Schooling | 1/6 | No household member aged 10+ has completed 6 years of schooling |
| Education (1/3) | School Attendance | 1/6 | Any school-age child not attending up to class 8 |
| Living Standards (1/3) | Cooking Fuel | 1/18 | Household cooks with dung, wood, charcoal or coal |
| Living Standards (1/3) | Sanitation | 1/18 | No improved sanitation or facility is shared |
| Living Standards (1/3) | Drinking Water | 1/18 | No improved source within 30 minutes round-trip |
| Living Standards (1/3) | Electricity | 1/18 | Household has no electricity |
| Living Standards (1/3) | Housing | 1/18 | Inadequate floor, roof or walls |
| Living Standards (1/3) | Assets | 1/18 | Owns at most one of: radio, TV, phone, bike, motorbike, fridge; and no car/truck |
This weighted structure means that a single Living Standards deprivation contributes only ~5.6% to the deprivation score, whereas a Health or Education deprivation contributes ~16.7%. For India, the largest single contributor to the headcount remains nutrition, followed by cooking fuel and housing — a finding consistent with NFHS-5 data. Aspirants should also consult our primer on poverty estimation in India for the parallel evolution of the Tendulkar, Rangarajan, and Suresh Tendulkar methodologies.
Challenges and Critiques
The Global MPI, despite its analytical power, faces persistent methodological and data challenges in the Indian context.
Data Lag — NFHS-5 vs NFHS-6: The 2025 estimates still rely on NFHS-5 (2019–21), now four to six years old. The next round, NFHS-6, was originally slated for 2023–24 but has been delayed; its results may not feed into the Global MPI before 2026–27. For a fast-changing economy emerging from COVID-19 and a wave of welfare scheme expansion, this lag means the published numbers may understate recent gains — or, conversely, miss pandemic-era reversals among the urban informal sector.
Indicator selection bias: Critics argue that the ten indicators emphasise capital-stock proxies (housing, assets) over flow variables like income volatility, debt burden, or learning outcomes. The absence of a quality of education indicator (only attendance and years are counted) is a long-standing concern, particularly given the Annual Status of Education Report (ASER) findings on declining foundational literacy. India’s National MPI partially addresses this via maternal health and financial inclusion, but global comparability suffers.
Equal weighting and substitutability: The AF method gives each dimension a one-third weight, which assumes implicit substitutability that is normatively contested. Why should sanitation deprivation weigh the same as schooling? The answer is partly pragmatic — equal weights are transparent and resistant to manipulation — but the assumption deserves scrutiny in Mains answers.
Sub-state heterogeneity: National and even state-level MPI averages mask intra-state divergence. Within Bihar, for instance, north Bihar districts perform worse than south; within Maharashtra, Vidarbha lags Pune-Mumbai. The Global MPI does not disaggregate below the state level — for that aspirants must turn to the National MPI’s district dashboards (NITI Aayog National MPI portal).
SC/ST and gender gaps: The 2025 report flags that Scheduled Tribe households experience MPI values nearly 1.7× the national average, and female-headed households continue to face elevated deprivation in nutrition and assets — issues that demand caste- and gender-disaggregated welfare design rather than universal templates.
Prelims Pointers
- Releasing agencies: UNDP (Human Development Report Office) + OPHI (University of Oxford).
- Year of first release: 2010; methodology refined in 2018.
- Methodology: Alkire-Foster dual cutoff method (M0 = H × A).
- Dimensions: 3 — Health, Education, Living Standards (each weighted 1/3).
- Indicators: 10 in Global MPI; 12 in India’s National MPI.
- Poverty cutoff (k): Deprivation score ≥ 33.3% = MPI poor; ≥ 50% = severely poor.
- India National MPI publisher: NITI Aayog (Baseline 2021, Progress Review 2023).
- Data source for India: National Family Health Survey (NFHS) — currently NFHS-5.
- Linked SDG: SDG 1 (End poverty in all its forms everywhere) — Target 1.2 specifically.
- Indian states with steepest MPI decline (2015–16 to 2019–21): Bihar, Uttar Pradesh, Madhya Pradesh, Jharkhand, Rajasthan (BIMARU bloc).
- Indicator with largest contribution to India’s MPI: Nutrition (Health dimension).
- Theme of MPI 2025: “Overlapping Hardships.”
Mains Practice Questions
- “Multidimensional poverty measurement complements rather than replaces income-based measures.” Critically examine in light of the Global MPI 2025 findings on India. (GS-III, 250 words)
- Discuss the methodological strengths and limitations of the Alkire-Foster method. How does India’s National MPI adapt it to domestic priorities? (GS-III, 250 words)
- Despite a sharp fall in headcount poverty, India continues to face overlapping hardships in nutrition, cooking fuel, and housing. Suggest a convergent policy framework. (GS-III, 250 words)
- Examine how data lag in NFHS rounds affects the credibility and policy utility of multidimensional poverty estimates in India. (GS-II/III, 150 words)
- To what extent does the persistence of caste- and gender-based deprivation gaps challenge the narrative of poverty decline in India? (GS-I/III, 250 words)
Conclusion
The Global MPI 2025 reaffirms India’s claim to the most consequential poverty reduction story of the past decade, while refusing to let that story flatten the inequalities that remain. The “Overlapping Hardships” theme is a useful reminder that poverty is rarely a single shortfall — it is a tangle of deprivations that reinforce one another. For policy, the implication is convergence: a targeted child-nutrition intervention paired with cooking-fuel access and sanitation upgrades will outperform any one of these pursued alone. For UPSC aspirants, the report is a goldmine — methodologically rich, factually citable, and directly linked to live debates on welfare delivery, federalism, and the SDG endgame. As the world enters the final five years of the 2030 Agenda, India’s experience will determine not only its own trajectory but also the global feasibility of ending multidimensional poverty in this generation. For complementary reading, see our overview of the Sustainable Development Goals.
Frequently Asked Questions
What is the Global Multidimensional Poverty Index (MPI) 2025?
The Global MPI 2025 is the annual report jointly published by the UNDP and OPHI on 21 October 2025, themed “Overlapping Hardships.” It measures acute non-monetary poverty across 112 countries using ten indicators in three dimensions — Health, Education, and Living Standards — and complements income-based poverty estimates.
How many people in India escaped multidimensional poverty according to MPI 2025?
The report estimates that approximately 135 million people in India moved out of multidimensional poverty between 2015–16 (NFHS-4) and 2019–21 (NFHS-5), with the headcount ratio falling from 27.7% to about 16.4%.
What is the Alkire-Foster methodology?
Developed by Sabina Alkire and James Foster, the AF method uses a dual cutoff: an indicator-level deprivation cutoff and a household-level poverty cutoff (typically 33.3%). The MPI value M0 is the product of the headcount ratio (H) and the average deprivation intensity (A).
How is India’s National MPI different from the Global MPI?
NITI Aayog’s National MPI retains the three dimensions but uses 12 indicators by adding maternal health and bank account ownership, with weights adjusted to fit India’s policy priorities. It also enables district-level disaggregation, which the Global MPI does not provide.
Which Indian states recorded the steepest decline in multidimensional poverty?
Bihar, Uttar Pradesh, Madhya Pradesh, Jharkhand, and Rajasthan — the historically lagging BIMARU states — recorded the sharpest absolute reductions, although they continue to host the largest number of MPI-poor people in the country.
What does “Overlapping Hardships” mean in the 2025 theme?
It refers to the joint occurrence of multiple deprivations within the same household. The 2025 report emphasises that nutrition, cooking fuel, sanitation and housing deprivations cluster together for most of the world’s MPI-poor, demanding convergent rather than siloed interventions.
Why does NFHS-5 data lag matter for the MPI?
The Global MPI 2025 still uses NFHS-5 (2019–21) data because NFHS-6 has been delayed. This means recent welfare scheme impacts and the post-pandemic recovery are not yet fully captured, which can lead to outdated estimates either over- or under-stating progress.
How does the Global MPI link to Sustainable Development Goal 1?
The Global MPI is the principal international tool for tracking SDG Target 1.2, which calls on countries to halve poverty in all its dimensions by 2030 according to national definitions. The MPI’s multidimensional design directly mirrors the SDG ethos of leaving no one behind.