How do we know who is poor? The answer has shaped Indian welfare since Independence. From Dadabhai Naoroji‘s 1901 subsistence calculations to NITI Aayog‘s MPI 2024, poverty estimation has evolved from a calorie-based yardstick to a multidimensional, outcome-based framework. For UPSC GS-I (poverty), GS-III (welfare economics), and Essay aspirants, understanding the genealogy of poverty lines is essential.
The Conceptual Framework
A poverty line is the monetary value of normative expenditure required for basic needs. It translates to the minimum income a person or family needs to avoid deprivation. Poverty can be measured in three broad ways:
| Approach | Focus |
|---|---|
| Income/consumption-based | Expenditure on food and non-food baskets |
| Capability-based (Amartya Sen) | Freedoms and functionings |
| Multidimensional | Health, education, standard of living |
Pre-Independence Estimates
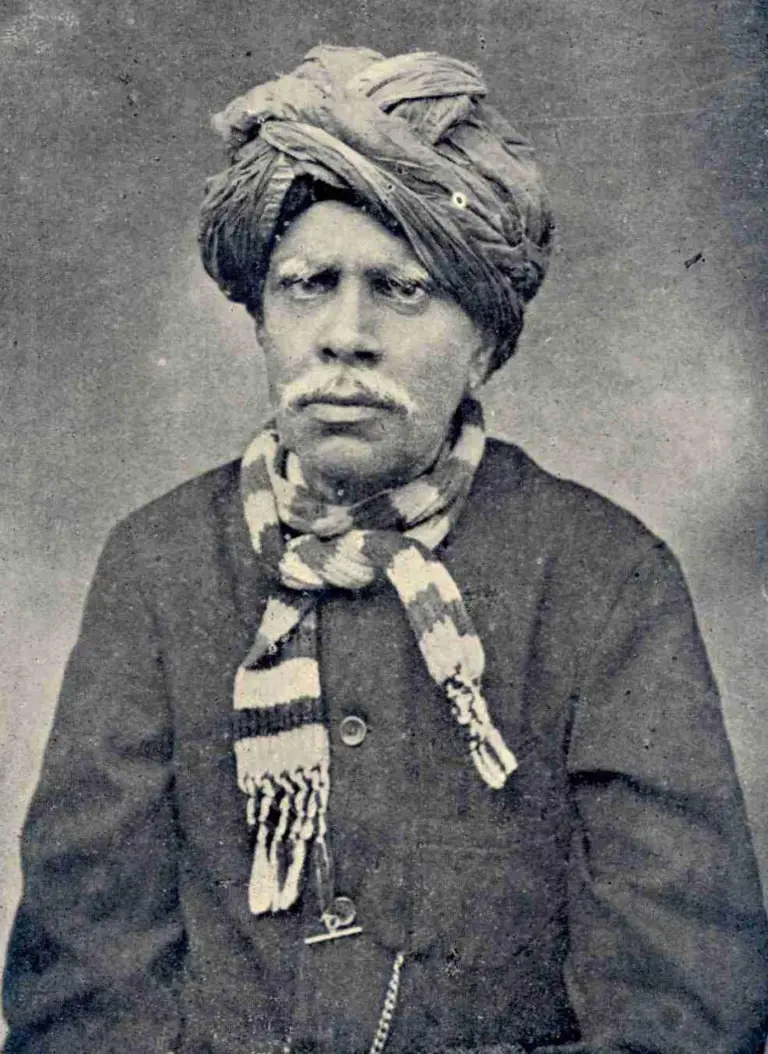
- Dadabhai Naoroji (1901): "Poverty and Un-British Rule in India" — calculated poverty line at 1867-68 prices based on cost of subsistence diet for emigrant coolies.
- National Planning Committee (1938): Under Jawaharlal Nehru — proposed a poverty line based on a minimum standard of living.
- Bombay Plan (1944): Industrialists proposed a more modest poverty line than NPC.
Post-Independence Committees
Working Group (1962)
- First quantification in independent India.
- Minimum food and non-food requirements for healthy living.
- Separate rural and urban lines.
- Excluded health and education (assumed state-provided).
Y.K. Alagh Committee (1979)
- Official poverty counts began.
- 2,400 kcal/capita/day rural, 2,100 kcal/capita/day urban.
- Different Poverty Line Baskets (PLBs) for rural and urban.
- Calorie-based approach set the template for two decades.
Lakdawala Expert Group (1993)
- Retained Alagh committee's poverty line nationally.
- Disaggregated to state-specific lines to reflect inter-state price differentials.
- Recommended CPI-IW (urban), CPI-AL (rural) for price updating.
Tendulkar Expert Group (2009)
A paradigmatic shift:
- Incorporated private expenditure on health and education in poverty line.
- Shifted from calorie norms to outcome-based targeting (nutrition, education, health).
- Uniform all-India urban PLB across rural and urban areas.
- Used Mixed Reference Period (MRP) instead of Uniform Reference Period (URP).
- Estimated poverty at 21.9% (269.8 million) for 2011-12.
Rangarajan Committee (2014)
- Reverted to separate rural and urban poverty estimates.
- Consumption baskets with calorie, protein, fat norms plus clothing, education, health, housing, transport.
- Estimated poverty at 29.5% (363 million) for 2011-12 — higher than Tendulkar.
- Report was never officially adopted; last Planning Commission release remains Tendulkar (2013).
India's Situation: Multidimensional Poverty
Limitations of Monetary Poverty Lines
- Miss health, education, housing, sanitation deficits.
- Ignore caste, gender, geography dimensions.
- Inconsistent with Amartya Sen's capability approach — which argues poverty is lack of freedoms, not just income.
Multidimensional Poverty Index (MPI)
The MPI, developed by UNDP and OPHI, uses 10 indicators across 3 dimensions:
| Dimension | Indicators | Weight |
|---|---|---|
| Health | Nutrition, child mortality | 1/3 |
| Education | Years of schooling, school attendance | 1/3 |
| Standard of Living | Cooking fuel, sanitation, drinking water, electricity, housing, assets | 1/3 |
MPI is the product of the incidence (H) and intensity (A) of multidimensional poverty: MPI = H × A.
NITI Aayog's India MPI
NITI Aayog adapted global MPI for India with 12 indicators across 3 dimensions, adding maternal health and bank account ownership.
| Year | India's MPI Headcount |
|---|---|
| 2005-06 | 55.3% |
| 2015-16 | 24.85% |
| 2019-21 | 14.96% |
| 2022-23 | 11.28% |
This reflects the fastest poverty reduction among major economies.
Socio-Economic Caste Census (SECC) 2011
- First caste-enumerating census since 1931.
- Used 3 categories: Automatically excluded, automatically included, and ranked on deprivation.
- Government used SECC for PMAY-G, DAY-NRLM, PM-JAY beneficiary identification.
SECC Limitations
- No household income/expenditure data.
- Response bias (households know responses determine benefits).
- Urban SECC data never publicly released.
Government Schemes and Institutional Framework
| Instrument | Purpose |
|---|---|
| Planning Commission → NITI Aayog | Estimates, coordination |
| NSSO Consumption Expenditure Surveys | Data base |
| SECC 2011 | Welfare targeting |
| India MPI (NITI Aayog) | Multidimensional poverty tracking |
| PMAY-G, PMAY-U | Housing |
| Ayushman Bharat | Health |
| PM-KISAN | Farmer income |
| PDS & NFSA 2013 | Food security |
| MGNREGA 2005 | Rural employment |
| Aspirational Districts Programme | 112 backward districts |
Challenges in Poverty Estimation
- Methodological gaps: Consumption-based estimates miss asset poverty.
- Data frequency: NSSO consumption surveys conducted only quinquennially; last comprehensive survey in 2011-12.
- 2017-18 CES controversy: Survey withheld citing data quality.
- 2022-23 HCES: Released in February 2024 — first consumption expenditure survey in 11 years; showed rural-urban per capita expenditure grew sharply.
- Inflation adjustment debates: CPI vs. state-specific indices.
- Dynamic poverty: Households move in and out of poverty over short periods.
- Hidden poverty: Urban homeless, migrant workers, de-notified tribes under-enumerated.
Latest Developments (2024-26)
- Household Consumption Expenditure Survey (HCES) 2022-23 released February 2024: showed rural MPCE doubled from 2011-12 to 2022-23; urban MPCE up 146%.
- NITI Aayog MPI Progress Report (July 2023): India lifted 13.5 crore people out of multidimensional poverty between 2015-16 and 2019-21.
- NITI Aayog discussion paper (January 2024): Estimated multidimensional poverty at 11.28% for 2022-23, further declining.
- World Bank (2024): Estimated extreme poverty in India at under 5% at $2.15/day PPP — a historic low.
- Bihar caste survey (2023): Revealed 34% of Bihar's households live on under Rs 6,000/month — reinforcing intersectional caste-poverty analysis.
- SDG India Index 2023-24: SDG 1 (No Poverty) composite score improved markedly.
- 2024 Lok Sabha elections: Poverty became a campaign issue; INDIA bloc promised Rs 1 lakh/year to women from poor households (Mahalakshmi Yojana).
- Women's Reservation Act, 2023: Expected to bring poverty concerns into legislative forefront.
- Caste census movement: Bihar, Karnataka, Telangana surveys pushing for disaggregated poverty data.
- Pradhan Mantri Garib Kalyan Anna Yojana: Extended for 5 years (2024-2028); free food grains for 81.35 crore beneficiaries.
- Aspirational Blocks Programme (2023): Expanded Aspirational Districts model to 500 blocks.
- Amartya Sen and capability debate: Continues to influence policy; debates on universal basic income (UBI) gaining traction.
UPSC Relevance
- Prelims: Tendulkar, Rangarajan, SECC 2011, MPI indicators.
- GS-I: Poverty and developmental issues.
- GS-II: Government policies and welfare schemes.
- GS-III: Economic growth, inclusive development.
- Essay: "Measuring poverty: from calories to capabilities."
Your answer should:
- Trace the historical evolution of poverty estimation — calorie-based → outcome-based → multidimensional.
- Cite Tendulkar, Rangarajan, and MPI data as empirical anchors.
- Invoke Amartya Sen's capability approach for theoretical grounding.
- Link poverty measurement to welfare targeting — PMAY, PM-JAY, PM POSHAN.
- Argue for a unified, transparent, regularly updated poverty measurement framework that combines income, consumption, and multidimensional approaches.
India's unprecedented decline in multidimensional poverty — from 55% (2005-06) to 11% (2022-23) — is a developmental achievement. But averages conceal inequities. The next generation of poverty measurement must be granular, caste-disaggregated, gender-aware, and geographically sensitive — so welfare reaches the last mile, not just the national average.
Tell Google you want more of this.
Add Anantam IAS as a preferred sourceOne tap, and this site shows up more often in your own Top Stories, AI Overviews and AI Mode. Remove it any time.