

Why in news:
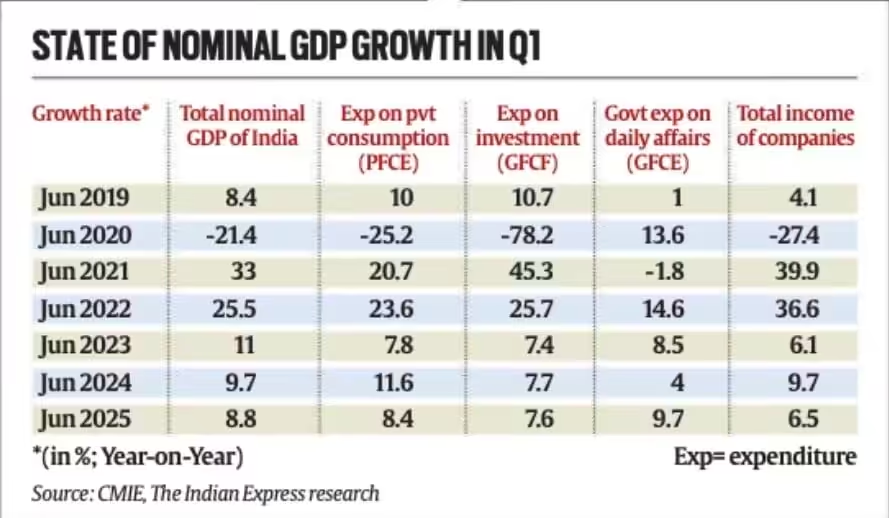
India’s GDP growth data has shown unusual trends — official data suggests that real GDP (after adjusting for inflation) has been growing faster than expected, yet private consumption and investment remain weak, raising questions on the true strength of the economy.
UPSC Relevance:
GDP, Calculation Methods of GDP, Key Terms of GDP etc.
UPSC PYQ
Q. A rapid increase in the rate of inflation is sometimes attributed to the “base effect”. What is “base effect”? (2011)
(a) It is the impact of drastic deficiency in supply due to failure of crops
(b) It is the impact of the surge in demand due to rapid economic growth
(c) It is the impact of the price levels of previous years on the calculation of inflation rate
(d) None of the statements (a), (b) and (c) given above is correct in this context
Q. Explain the difference between computing methodology of India’s Gross Domestic Product (GDP) before the year 2015 and after the year 2015. (2021)
About GDP:

- According to IMF
- GDP measures the monetary value of final goods and services—that is, those that are bought by the final user—produced in a country in a given period of time (say a quarter or a year).
Nominal V/s Real GDP
- Nominal GDP: It refers to the GDP at the current market prices i.e., the GDP is calculated as per the market prices for the year for which the GDP is calculated.
- Real GDP: It refers to the GDP at base year prices i.e., the GDP is calculated as per the market prices in the base year. Thus, the Real GDP negates the inflation in goods and services.
In case of high rate of inflation, the nominal GDP would be quite higher than the real GDP. However, in case of deflation, the real GDP would be higher than the nominal GDP.
Base Year:
- Government has formed 26-member Advisory Committee on National Accounts Statistics (NAS) to update the GDP base year from existing 2011-12 to 2022-23.
- A base year is the reference year whose prices are used to calculate the real growth (minus inflation) in national income.
GDP can be viewed in three different ways:
- The production approach sums the “value-added” at each stage of production, where value-added is defined as total sales less the value of intermediate inputs into the production process. For example, flour would be an intermediate input and bread the final product; or an architect’s services would be an intermediate input and the building the final product.
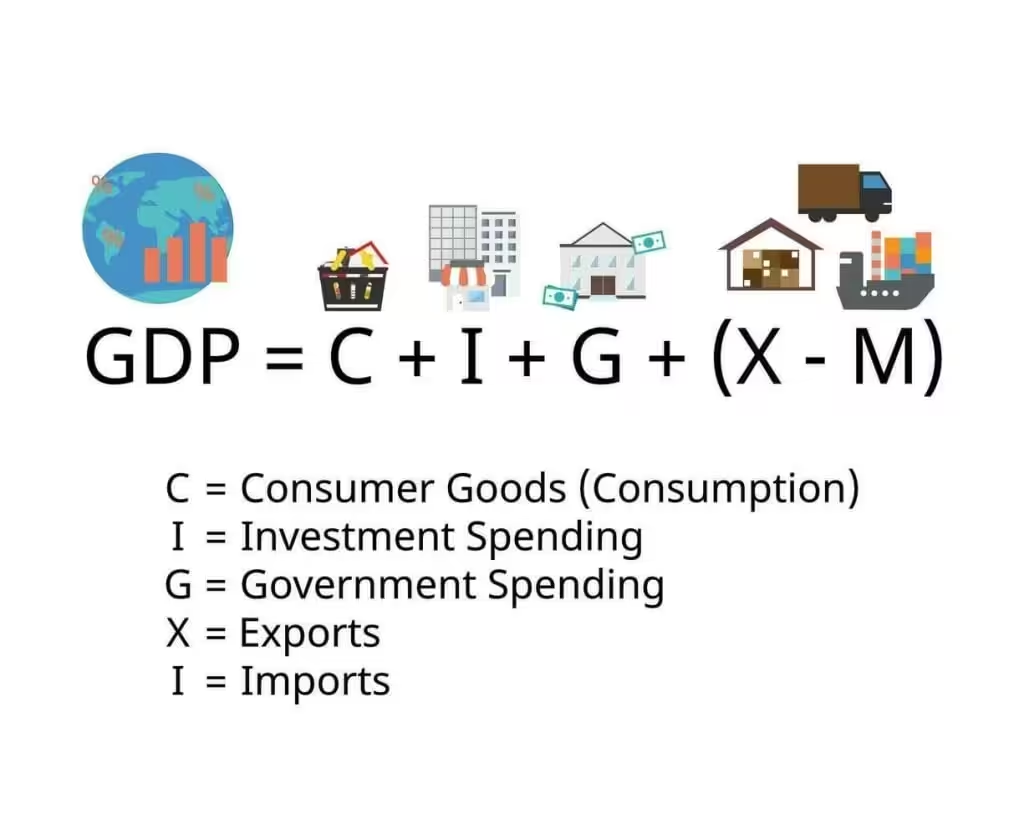
- The expenditure approach adds up the value of purchases made by final users—for example, the consumption of food, televisions, and medical services by households; the investments in machinery by companies; and the purchases of goods and services by the government and foreigners.
- The income approach sums the incomes generated by production—for example, the compensation employees receive and the operating surplus of companies (roughly sales less costs).
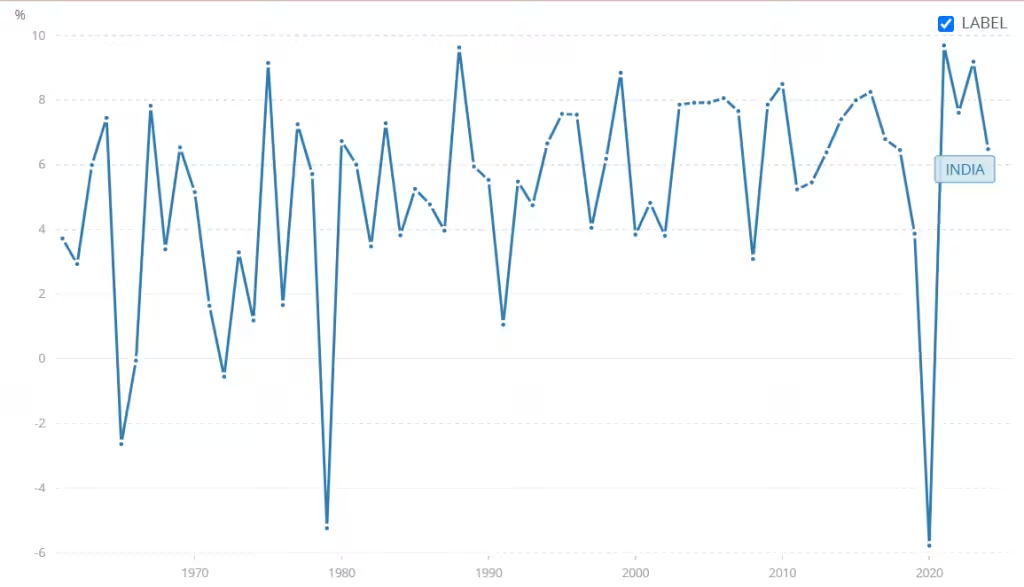
Trend of India’s GDP Growth rate:
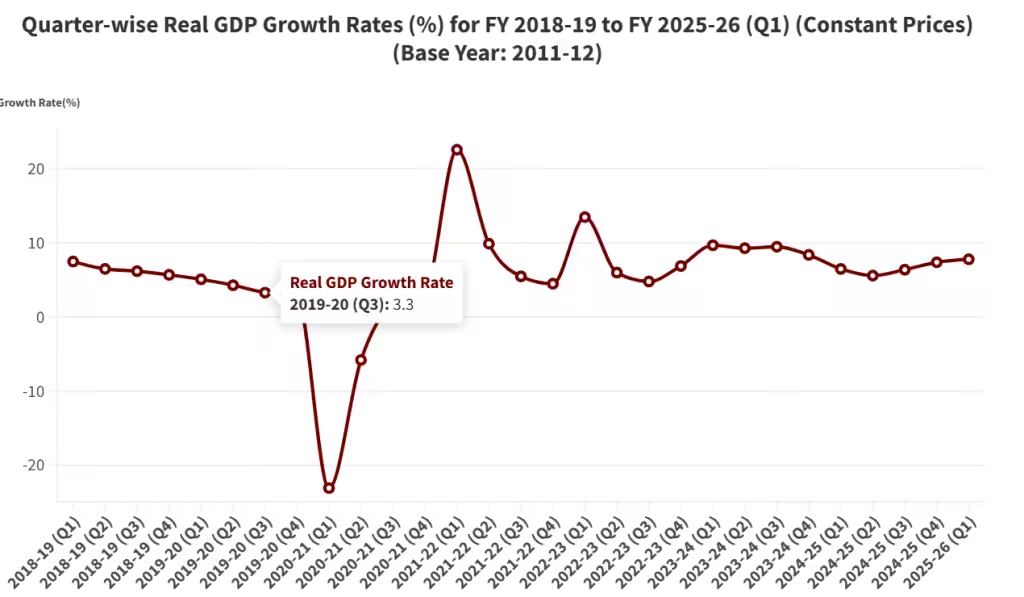
India GDP Growth rate 5 time negative according to world bank:
- 1965
- 1966
- 1972
- 1979
- 2020
Tell Google you want more of this.
Add Anantam IAS as a preferred sourceOne tap, and this site shows up more often in your own Top Stories, AI Overviews and AI Mode. Remove it any time.