Why in News?
The Ministry of Commerce and Industry released India’s July 2026 trade estimates on 13 August, reporting a sharp merchandise export rebound alongside an even larger increase in imports.
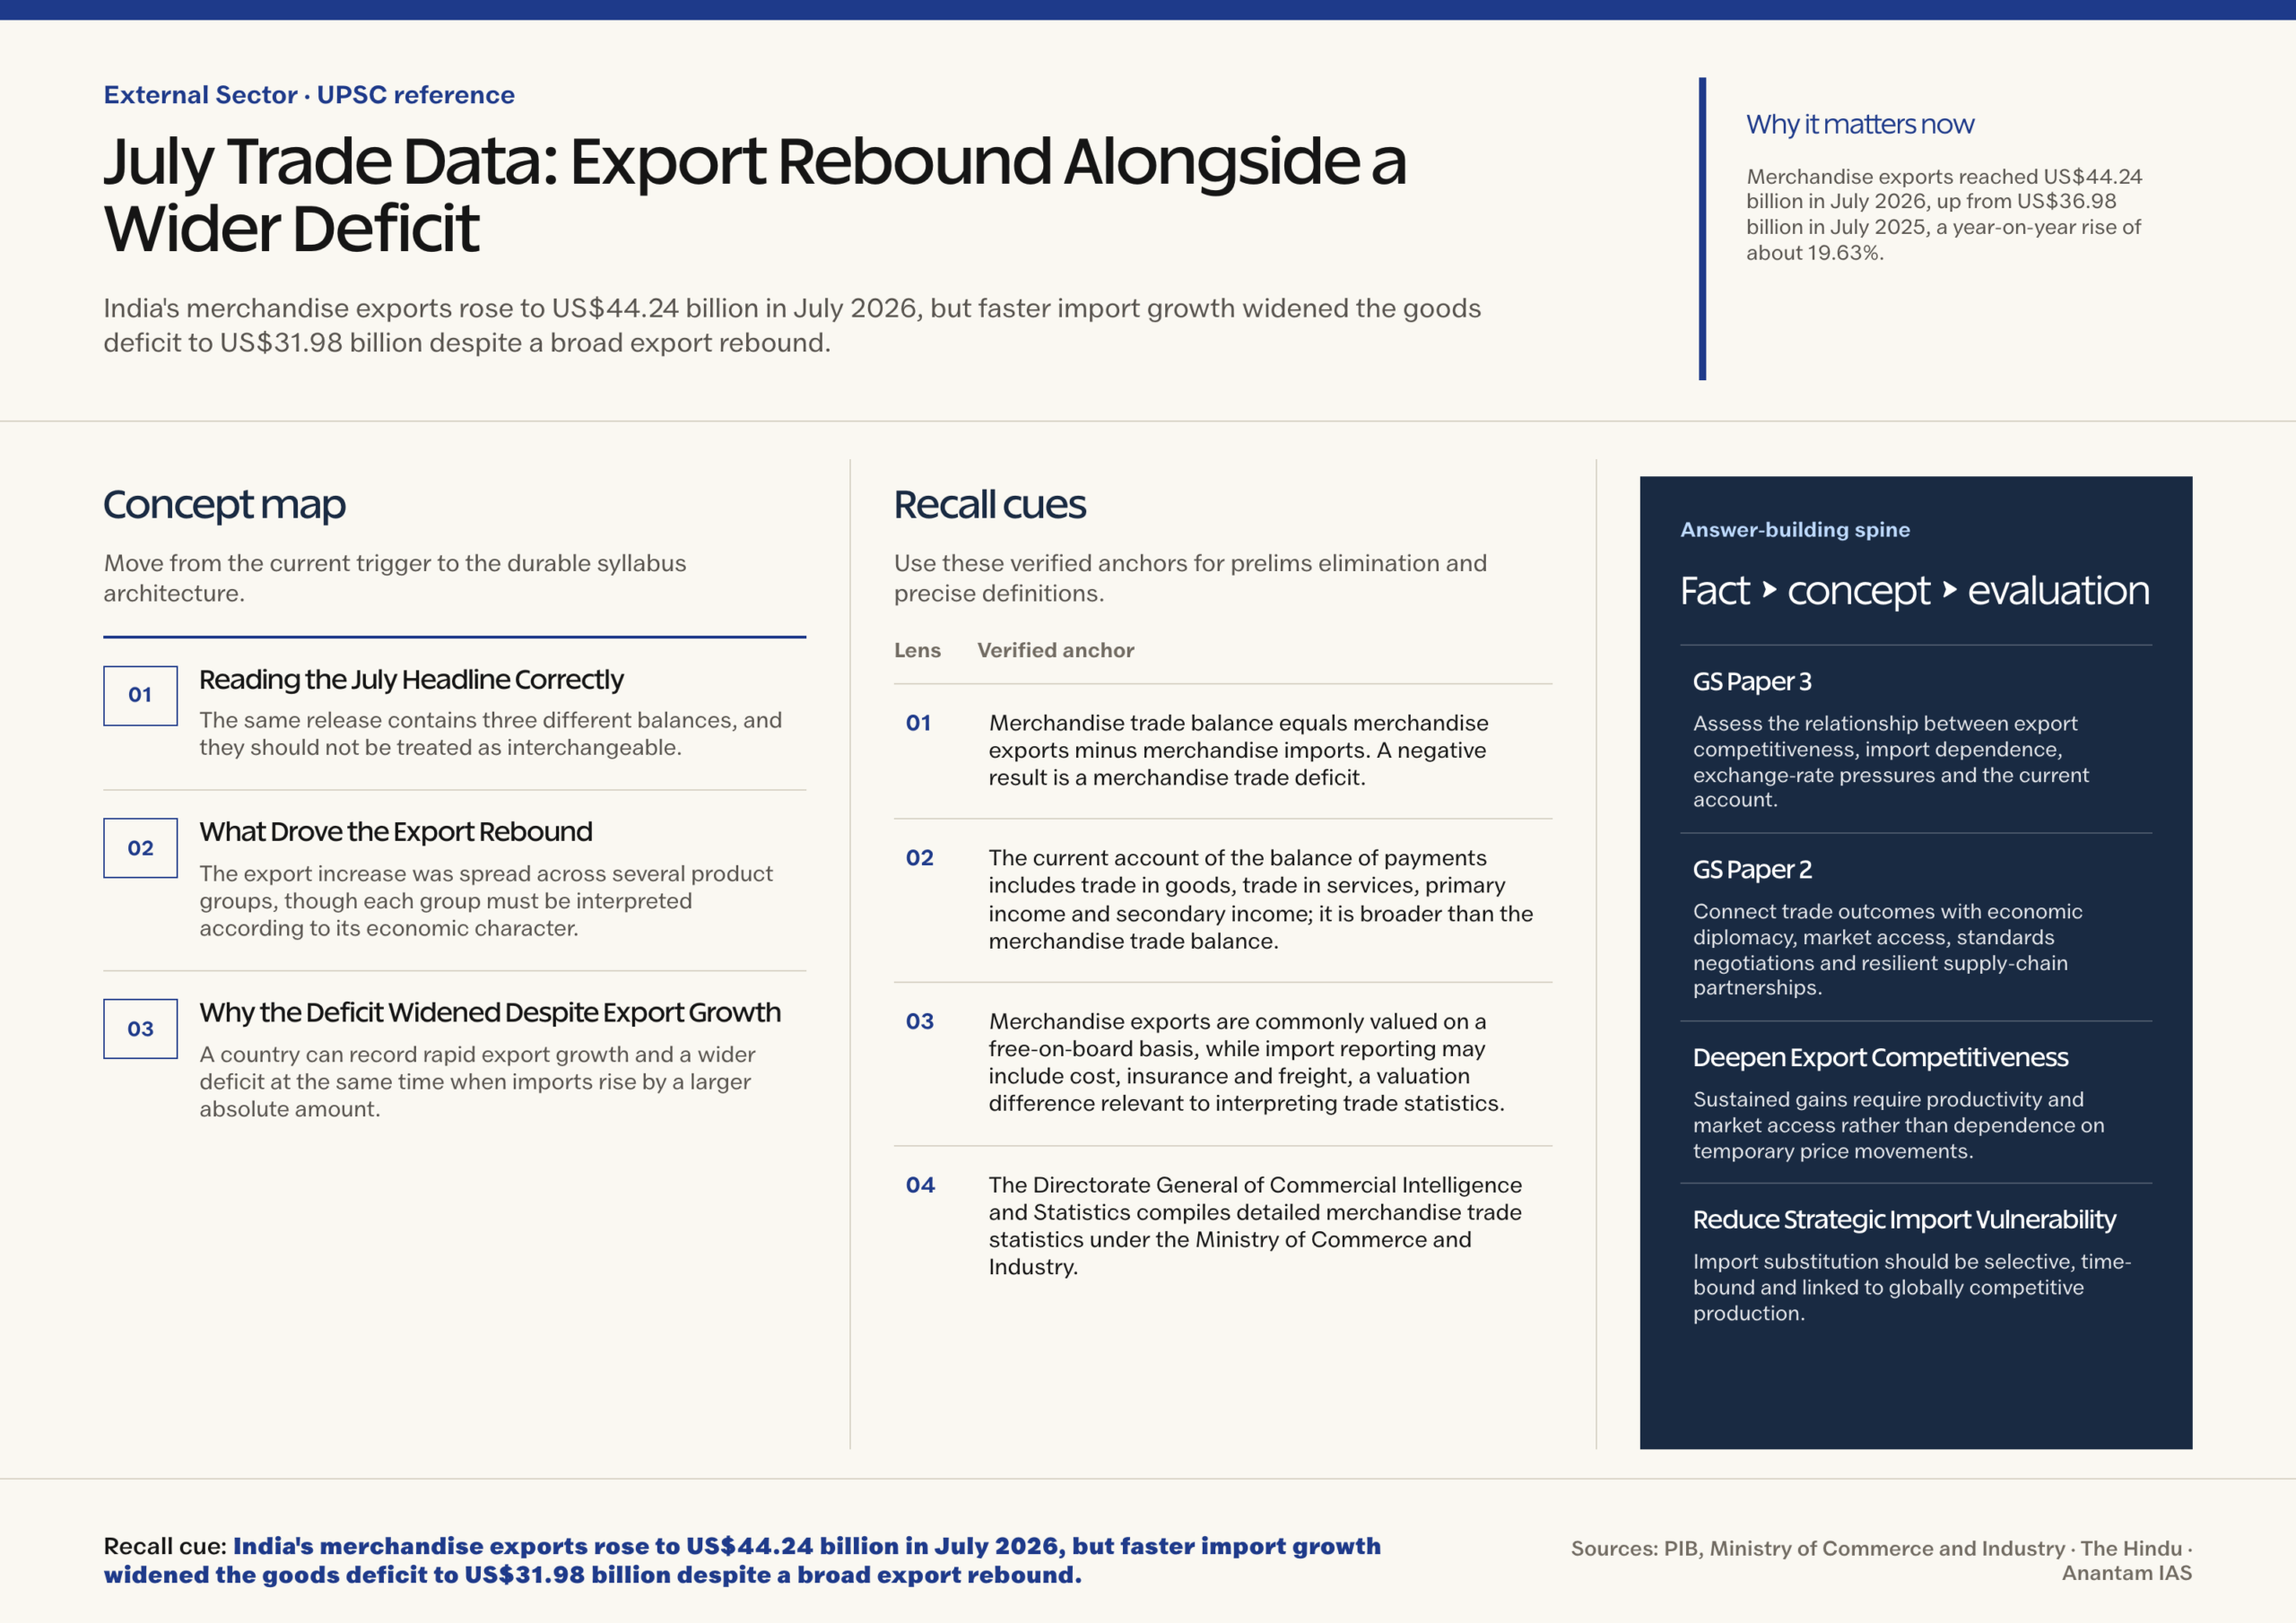
- Merchandise exports reached US$44.24 billion in July 2026, up from US$36.98 billion in July 2025, a year-on-year rise of about 19.63%.
- Merchandise imports increased to US$76.22 billion from US$64.86 billion. The resulting goods deficit was US$31.98 billion, compared with US$27.88 billion a year earlier.
- Estimated exports of goods and services together were US$80.14 billion, while combined imports were US$95.16 billion, leaving an estimated overall trade gap of US$15.03 billion for July.
- The services figures for July are estimates, because the latest services data available from the Reserve Bank of India at the time of the release were for June 2026.
- For April-July 2026-27, total exports were estimated at US$316.42 billion, 13.16% above the corresponding period of 2025-26, while total imports were estimated at US$365.85 billion.
- A trade deficit is not automatically evidence of economic weakness. Imports may include crude oil, machinery, electronics and industrial inputs that support production, but a persistent gap can add to external financing needs.
- India’s services surplus partly offsets its merchandise deficit. July’s estimated services exports of US$35.89 billion exceeded estimated services imports of US$18.94 billion by US$16.95 billion.
- The quality of export growth matters as much as its headline rate. Expansion in electronics and engineering goods may indicate deeper manufacturing capability, while petroleum-product values can also move with global prices and refining margins.
UPSC Relevance
Prelims Relevance
- Merchandise trade balance equals merchandise exports minus merchandise imports. A negative result is a merchandise trade deficit.
- The current account of the balance of payments includes trade in goods, trade in services, primary income and secondary income; it is broader than the merchandise trade balance.
- Merchandise exports are commonly valued on a free-on-board basis, while import reporting may include cost, insurance and freight, a valuation difference relevant to interpreting trade statistics.
- The Directorate General of Commercial Intelligence and Statistics compiles detailed merchandise trade statistics under the Ministry of Commerce and Industry.
- The Reserve Bank of India compiles balance-of-payments statistics and releases services-trade and external-sector data.
- July 2026 merchandise exports were US$44.24 billion and imports were US$76.22 billion; the arithmetic difference produced a US$31.98 billion deficit.
Mains Relevance
GS Paper 3
- Assess the relationship between export competitiveness, import dependence, exchange-rate pressures and the current account.
- Examine whether growth in electronics, engineering goods and processed products indicates movement toward a more diversified export basket.
GS Paper 2
- Connect trade outcomes with economic diplomacy, market access, standards negotiations and resilient supply-chain partnerships.
- Discuss the institutional roles of the Commerce Ministry, DGCI&S and RBI in producing and interpreting external-sector evidence.
Essay
- Economic resilience depends not on self-isolation but on the capacity to compete abroad while managing strategic import dependence.
Background and Context
Reading the July Headline Correctly
The same release contains three different balances, and they should not be treated as interchangeable.
- The merchandise balance compares physical goods exports of US$44.24 billion with goods imports of US$76.22 billion. It produced a deficit of US$31.98 billion.
- The estimated services balance was a surplus of US$16.95 billion, based on exports of US$35.89 billion and imports of US$18.94 billion.
- Combining goods and estimated services produced exports of US$80.14 billion, imports of US$95.16 billion and a combined deficit of about US$15.03 billion.
- The current-account balance cannot be inferred from this combined trade figure alone because primary income and transfers, including remittances, also enter the current account.
What Drove the Export Rebound
The export increase was spread across several product groups, though each group must be interpreted according to its economic character.
- Petroleum-product exports rose 67.64%, from US$4.13 billion in July 2025 to US$6.92 billion in July 2026. Their value reflects refinery output as well as global prices and margins.
- Electronic-goods exports increased 57.40%, from US$3.76 billion to US$5.92 billion. This is relevant to production-linked manufacturing, value-chain integration and domestic value addition.
- Engineering-goods exports rose 17.71%, from US$10.40 billion to US$12.24 billion, making this a major value contributor rather than merely a high-growth category from a small base.
- Organic and inorganic chemical exports increased 14.39% to US$2.80 billion, while cotton yarn, fabrics, made-ups and handloom products rose 8.40% to US$1.11 billion.
- Exports excluding petroleum and gems and jewellery reached US$35.00 billion, 14.86% above the US$30.47 billion recorded a year earlier. This measure helps test whether growth extends beyond volatile commodity categories.
Why the Deficit Widened Despite Export Growth
A country can record rapid export growth and a wider deficit at the same time when imports rise by a larger absolute amount.
- Goods exports increased by US$7.26 billion year on year, while goods imports increased by US$11.36 billion. The extra import increase exceeded the extra export earnings by US$4.10 billion.
- The merchandise deficit consequently expanded from US$27.88 billion in July 2025 to US$31.98 billion in July 2026.
- Imports excluding petroleum and gems and jewellery rose from US$43.07 billion to US$51.82 billion. This points to broad import demand rather than a gap explained only by fuel or precious metals.
- The official destination data also showed strong export growth to markets including the United States, China, Singapore, Kenya and Malaysia, while import values rose sharply from Russia, China, Oman, Taiwan and the United States.
- Destination growth percentages do not reveal market size by themselves. Policy analysis should use both the change in value and the underlying base before drawing conclusions about diversification.
The Cumulative April-July Picture
The four-month trend reduces the risk of overreading a single volatile month.
- Merchandise exports during April-July 2026-27 were US$173.78 billion, up 17.04% from US$148.48 billion in the corresponding period.
- Merchandise imports were US$292.38 billion, producing a cumulative goods deficit of US$118.60 billion, compared with US$96.66 billion a year earlier.
- Estimated services exports were US$142.64 billion and services imports were US$73.47 billion, yielding a services surplus of US$69.17 billion.
- Goods and services together produced an estimated trade deficit of US$49.43 billion for April-July, compared with US$32.32 billion in April-July 2025-26.
- The period’s total export growth of 13.16% was strong, but total import growth was faster at 17.28%, explaining why the combined gap widened.
Way Forward
Deepen Export Competitiveness
- Lower logistics time and cost through efficient ports, multimodal freight links, digital customs processes and predictable border clearances.
- Help micro, small and medium enterprises meet quality, safety and sustainability standards through testing infrastructure, affordable certification and export credit.
- Use trade agreements and commercial diplomacy to secure market access while preparing domestic firms for rules of origin and non-tariff requirements.
Conclusion
- July 2026 delivered a genuine export rebound , including strong growth in electronics and engineering goods.
- India’s durable objective should be a more competitive and diversified export base, a broader services surplus and lower strategic import vulnerability.
UPSC Practice Questions
Prelims MCQ 1
With reference to India’s external-sector statistics, consider the following statements:
- The merchandise trade balance compares exports and imports of goods.
- The current account includes goods, services, primary income and secondary income.
- A merchandise trade deficit necessarily means that the current account is also in deficit.
How many of the above statements are correct?
(a) Only one (b) Only two (c) All three (d) None
Answer: (b) Only two
Explanation:
Statements 1 and 2 are correct. Statement 3 is incorrect because a services surplus, net transfers and other current-account components can partly or fully offset a merchandise deficit.
Prelims MCQ 2
Which one of the following best explains why India’s merchandise trade deficit widened in July 2026 even though merchandise exports rose strongly?
(a) Services imports were included in merchandise imports (b) Merchandise imports rose by a larger absolute amount than merchandise exports (c) Export values were reported in rupees while imports were reported in dollars (d) The merchandise balance excludes petroleum products
Answer: (b) Merchandise imports rose by a larger absolute amount than merchandise exports
Explanation:
Goods exports increased by US$7.26 billion year on year, while goods imports increased by US$11.36 billion. The larger absolute rise in imports widened the merchandise deficit from US$27.88 billion to US$31.98 billion.
UPSC Mains Questions
- India’s export rebound and widening merchandise trade deficit are not contradictory outcomes. Explain with reference to the composition and interpretation of recent trade data. (150 words)
- Examine the role of services exports in cushioning India’s merchandise trade deficit. What risks arise from relying excessively on this cushion? (250 words)
Sources: PIB, Ministry of Commerce and Industry and The Hindu.
Frequently Asked Questions
What was India’s merchandise trade deficit in July 2026?
Merchandise exports were US$44.24 billion and imports were US$76.22 billion. Their difference produced a goods deficit of US$31.98 billion, wider than the US$27.88 billion deficit calculated for July 2025.
How could exports rise while the trade deficit widened?
A deficit depends on the gap between exports and imports, not export growth alone. Goods exports rose by US$7.26 billion year on year, but goods imports rose by US$11.36 billion. The larger absolute increase in imports widened the gap.
What was the July 2026 goods-and-services trade balance?
Estimated goods-and-services exports were US$80.14 billion and imports were US$95.16 billion, leaving a combined deficit of about US$15.03 billion. This was smaller than the merchandise deficit because the estimated services balance was positive.
Are the July 2026 services figures final?
No. The Commerce Ministry marked them as estimates because the latest services-sector data released by the RBI at the time covered June 2026. The figures may change when complete data and later balance-of-payments revisions become available.
Which sectors led merchandise export growth in July 2026?
The official release highlighted petroleum products, electronic goods, engineering goods, organic and inorganic chemicals, and cotton yarn, fabrics, made-ups and handloom products. Electronics rose 57.40%, while engineering goods rose 17.71% year on year.
Tell Google you want more of this.
Add Anantam IAS as a preferred sourceOne tap, and this site shows up more often in your own Top Stories, AI Overviews and AI Mode. Remove it any time.