Why in News?
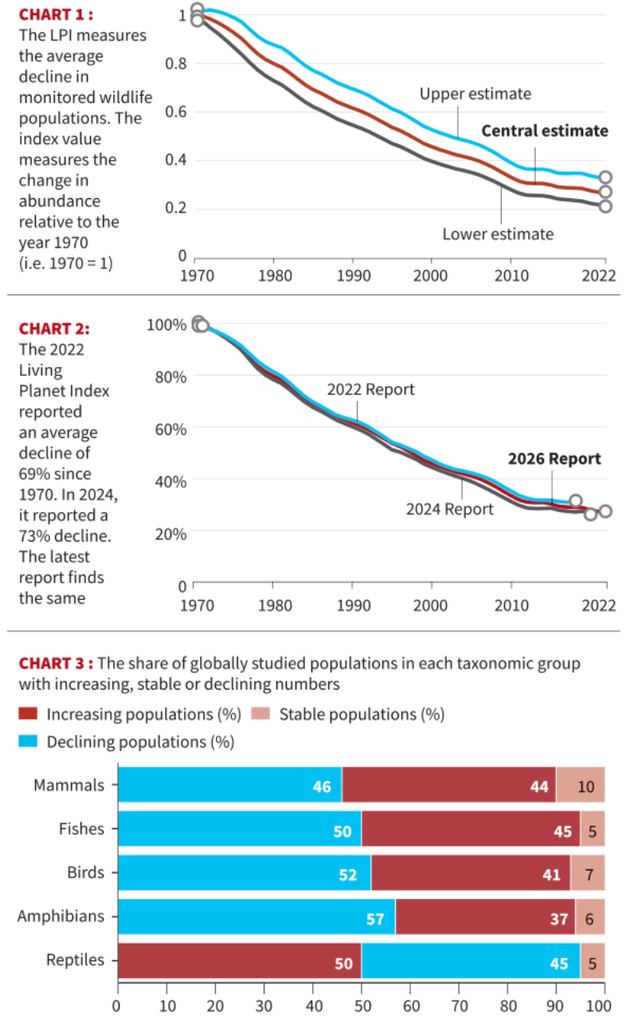
The World Wide Fund for Nature (WWF) released its biennial Living Planet Report 2026, titled “The Science of Hope”. The report reveals a 73% average decline in monitored vertebrate population sizes globally between 1970 and 2022.
| UPSC Relevance: GS-3 Environment & Biodiversity: Conservation Prelims: Living Planet Index (LPI), World Wide Fund for Nature (WWF), Kunming-Montreal Global Biodiversity Framework (KMGBF). |
About the Living Planet Report and Index:
- Living Planet Report (LPR): A flagship biennial assessment published by WWF evaluating global ecological trends, pressures, and systemic solutions.
- Living Planet Index (LPI): A crucial indicator developed by the Zoological Society of London (ZSL) in partnership with WWF, forming the central quantitative component of the report.
- Metric Measured: Tracks the average proportional change in the abundance of monitored populations of vertebrates (mammals, birds, fish, reptiles, and amphibians) over time.
- What the 73% Figure Represents: It indicates the geometric mean of the rates of change across 35,803 studied populations of across 5790 vertebrate species (mammals, birds, reptiles, amphibians, and fish) spanning the period 1970-2022.
- Scope Limitation: The headline global index excludes plants, fungi, and invertebrates (e.g., insects, corals), focusing strictly on vertebrate datasets.
- Baseline Comparison: The aggregated trend is indexed relative to the baseline year 1970 (set at a starting value of 1).
Species vs. Population Concept: A biological species often comprises multiple geographically isolated populations. E.g., Royal Bengal Tiger in the Western Ghats and the Sundarbans belong to the same species but constitute two distinct monitored populations in the LPI.
Major Findings of the Living Planet Report 2026:
1. Overall Decline vs. Differing Population Trends
The global index registers an average decline of 73%, but the distribution of individual monitored population trends is heterogeneous:
- 50% of monitored populations are declining.
- 43% of monitored populations are increasing.
- 7% of monitored populations remain stable.
2. Regional Variation
The average decline in monitored vertebrate population sizes varies sharply by geographic region:
- Latin America and the Caribbean: 95% average decline
- Africa: 80% average decline
- Asia-Pacific: 49% average decline
- North America: 28% average decline
- Europe and Central Asia: 23% average decline
3. Freshwater Ecosystems Face the Steepest Decline
When broken down by primary ecosystem type, the average declines are:
- Freshwater Ecosystems: 85% decline (driven by dams, habitat fragmentation, pollution, and water extraction)
- Terrestrial Ecosystems: 69% decline
- Marine Ecosystems: 59% decline
Note: The LPI is an indicator of population abundance trends; it is not a global wildlife census or an extinction tracker.
Major Drivers of Wildlife Decline:
- Habitat Loss and Degradation: Primarily driven by land-use change, unsustainable agricultural expansion, and infrastructure fragmentation.
- Overexploitation: Driven by unsustainable hunting, poaching, wildlife trafficking, and commercial overfishing.
- Climate Change: Causes shifts in thermal niches, alters migration timing, and accelerates ecosystem tipping points via extreme weather events.
- Pollution: Includes chemical runoff, plastics, agricultural pesticides, and heavy metal contamination of terrestrial and aquatic food webs.
- Invasive Alien Species and Disease: Introduces novel competition, predation, and pathogens to vulnerable native populations.
Important Limitations in Interpretation:
- Incomplete Representation of Biodiversity: The headline index tracks only monitored vertebrates. It cannot serve as a proxy for trends across plants, fungi, insects, or marine invertebrates, which form the structural baseline of ecosystems.
- Uneven Monitoring (Data Biases): Wildlife records are unevenly distributed. Data-rich regions (North America, Europe) and high-profile taxonomic groups (birds, mammals) are heavily over-represented compared to tropical, data-poor regions.
- The 1970 Baseline excludes Earlier Ecological Losses: A lower post-1970 decline in Europe (-23%) or North America (-28%) does not imply healthier ecosystems. These regions underwent massive habitat destruction, industrialisation, and resource exploitation long before 1970.
- Population Growth is not Complete Recovery: A population showing an upward trend may still be profoundly depleted or ecologically non-functional compared to its historical baseline.
Conservation Implications and Relevance for India:
- Prioritise Threatened Populations and Habitats: Conservation resources must shift toward localised, evidence-based interventions targeting regions with severe abundance collapses (such as freshwater biomes), rather than relying solely on global aggregations.
- Sustain Successful Conservation Models: Stable or growing populations require sustained regulatory protection. India’s success with flagship species such as the Project Tiger expansions, Project Elephant, and the recovery of the Greater One-Horned Rhinoceros provides institutional models that can be adapted for other threatened species.
- Strengthen Freshwater Conservation: India’s inland aquatic ecosystems face immense pressure. Policy focus must expand from terrestrial forest reserves to ensuring environmental flows (E-flows) in rivers, restoring wetland connectivity (under the Ramsar Convention and Amrit Dharohar), controlling industrial effluent, and regulating unsustainable inland fisheries.
- Improve Monitoring Beyond Flagship Species: India needs to scale up systematic, long-term monitoring of non-flagship vertebrates (E.g., small mammals, amphibians, nocturnal reptiles). Concurrently, independent monitoring programs must be developed for tracking plants and insects.
- Combine Composite Biodiversity Indicators: The LPI should not be used in isolation. Indian policymakers must synthesise abundance trends alongside extinction-risk metrics (like the IUCN Red List Index) and habitat intactness indicators (such as the Biodiversity Intactness Index).
The findings of the LPI serve as a key tracking mechanism for monitoring progress toward the 2030 targets under the Kunming-Montreal Global Biodiversity Framework (KMGBF).
Prelims Practice MCQ:
Q. Consider the following statements regarding the findings and methodology of the Living Planet Report 2026:
- A global Living Planet Index (LPI) decline of 73% mathematically implies that every individual monitored vertebrate population has shrunk by approximately three-quarters of its 1970 baseline size.
- The index calculation is restricted entirely to monitored populations of vertebrate species, completely excluding plants and invertebrates.
Which of the statements given above is/are correct?
(a) 1 only
(b) 2 only
(c) Both 1 and 2
(d) Neither 1 nor 2
Answer: (b)
Explanation:
- Statement 1 is incorrect: The 73% figure is an aggregated average of proportional changes, not a uniform reduction across the board. In reality, 43% of tracked populations are actively increasing, and 7% are stable. Extreme, catastrophic collapses in a subset of heavily impacted populations pull the geometric mean down drastically.
- Statement 2 is correct: The headline global index focuses strictly on vertebrate data (mammals, birds, fish, reptiles, and amphibians). It excludes plants, fungi, and invertebrates (such as insects or corals), which is a key structural limitation of the indicator.
Tell Google you want more of this.
Add Anantam IAS as a preferred sourceOne tap, and this site shows up more often in your own Top Stories, AI Overviews and AI Mode. Remove it any time.