
Why in News?
The National Statistics Office under MoSPI released the Periodic Labour Force Survey Monthly Bulletin for June 2026 on 15 July 2026. It is the fifteenth bulletin in the monthly series and reports all-India labour-market indicators for persons aged 15 years and above under the Current Weekly Status approach.
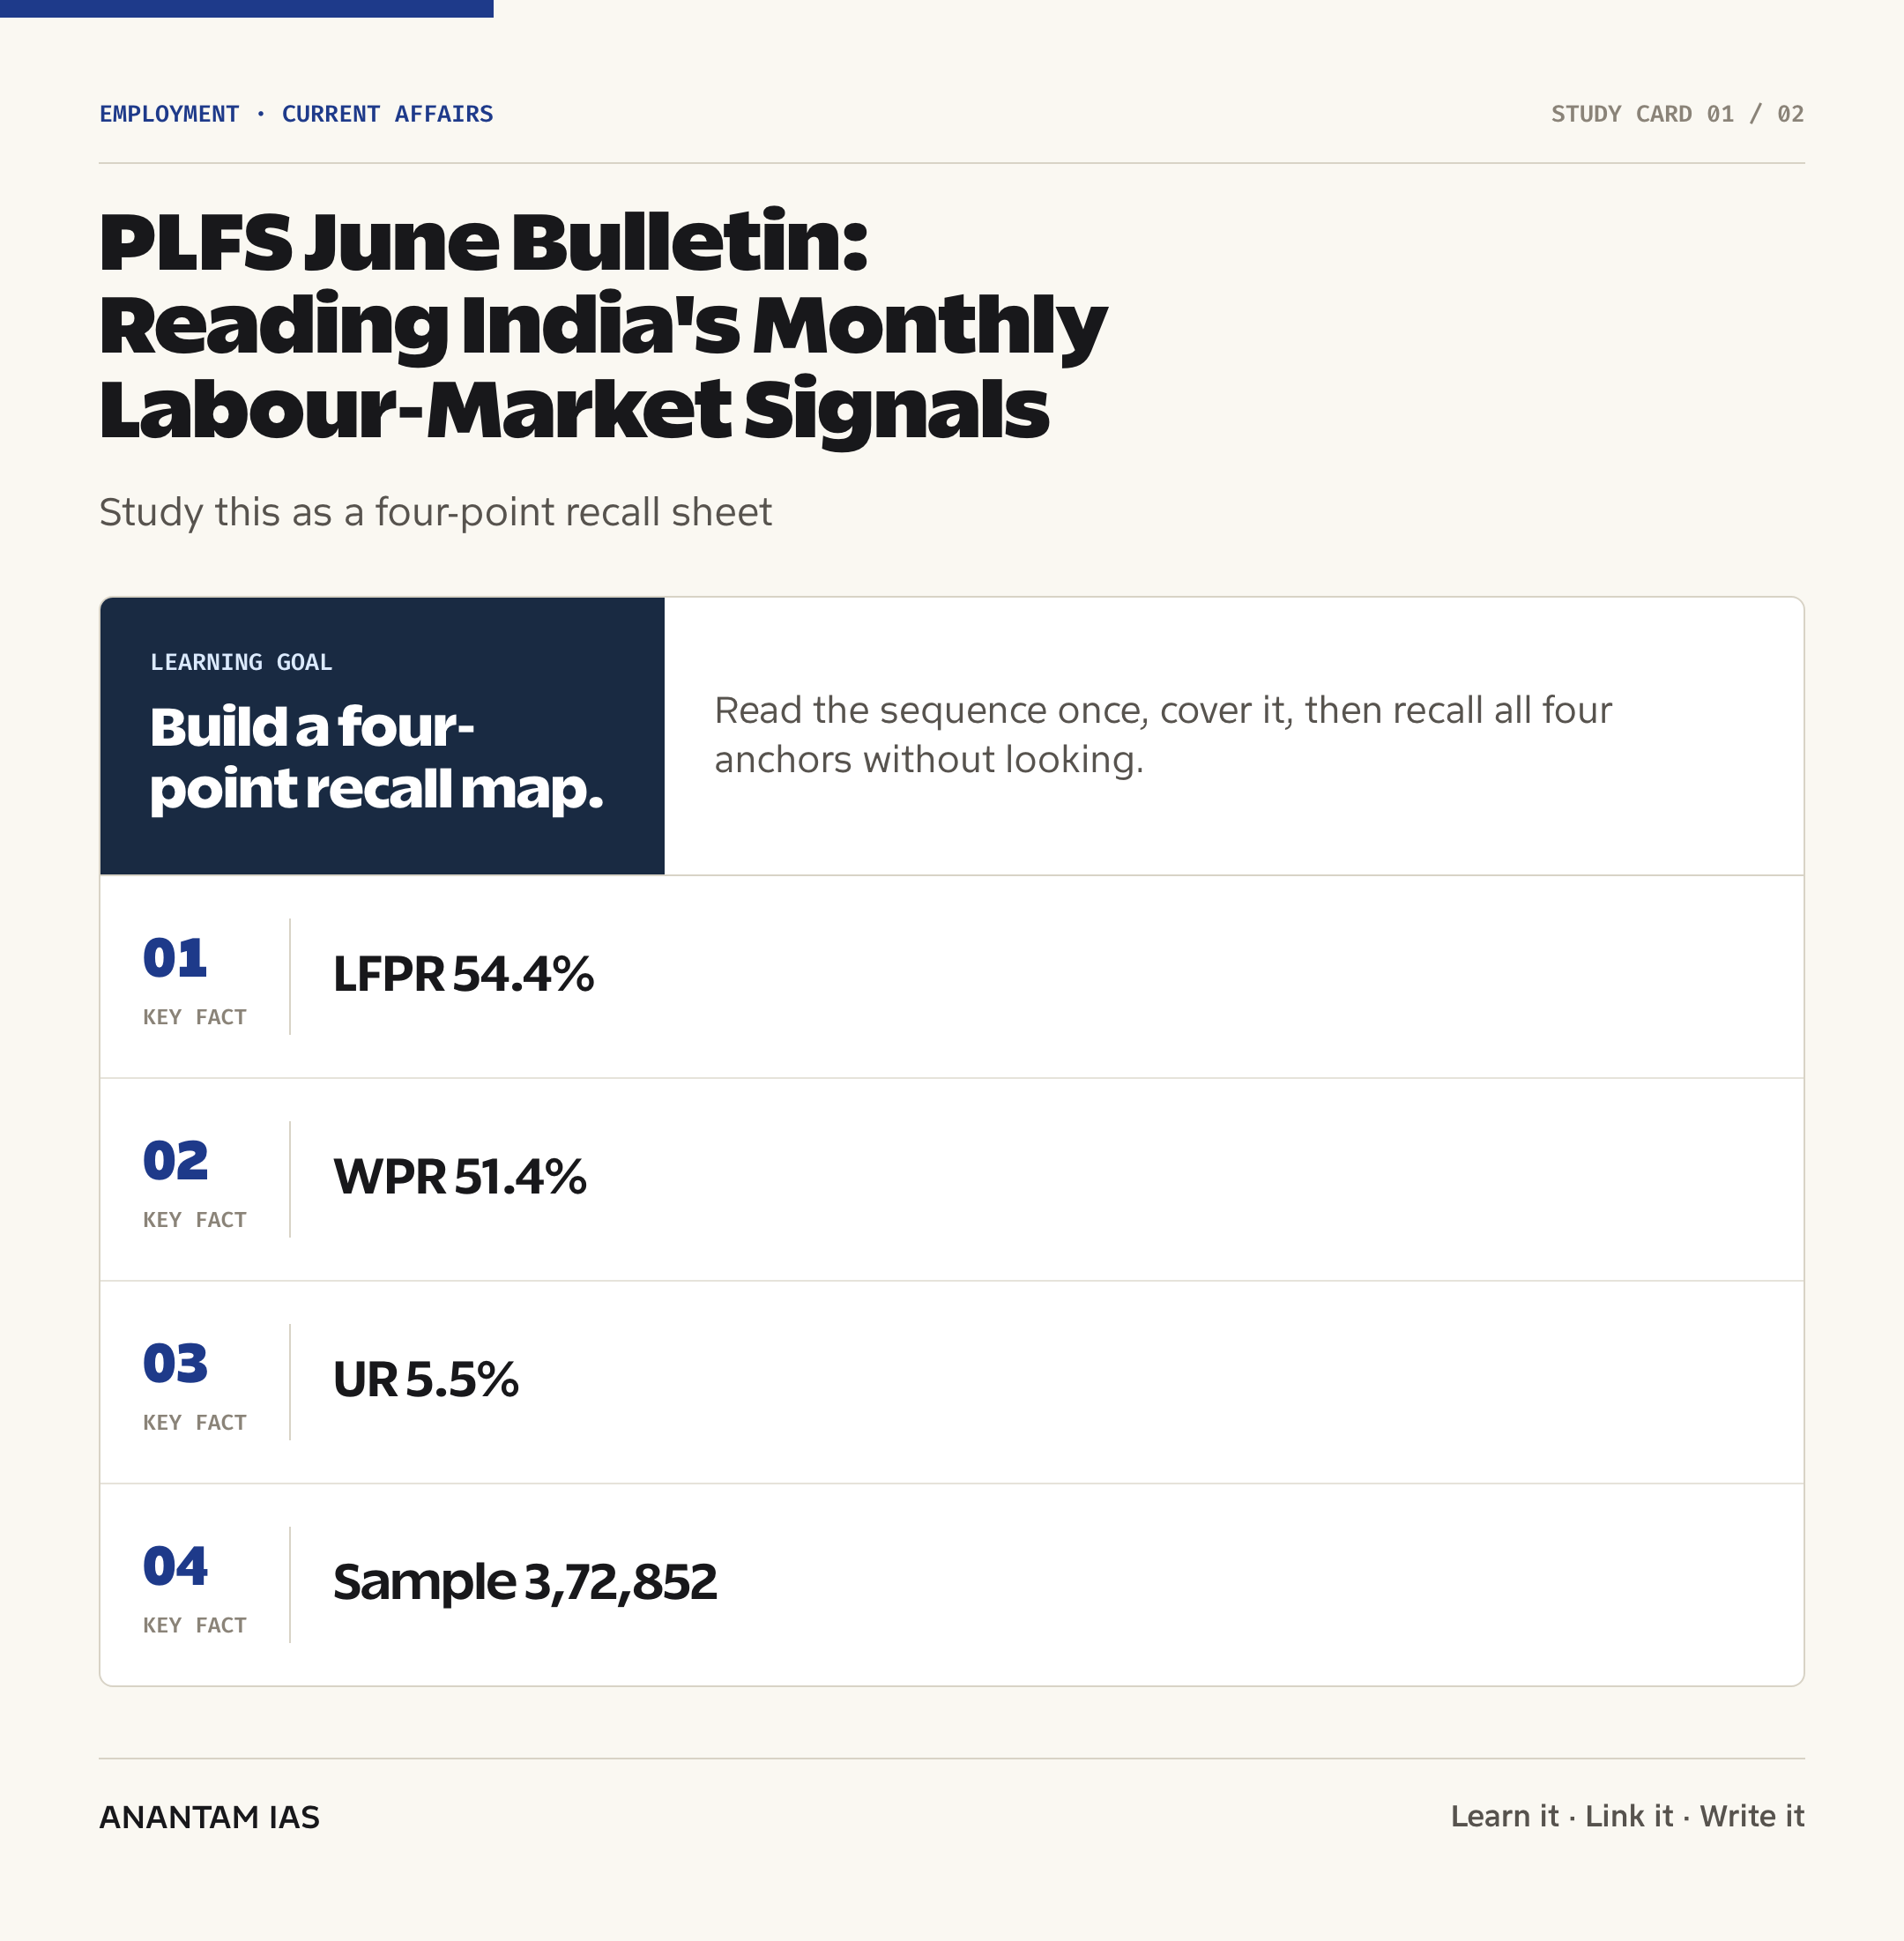
PIB and the official bulletin reported that the overall LFPR was 54.4%, the WPR was 51.4%, and the unemployment rate was 5.5%. All three headline rates were at the same level as in May 2026, while the rural and urban components moved in different directions.
- The urban LFPR rose from 49.8% in May to 50.1% in June 2026.
- The urban WPR increased from 46.6% to 46.8% over the same month-on-month comparison.
- The rural unemployment rate eased from 5.1% to 5.0%, while the urban rate moved from 6.4% to 6.6%.
- The overall female LFPR stood at 32.7%, close to 32.8% in May and above 32.0% in June 2025.
- The monthly estimates used information from 3,72,852 persons, including 2,12,390 rural and 1,60,462 urban respondents.
The development matters in the context of:
- The bulletin offers a high-frequency snapshot for policy monitoring, but a single month can’t establish a structural trend or explain causation.
- The three indicators use different denominators: LFPR and WPR relate to population, while the unemployment rate relates only to the labour force.
- The headline rates measure participation and employment status, not the full quality of work, including earnings, security, adequate hours, or social protection.
UPSC Relevance
Prelims Relevance
- The Periodic Labour Force Survey is conducted by the National Statistics Office under MoSPI.
- The labour force includes persons who are working and those who are seeking or available for work.
- LFPR is the percentage of persons in the labour force among the population.
- WPR is the percentage of employed persons among the population.
- The unemployment rate is the percentage of unemployed persons among the labour force, not among the total population.
- Current Weekly Status determines activity status with reference to the last seven days preceding the survey date.
- The June bulletin reports all-India estimates for rural areas, urban areas, and both combined for persons aged 15 years and above.
- The PLFS methodology was modified from January 2025 to support monthly and quarterly labour-market estimates for the country.
Mains Relevance
GS Paper 3
- Use LFPR, WPR, and unemployment rate together when assessing employment, inclusive growth, and the transmission of economic growth into work opportunities.
- Examine the rural-urban divergence, high-frequency data needs, labour-market resilience, and the limits of headline employment rates.
- Connect the data to policies on skills, labour-intensive growth, MSMEs, social security, and rural non-farm employment.
GS Paper 2
- Assess how women’s labour-force participation, care responsibilities, mobility, safety, and access to decent work shape substantive equality.
- Discuss the role of credible official statistics in evidence-based welfare design, federal planning, and accountable governance.
Essay
- Growth and work: an economy must be judged not only by output but also by who can enter, remain in, and benefit from productive employment.
- What gets measured shapes policy: frequent statistics improve responsiveness, while careful interpretation guards against mistaking noise for progress.
Background and Context
What PLFS Measures
The Periodic Labour Force Survey is India’s principal official household survey for measuring participation in economic activity and employment-unemployment conditions.
- The survey is conducted by the National Statistics Office, which functions under the Ministry of Statistics and Programme Implementation.
- MoSPI states that PLFS began in 2017; its design created a regular evidence base beyond the older, less frequent employment-unemployment survey rounds.
- From January 2025, the survey methodology was modified to support higher-frequency monthly and quarterly estimates with rural and urban coverage.
- The June 2026 bulletin is the fifteenth monthly bulletin, following releases from April 2025 through May 2026.
- Monthly results focus on three connected indicators: LFPR, WPR, and the unemployment rate for persons aged 15 years and above.
- The bulletin is an all-India estimate; it shouldn’t be read as a state ranking, a district labour report, or an administrative count of jobs created.
How to Read the Three Indicators
The indicators answer different questions, so reading any one of them alone can produce a misleading labour-market story.
- LFPR asks what share of the population is in the labour force, meaning employed or unemployed but seeking or available for work.
- WPR asks what share of the population is employed. Its denominator is the population, like LFPR, but its numerator includes only employed persons.
- The unemployment rate asks what share of the labour force is unemployed. People outside the labour force don’t enter this denominator.
- In rounded terms, the June rates mean that for every 100 persons aged 15 years and above, about 54 were in the labour force and about 51 were employed.
- A falling unemployment rate isn’t automatically good news if discouraged workers stop seeking work and LFPR also falls; WPR helps test whether employment actually expanded.
- A rising LFPR can temporarily accompany a higher unemployment rate when more people begin seeking work before sufficient jobs are available. The indicators must be interpreted as a joint dashboard.
June 2026 Headline Signals
The June bulletin describes broad month-on-month stability at the national level with modest changes beneath the aggregate.
- The overall LFPR remained 54.4% in May and June 2026; it was 54.2% in June 2025, a year-on-year increase of 0.2 percentage points.
- The overall WPR remained 51.4% month on month; it was 51.2% in June 2025, also a year-on-year increase of 0.2 percentage points.
- The overall unemployment rate remained 5.5% month on month and was close to the 5.6% recorded in June 2025.
- The male WPR increased from 72.5% in May to 72.9% in June 2026 and was broadly stable against 72.8% in June 2025.
- These are sample-survey estimates, not exact counts. Small decimal movements should be assessed across time and alongside the survey design before drawing strong conclusions.
- The unchanged national rates don’t mean every segment was static; changes in rural and urban components can offset one another in the combined estimate.
Rural and Urban Divergence
The sectoral split shows why the stable national average shouldn’t be treated as a uniform experience across India’s labour market.
- The rural LFPR was 56.6% in both May and June, while the urban LFPR rose from 49.8% to 50.1%.
- On a year-on-year basis, rural LFPR increased by 0.5 percentage points, while urban LFPR was 0.3 percentage points lower than in June 2025.
- The rural WPR stayed at 53.8% month on month; the urban WPR edged up from 46.6% to 46.8%.
- The rural unemployment rate eased from 5.1% to 5.0%, while the urban rate increased from 6.4% to 6.6% between May and June.
- The urban unemployment rate was still lower year on year, falling from 7.1% in June 2025 to 6.6% in June 2026.
- The bulletin also notes that rural male unemployment declined after rising continuously from February 2026, without assigning a causal explanation to that movement.
- Agricultural cycles, construction, services demand, migration, and entry into or exit from job search can influence short-run sectoral rates; the bulletin alone can’t identify the dominant cause.
Gender Lens on Participation
Female participation remained nearly stable over the month but continued to show a large rural-urban difference.
- The overall female LFPR was 32.7% in June 2026, compared with 32.8% in May and 32.0% in June 2025.
- The rural female LFPR was 36.6%, close to 36.7% in May and 1.4 percentage points above 35.2% in June 2025.
- The urban female LFPR held at 24.8% month on month but was below the 25.2% recorded in June 2025.
- The rural-urban comparison shouldn’t be converted directly into a claim about job quality; participation may include work with different levels of pay, hours, productivity, and security.
- Women’s employment outcomes are shaped by the availability of care services, safe transport, workplace conditions, skills, local job options, and social norms.
- Policy analysis should pair participation with WPR, earnings, employment status, and time-use evidence so that an increase in work is also assessed for dignity and economic agency.
Current Weekly Status and Data Limits
The Current Weekly Status approach improves sensitivity to recent labour-market conditions but requires careful interpretation.
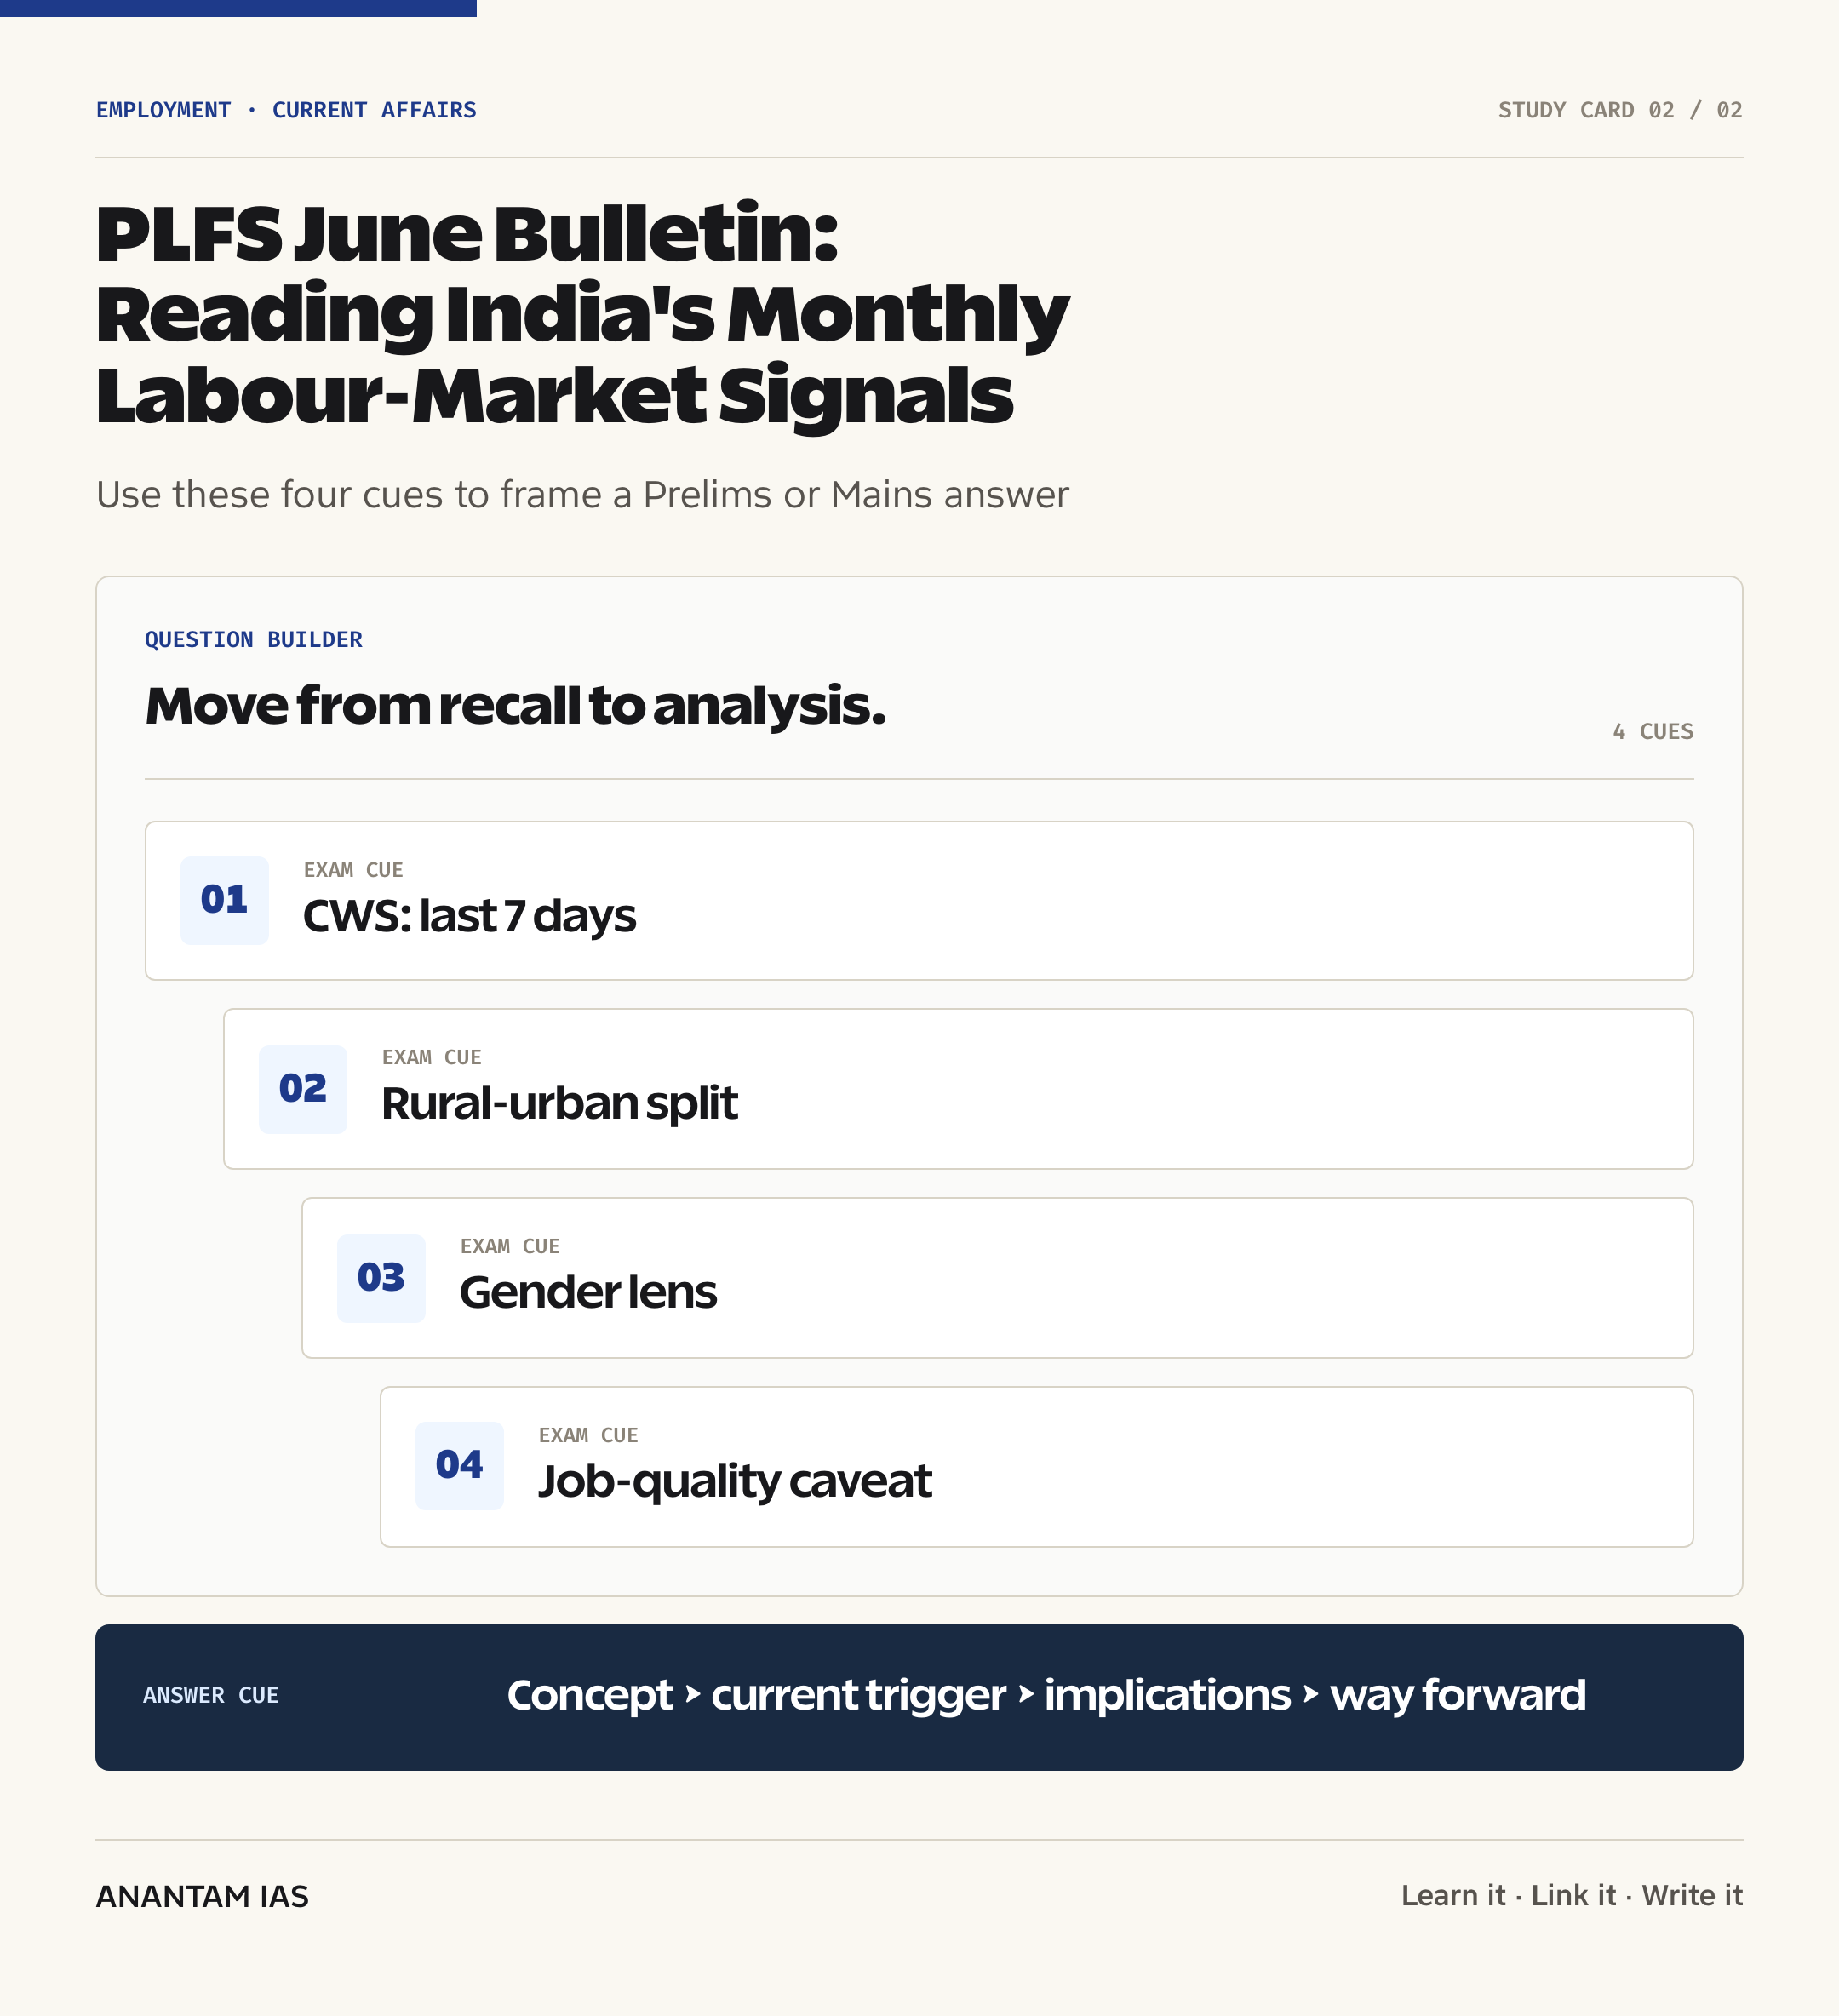
- CWS determines a person’s activity status from activities pursued during the last seven days preceding the survey date.
- A short reference period can capture recent entry into work, unemployment, or movement out of the labour force more quickly than a long usual-status reference period.
- The June monthly estimates are based on 3,72,852 surveyed persons: 2,12,390 in rural areas and 1,60,462 in urban areas.
- A survey estimate is weighted to represent the wider population; the sample size isn’t the number of workers, unemployed persons, or jobs in India.
- Month-on-month movement may contain seasonal effects and sampling variation. A sequence of observations carries more analytical weight than one isolated change.
- Headline LFPR, WPR, and unemployment rates don’t by themselves measure wages, informality, social security, productivity, multiple jobholding, or involuntary short hours.
- Administrative datasets such as payroll enrolment can complement PLFS, but they cover different populations and shouldn’t be treated as interchangeable measures of total employment.
Policy Meaning of the Monthly Dashboard
Monthly PLFS data is most useful as an early-warning dashboard that guides questions for deeper quarterly and annual analysis.
- A sustained rise in WPR alongside a stable or rising LFPR would offer stronger evidence of employment absorption than a fall in unemployment alone.
- Persistent urban unemployment can direct attention to job-rich manufacturing, construction, services, apprenticeship pathways, and the school-to-work transition.
- Rural policy should look beyond short-run absorption toward productive non-farm employment, agro-processing, rural enterprises, and more reliable earnings across seasons.
- The female participation gap calls for coordinated action on childcare, mobility, safety, flexible work with protections, anti-discrimination, and access to market-relevant skills.
- Employment policy needs both demand and supply measures: enterprise growth and public investment must create work, while skills and placement systems must connect people to that demand.
- Good statistical communication should distinguish month-on-month movement, year-on-year movement, and structural change, and should state the relevant denominator every time.
Way Forward
Build a fuller labour-market dashboard
- Read monthly PLFS with quarterly and annual estimates, sectoral output, enterprise surveys, wages, and carefully defined payroll indicators.
- Present participation, employment, unemployment, earnings, hours, and employment status together so that job quantity isn’t mistaken for job quality.
- Communicate sampling uncertainty and seasonal context clearly, especially when policy debate turns on changes of only a few tenths of a percentage point.
Expand productive and inclusive work
- Prioritise labour-intensive sectors, MSME productivity, construction, tourism, logistics, care services, and green jobs where India can create employment at scale.
- Strengthen rural value chains, agro-processing, digital market access, and local enterprises to expand non-farm employment and reduce distress-driven work transitions.
- Link skilling and apprenticeships to verified local demand, employer participation, placement tracking, and portable credentials rather than measuring only training enrolment.
Remove barriers to women's employment
- Expand affordable childcare and eldercare, safe public transport, workplace facilities, and enforcement of equal-opportunity and safety norms.
- Track women’s retention, earnings, hours, occupation, and access to social security, not only their entry into the labour force.
- Design city and district employment strategies around local care burdens, commuting time, skill profiles, and employer demand while keeping decent work central.
Conclusion
The June 2026 PLFS presents a stable national headline: LFPR, WPR, and unemployment were unchanged from May. But the rural-urban split adds the real analytical value, with marginal urban participation and employment gains, a slight easing of rural unemployment, and a small rise in urban unemployment.
For policy, the right lesson is disciplined interpretation. LFPR, WPR, and unemployment must be read together, across several months, and alongside evidence on earnings, hours, informality, and social protection. High-frequency data should sharpen diagnosis and response without turning decimal movement into unsupported claims about the whole economy.
UPSC Practice Questions
Prelims MCQ 1
With reference to PLFS labour-market indicators, consider the following statements:
- Labour Force Participation Rate is the share of persons in the labour force in the population.
- Worker Population Ratio is the share of employed persons in the population.
- Unemployment Rate is the share of unemployed persons in the labour force.
How many of the above statements are correct?
(a) Only one (b) Only two (c) All three (d) None
Answer: (c) All three
Explanation:
All three statements use the official definitions. The key distinction is the denominator: LFPR and WPR use population, while the unemployment rate uses the labour force.
Prelims MCQ 2
Which one of the following best describes the June 2026 PLFS movement compared with May 2026?
(a) Overall LFPR fell while overall WPR increased (b) Overall LFPR, WPR and UR were unchanged; urban LFPR and WPR rose marginally, while rural UR eased (c) Rural UR rose while urban UR fell (d) Female LFPR increased sharply in both rural and urban areas
Answer: (b) Overall LFPR, WPR and UR were unchanged; urban LFPR and WPR rose marginally, while rural UR eased
Explanation:
The official bulletin reported 54.4% LFPR, 51.4% WPR, and 5.5% UR at the same month-on-month levels. Urban LFPR and WPR edged up, while rural UR moved from 5.1% to 5.0%.
UPSC Mains Questions
- Explain how LFPR, WPR, and unemployment rate differ in concept and denominator. Using the June 2026 PLFS signals, show why these indicators must be read together rather than used separately to judge India’s employment situation. (15 marks, 250 words)
- The June 2026 PLFS shows stable national aggregates but divergent rural, urban, and female participation signals. Discuss what this reveals about the limits of headline labour statistics and suggest a policy framework for productive, inclusive, and decent employment. (15 marks, 250 words)
Sources: PIB, Ministry of Statistics and Programme Implementation and MoSPI, PLFS Monthly Bulletin for June 2026.
Frequently Asked Questions
What did the June 2026 PLFS show?
The overall LFPR was 54.4%, the WPR was 51.4%, and the unemployment rate was 5.5% for persons aged 15 years and above. Each matched its May 2026 level. Beneath that stability, urban LFPR and WPR rose slightly, rural unemployment eased, and urban unemployment increased from 6.4% to 6.6%.
Who releases the PLFS bulletin?
The National Statistics Office, which is part of the Ministry of Statistics and Programme Implementation, conducts PLFS and releases its findings. PIB disseminated the June 2026 press release, while the official MoSPI bulletin provides the definitions, headline estimates, comparison charts, and survey coverage used in these notes.
What does Current Weekly Status mean?
Current Weekly Status determines a person’s activity status using the activities pursued during the last seven days preceding the survey date. This short reference period makes the measure responsive to recent labour-market changes, but one monthly observation may also reflect seasonality and sampling variation, so a longer run of data is more informative.
How are LFPR and WPR different?
LFPR is the share of the population that is employed or unemployed but seeking or available for work. WPR counts only employed persons as a share of the population. Comparing them helps show whether higher participation is being absorbed into employment or is appearing as additional unemployment.
Can stable unemployment hide labour-market change?
Yes. The unemployment rate uses the labour force as its denominator, which can change when people enter or leave job search. A stable rate can coexist with changing participation or employment. Analysts should check LFPR and WPR, rural-urban and gender splits, and several months of data before describing the labour market as unchanged.
Does monthly PLFS measure job quality fully?
No. The headline monthly rates describe participation, employment, and unemployment, but they don’t by themselves establish adequate earnings, secure contracts, social protection, productivity, or sufficient hours. A credible assessment of decent work needs the richer PLFS tables and complementary evidence on wages, employment status, enterprises, and payroll coverage.
Tell Google you want more of this.
Add Anantam IAS as a preferred sourceOne tap, and this site shows up more often in your own Top Stories, AI Overviews and AI Mode. Remove it any time.