
Why in News?
Recent policy changes, including the implementation of the Labour Codes and the replacement of Mahatma Gandhi National Rural Employment Guarantee Act (MGNREGA) with the Viksit Bharat-Guarantee for Rozgar and Ajeevika Mission (Gramin) Bill, 2025, have revived debate on inequality, informal labour distress, and rural welfare in India. Simultaneously, new findings from the Household Consumer Expenditure Survey (HCES) 2023-24 have triggered discussion on whether inequality in India is actually declining or merely being underestimated.
UPSC Relevance:
GS II : Welfare schemes, vulnerable sections, labour reforms, social justice.
GS III : Inclusive growth, employment, informal sector, poverty, regional imbalance, human development, economic reforms and inequality.
Understanding Inequality
Inequality refers to the unequal distribution of income, wealth, consumption, opportunities, and social advantages among individuals or groups in society.
It can be measured through:
- Income inequality
- Wealth inequality
- Consumption expenditure inequality
- Regional inequality
- Social inequality based on caste, class, gender, religion, and occupation
The article primarily examines consumption expenditure inequality using HCES 2023-24 data.
Measuring Inequality
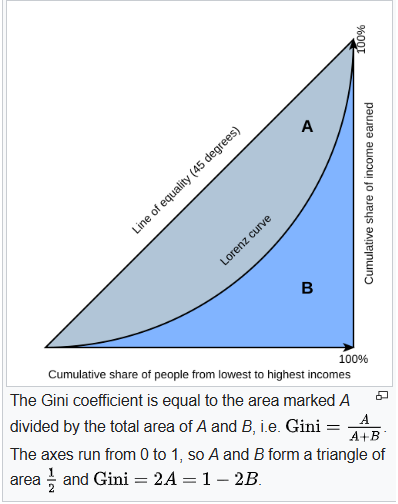
Gini Coefficient
The most widely used measure of inequality is the Gini Index or Gini Coefficient.
0≤G≤1
- A value closer to 0 indicates perfect equality.
- A value closer to 1 indicates extreme inequality.
The study estimates India’s consumption inequality at:
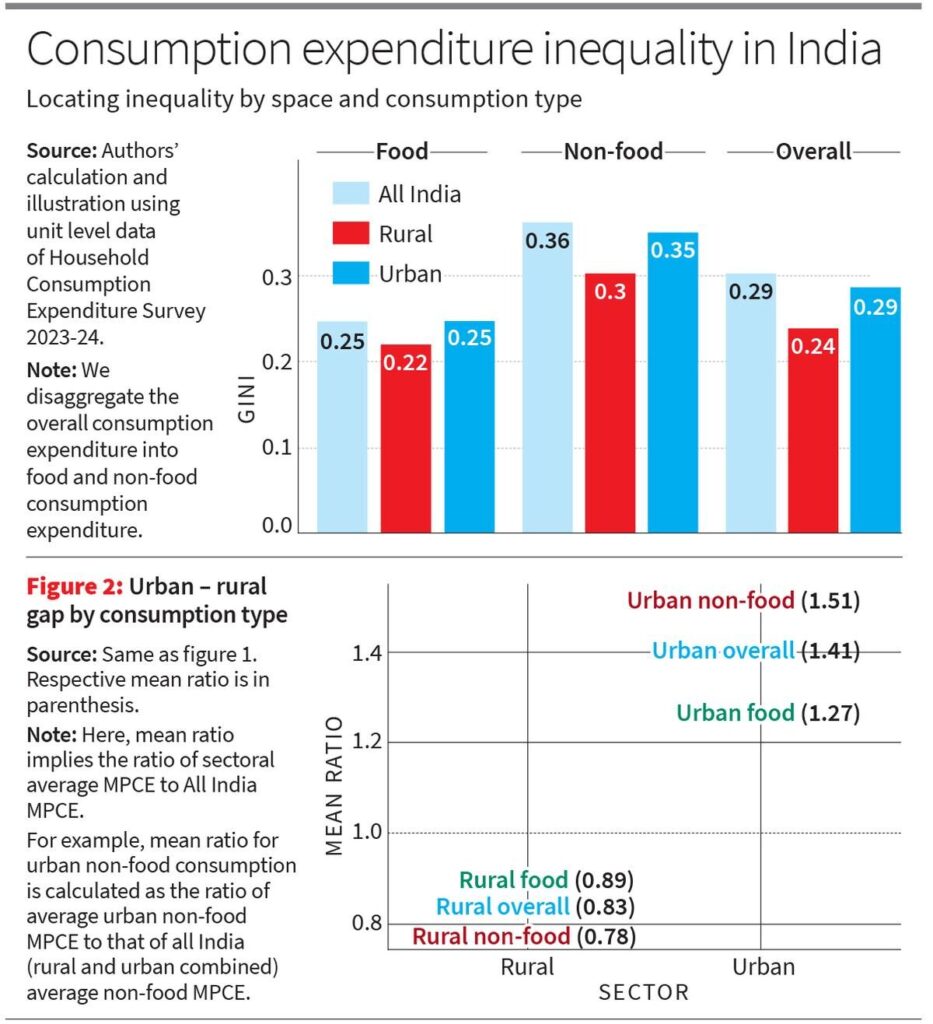
- 0.29 based on HCES 2023-24
- Compared to the World Bank estimate of 0.25
This suggests inequality may be higher than officially projected.
Major Findings from HCES 2023-24
Urban India is More Unequal than Rural India
The data shows that urban consumption inequality is significantly higher than rural inequality.
Urban growth has disproportionately benefited:
- Owners of capital
- Professionals
- High-skilled service workers
- Urban elites
Meanwhile:
- Informal workers
- Agricultural labourers
- Small farmers
continue to lag behind.
Non-Food Expenditure Drives Inequality
India’s consumption boom is largely driven by non-food expenditure such as:
- Education
- Healthcare
- Housing
- Transport
- Consumer durables
- Leisure
Inequality in non-food expenditure is much higher than food expenditure.
This indicates widening disparities in:
- Quality of life
- Access to services
- Human capital formation
Urban-Rural Divide
The average urban non-food Monthly Per Capita Expenditure (MPCE) is approximately 1.5 times the all-India average, while rural expenditure remains far below the national benchmark.
The disparity highlights:
- Uneven economic growth
- Persistent agricultural distress
- Urban-centric development policies
Decile-Based Inequality
Concentration of Consumption
In urban India:
- The top 10% accounts for 27% of total non-food expenditure.
The mean MPCE:
- Of the richest urban decile is six times that of the poorest urban decile.
- Of the richest urban decile is nine times that of the poorest rural decile.
This demonstrates sharp consumption concentration among upper-income groups.
Between-Group vs Within-Group Inequality
The study decomposes inequality into:
- Within-group inequality
- Between-group inequality
The findings show that:
- Between-group inequality contributes nearly 90% of non-food expenditure inequality.
This indicates structural disparities between social and economic groups rather than merely individual differences.
Inequality Along Social Axes
Class Inequality
Research by Vamsi Vakulabharanam shows that since the 1980s:
- Urban owners, managers, and professionals have gained disproportionately.
- Informal workers and agricultural labourers have experienced stagnation.
This reflects:
- Rising class inequality
- Unequal gains from liberalisation and economic growth
Caste and Rural Distress
Inequality in India also overlaps with:
- Caste hierarchy
- Land ownership patterns
- Occupational segmentation
Marginalised caste groups remain overrepresented in:
- Informal labour
- Agricultural distress
- Low-income occupations
What are the Problems in Measuring Inequality in India?
Underestimation of the Super-Rich
National Sample Surveys often fail to adequately capture:
- Billionaires
- High-net-worth individuals
- Corporate wealth concentration
Thus, actual inequality may be significantly higher.
Data Comparability Issues
Methodological differences across surveys create challenges in:
- Comparing inequality over time
- Estimating long-term trends accurately
Debt-Led Consumption
A large section of the population sustains consumption through:
- Loans
- Informal credit
- Household indebtedness
This can mask underlying economic distress.
Structural Causes of Rising Inequality
Jobless Growth
Economic growth has not generated adequate:
- Formal employment
- Manufacturing jobs
- Secure livelihoods
This has increased precarity in the labour market.
Informalisation of Labour
Over 90% of India’s workforce remains informal with:
- Low wages
- Lack of social security
- Weak bargaining power
Agrarian Distress
Persistent rural challenges include:
- Small landholdings
- Rising input costs
- Climate vulnerability
- Low farm incomes
Unequal Access to Education and Healthcare
Human development opportunities remain highly unequal across:
- Regions
- Social groups
- Income categories
What are the Implications of High Inequality?
Economic Consequences
High inequality can:
- Reduce aggregate demand
- Increase dependence on debt-led consumption
- Slow sustainable growth
Social Consequences
It can lead to:
- Social alienation
- Reduced social mobility
- Increased crime and unrest
Democratic Concerns
Extreme concentration of wealth may:
- Distort political influence
- Increase corporate capture
- Deepen exclusion in policymaking
Government Initiatives
Major welfare initiatives include:
- Pradhan Mantri Garib Kalyan Yojana
- PM-KISAN
- Ayushman Bharat
- National Food Security Act
- Skill India Mission
- Direct Benefit Transfer (DBT)
However, welfare support alone has not reversed structural inequality.
Way Forward
Employment-Centric Growth
India needs:
- Labour-intensive manufacturing
- MSME expansion
- Rural industrialisation
Strengthening Social Security
Universal and portable social protection is needed for:
- Informal workers
- Gig workers
- Migrant labourers
Revitalising Rural Economy
Focus areas include:
- Agricultural diversification
- Rural infrastructure
- Irrigation
- Farmer producer organisations
Progressive Taxation
A more progressive fiscal framework can improve redistribution through:
- Better wealth taxation
- Rationalised subsidies
- Increased public investment
Investment in Human Capital
Improved public spending on:
- Education
- Healthcare
- Nutrition
- Skill development
is essential to reduce long-term inequality.
Conclusion
India’s growth story has produced significant economic expansion, but its benefits remain unevenly distributed. Rising urban prosperity, expanding non-food consumption, and the concentration of economic gains among elite groups reveal deep structural inequalities. Consumption-based estimates alone may understate the true scale of disparity. Sustainable and inclusive development requires not only growth, but equitable access to opportunities, livelihoods, and social mobility.
Practice Questions
1. With reference to the Gini Coefficient, consider the following statements:
- It is used to measure inequality in income or consumption distribution.
- A Gini value of 1 indicates perfect equality.
- The closer the Gini value is to zero, the lower the inequality.
Which of the statements given above are correct?
(a) 1 and 2 only
(b) 1 and 3 only
(c) 2 and 3 only
(d) 1, 2 and 3
Answer: (b)
2. Which of the following factors are commonly associated with rising economic inequality in India?
- Informalisation of labour
- Urban-centric growth
- Agrarian distress
- Universal access to quality healthcare
Select the correct answer using the code below:
(a) 1, 2 and 3 only
(b) 2 and 4 only
(c) 1 and 4 only
(d) 1, 2, 3 and 4
Answer: (a)
Mains Practice Questions
- Critically analyse the limitations of consumption expenditure surveys in capturing inequality in India.
- “Economic growth without equitable distribution can deepen structural inequalities.” Discuss in the context of India’s recent growth trajectory.
- Examine the relationship between urbanisation, labour informalisation, and rising inequality in India.
Tell Google you want more of this.
Add Anantam IAS as a preferred sourceOne tap, and this site shows up more often in your own Top Stories, AI Overviews and AI Mode. Remove it any time.