Why in News?
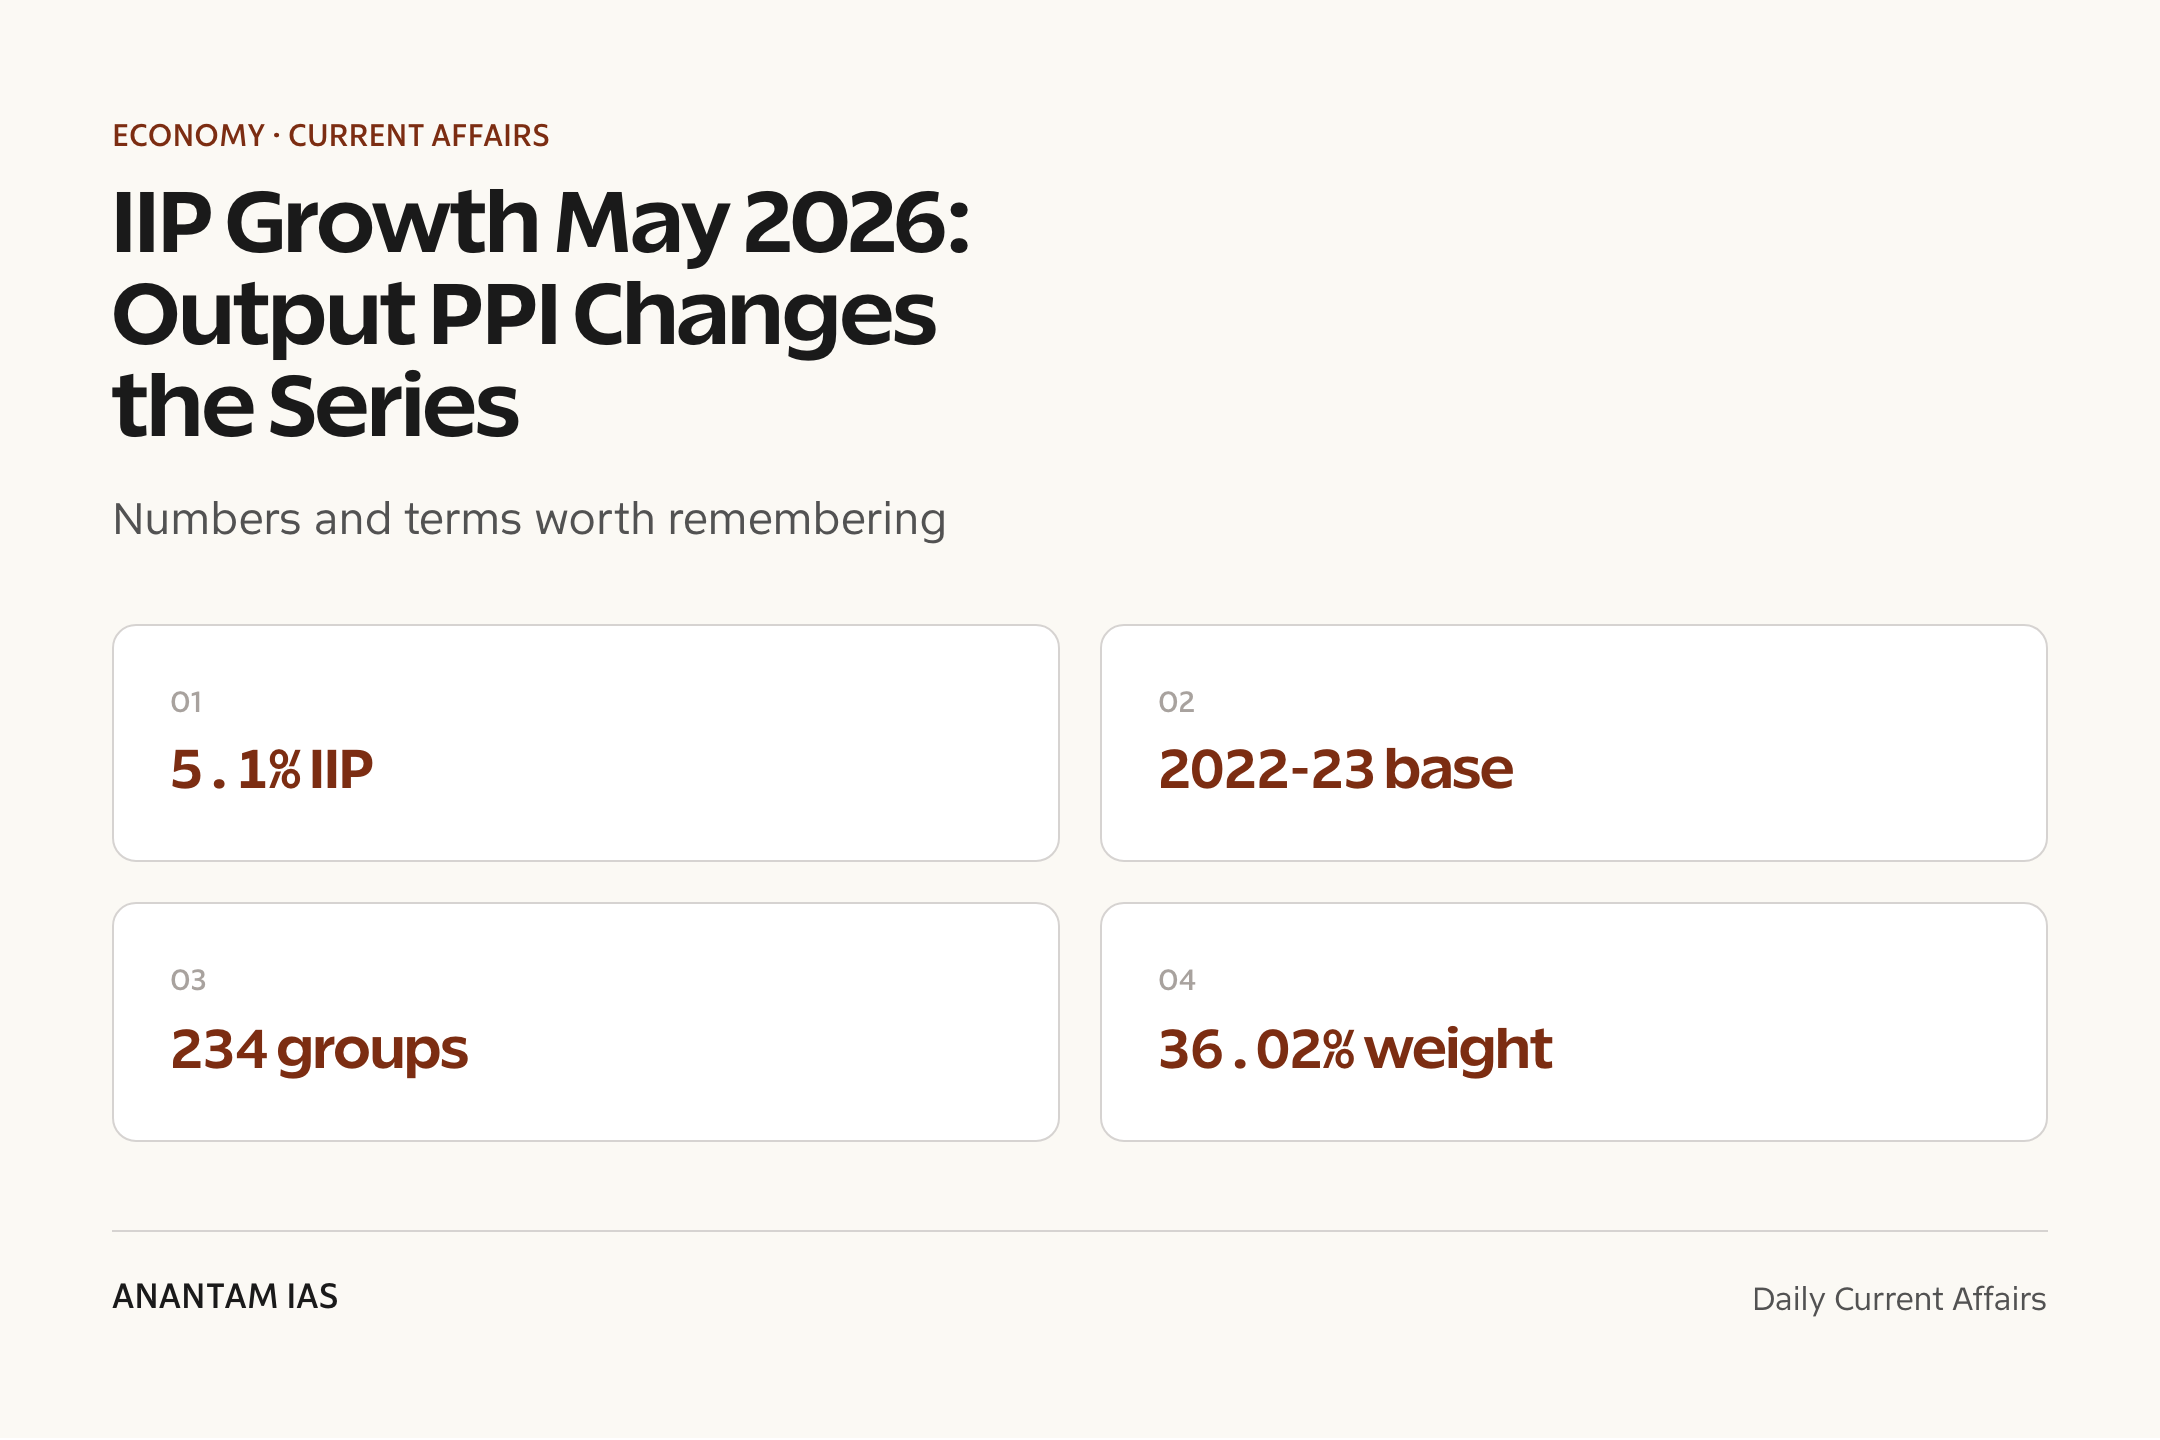
PIB confirmed that India’s Index of Industrial Production recorded 5.1% year-on-year growth in May 2026, with the Quick Estimate rising to 122.7 from 116.7 in May 2025.
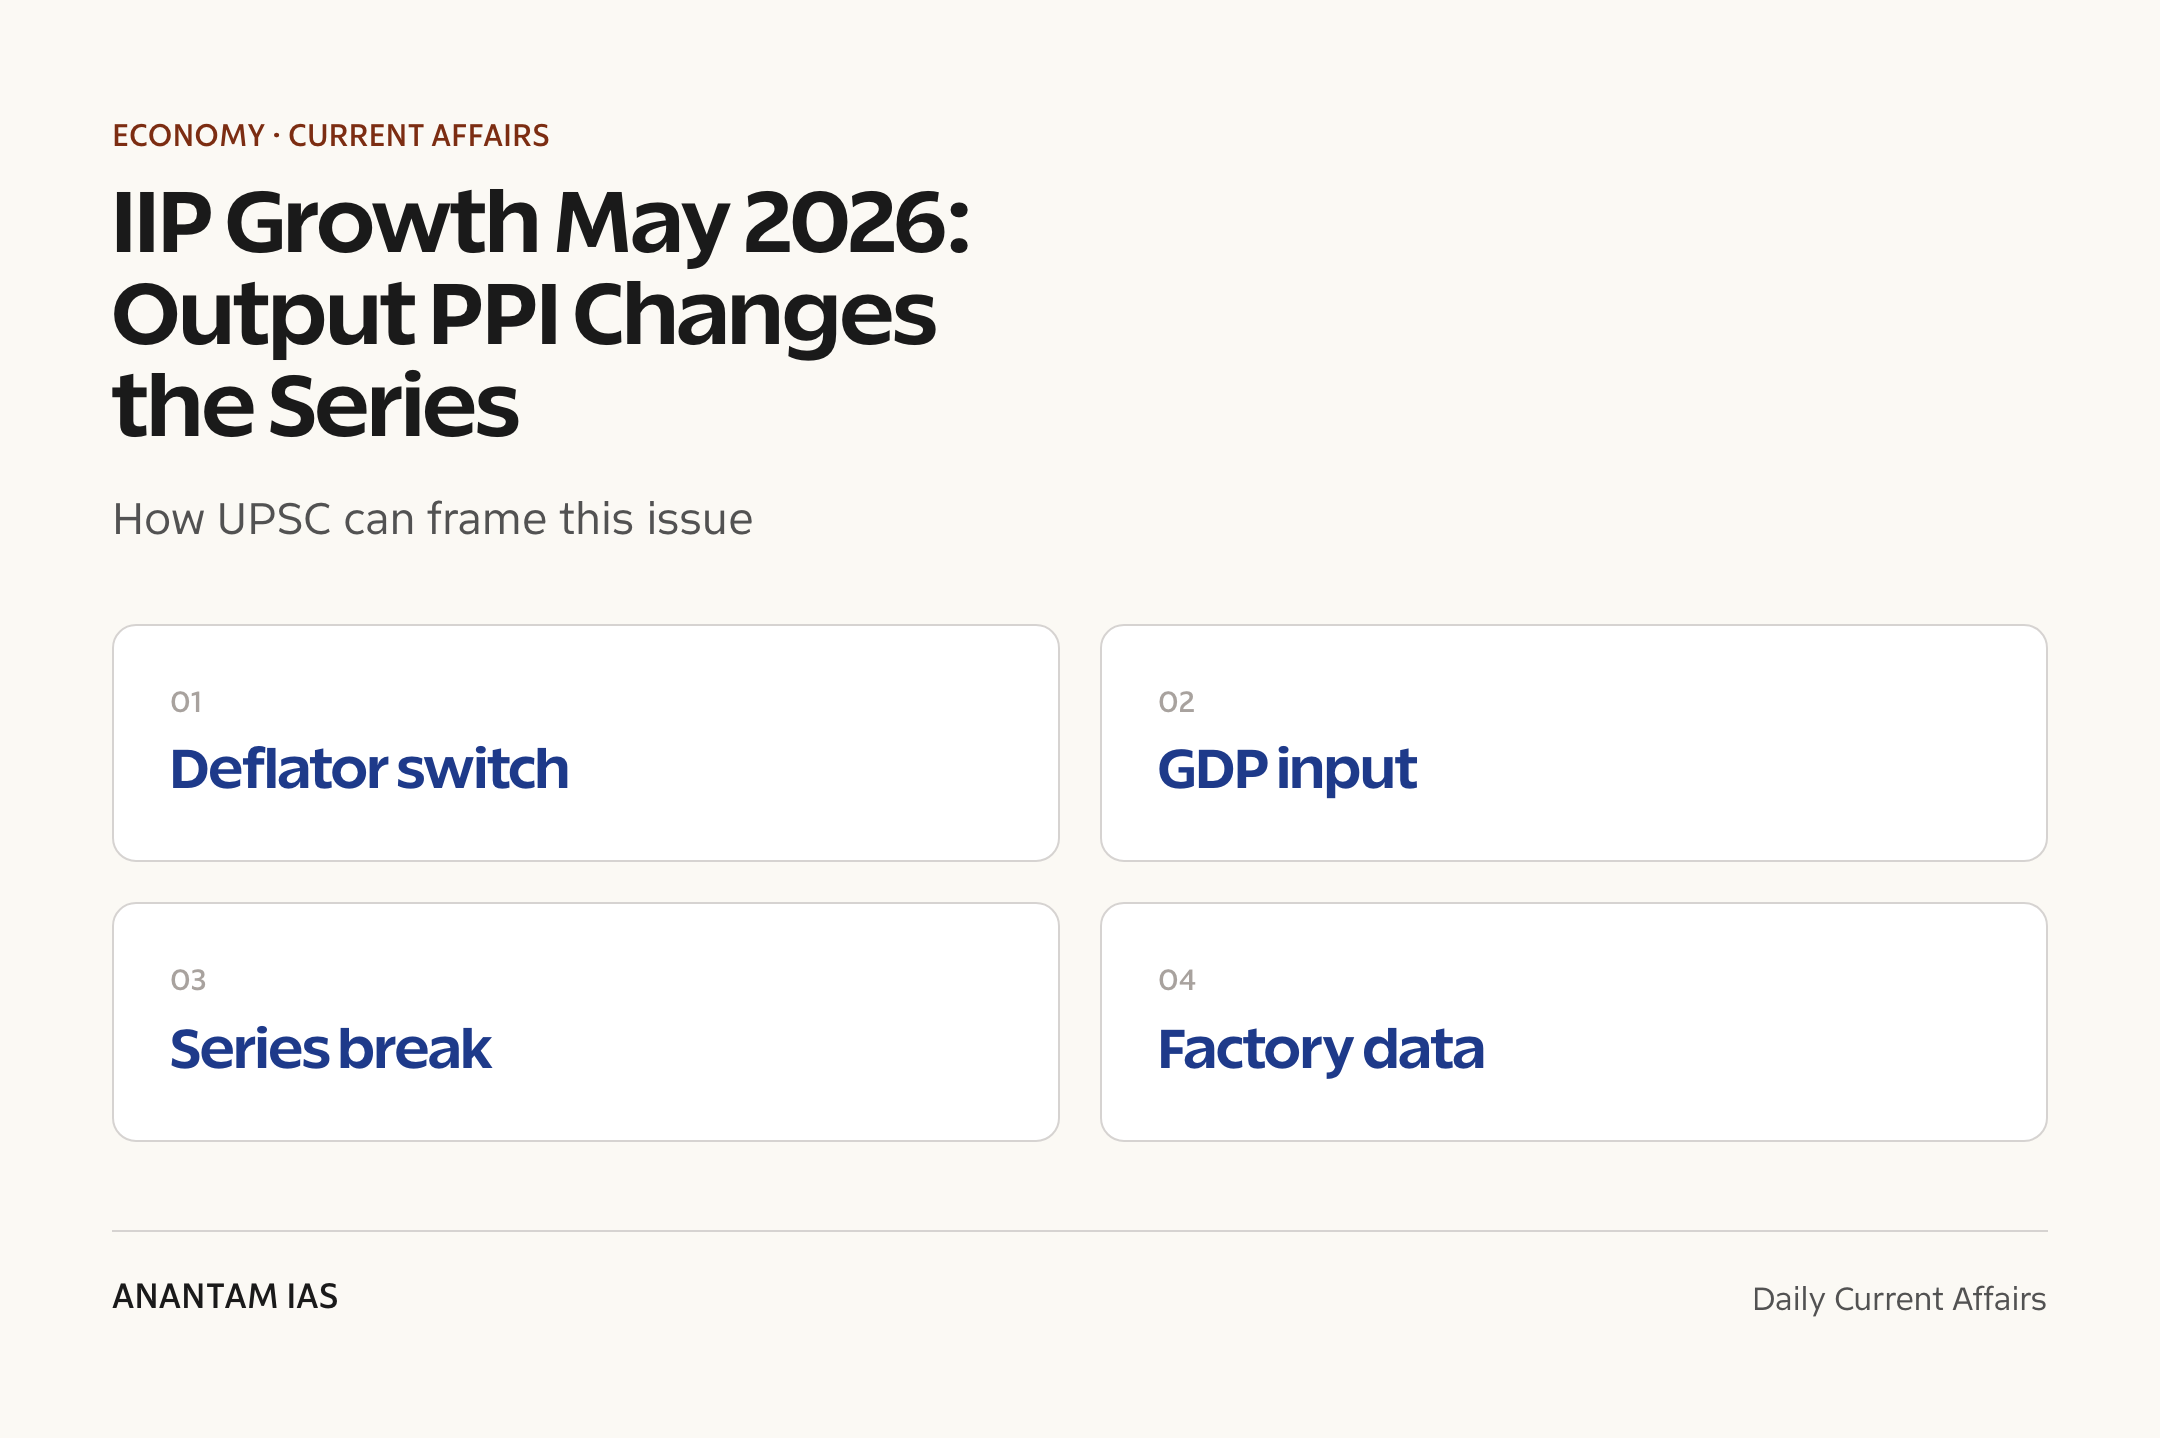
The bigger policy-relevant update is the methodology shift: MoSPI revised the 2022-23 IIP series by adopting Output PPI as the deflator for item groups where output is collected in value terms.
- MoSPI said the revised Output PPI-based IIP supersedes the earlier WPI-based 2022-23 series released on 1 June 2026.
- Output Producer Price Index was released by DPIIT with base year 2022-23 on 15 June 2026.
- The deflator switch affects 234 of 463 IIP item groups, equal to 36.02% of the total IIP weight.
- Sector-wise May growth was -1.6% in Mining and Quarrying, 5.5% in Manufacturing, 9.9% in Electricity and Gas Supply, and 5.5% in Water Supply, Sewerage and Waste Management.
- The Hindu reported the May print as a five-month high, while PIB remains the primary source for the final numbers and methodology note.
The development matters in the context of:
- IIP is a high-frequency indicator of industrial output and feeds into near-term readings of the production cycle.
- Deflator choice matters because value-based production data must be converted into real output after removing price effects.
- Output PPI can align industrial volume estimation more closely with producer-level prices than WPI for relevant item groups.
- This change links monthly factory data with larger debates on national income accounting, GDP deflator, and the measurement of real growth.
UPSC Relevance
Prelims Relevance
- IIP stands for Index of Industrial Production and tracks changes in industrial output over time.
- MoSPI releases the All India IIP and the May 2026 Quick Estimate.
- Base year 2022-23 is the base for the new IIP series cited in the PIB release.
- Output PPI replaced WPI as deflator for value-based item groups in the revised 2022-23 series.
- 234 of 463 item groups are value-based item groups affected by the deflator change.
- Manufacturing carries the largest sectoral weight in the IIP basket and grew 5.5% in May 2026.
- Capital Goods grew 12.9% under use-based classification in May 2026.
- June 2026 IIP is scheduled for release on 28 July 2026.
Mains Relevance
GS Paper 3
- Industrial growth indicators, manufacturing performance, and data quality in macroeconomic policy.
- Role of IIP, PPI, WPI, and deflators in measuring real output.
GS Paper 2
- Institutional coordination between MoSPI, DPIIT, source agencies, and technical advisory processes.
- Governance of official statistics and public trust in revised data series.
Essay
- What gets measured well gets governed better.
- Data reforms and the credibility of economic policymaking.
- Industrial transformation in a changing price environment.
Background and Context
What IIP Measures
The Index of Industrial Production is a short-term volume indicator for the industrial sector.
- IIP measures the change in industrial output relative to a base year, so it captures physical or real production rather than nominal sales value.
- The May 2026 release uses 2022-23=100 as the base, making 122.7 the Quick Estimate for the General Index.
- It covers Mining and Quarrying, Manufacturing, Electricity and Gas Supply, and Water Supply, Sewerage and Waste Management.
- For students, link IIP with sectors of the economy: it is mainly about the industrial or secondary-sector production cycle.
- A rising IIP may indicate stronger industrial activity, but it must be read with inflation, employment, capacity use, trade data, and sector-specific shocks.
Why Output PPI Matters
The Output PPI shift is important because many IIP items are reported in value terms, not direct physical quantities.
- Value-based production data mixes price change and real quantity change, so statisticians need a deflator to estimate real output.
- WPI captures wholesale price movements, while Output PPI is designed to capture prices received by producers for their output.
- PIB stated that Output PPI gives a more granular price structure and improves estimation of real output for value-based items.
- The switch applies to 234 item groups, representing 36.02% of the total index weight, so it is not a cosmetic change.
- The concept is close to the logic of a deflator: remove price effects before judging real production growth.
- For exam answers, the key distinction is simple: nominal value can rise because prices rise, while real output should rise only when production volume rises.
May 2026 Sector Signals
The May print shows broad support from manufacturing and power, while mining was weak.
- General IIP grew 5.1% year-on-year in May 2026, with the index at 122.7 against 116.7 in May 2025.
- Manufacturing grew 5.5%, and 16 of 23 manufacturing industry groups recorded positive growth.
- Electricity and Gas Supply grew 9.9%, giving the headline number an important infrastructure and power-cycle support.
- Mining and Quarrying contracted 1.6%, reminding us that a single headline index may hide opposite sectoral movements.
- Water Supply, Sewerage and Waste Management grew 5.5%, a smaller but syllabus-relevant part of the revised basket.
Manufacturing Contributors
PIB identified three manufacturing groups as the top positive contributors in May 2026.
- Motor vehicles, trailers and semi-trailers grew 14.5%, with passenger cars, auto components, and commercial vehicles contributing significantly.
- Electrical equipment grew 20.8%, supported by items such as switching apparatus, small transformers, UPS, and solid-state drives.
- Basic metals grew 4.6%, with HR coils, HR plates, and bars and rods contributing to output growth.
- These groups matter for investment demand, construction, supply chains, and the broader manufacturing recovery debate.
- For Mains answers, avoid treating manufacturing as one block; split it into autos, electrical equipment, basic metals, and sectoral bottlenecks.
Use-Based Classification
Use-based IIP shows whether growth is coming from inputs, investment goods, construction, or consumption.
- Primary Goods grew 2.6%, pointing to moderate growth in basic input categories.
- Capital Goods grew 12.9%, the strongest use-based growth rate in the PIB highlights for May 2026.
- Intermediate Goods grew 5.8%, while Infrastructure and Construction Goods grew 5.9%.
- Consumer Durables grew 7.2%, while Consumer Non-durables grew 3.6%.
- PIB said the top three positive contributors by use-based classification were Intermediate Goods, Capital Goods, and Primary Goods.
Governance of Statistical Revisions
The deflator change is also a governance issue because official statistics shape policy, markets, and academic analysis.
- MoSPI said the revised release supersedes the earlier WPI-based 2022-23 IIP series, so users should use the PPI-based series for analysis and policy work.
- DPIIT released the Output PPI series on 15 June 2026, after which MoSPI examined its implications for IIP compilation.
- PIB noted the change is aligned with international best practices and the Technical Advisory Committee recommendation for base revision.
- Major changes in an index series are easier to accommodate during base-year revision, because weights, products, classifications, and methods are being updated together.
- The release also notes updated source-agency data since April 2022 and a revision in the electricity index to address a sub-sectoral weight issue.
- This makes the release a useful case study in statistical governance: revision is acceptable when the method, reason, and replacement series are publicly explained.
Way Forward
Improve Data Transparency
- MoSPI should keep public metadata clear on which item groups use physical quantity data and which use value-based data.
- Revision notes should explain deflator changes, source-agency updates, and sectoral weight fixes in simple tables for users.
Strengthen PPI Ecosystem
- Output PPI needs timely, granular, and stable price collection so that the revised IIP series remains credible.
- Coordination between MoSPI, DPIIT, and source agencies should be institutionalized through routine quality checks.
Read IIP With Other Indicators
- Policy analysis should read IIP with GDP, PMI, GST collections, capacity use, exports, and credit data.
- Students should avoid one-number answers: sectoral and use-based splits usually carry the real analytical insight.
Conclusion
The May 2026 IIP release is not only about 5.1% industrial growth. Its durable exam value lies in the switch from WPI to Output PPI for value-based item groups in the 2022-23 series.
For Prelims, remember the institutions, dates, base year, affected item groups, and sectoral growth rates. For Mains, use this case to discuss data credibility, real output measurement, and the role of statistical reforms in economic policymaking.
UPSC Practice Questions
Prelims MCQ 1
With reference to the May 2026 IIP release, consider the following statements:
- The IIP Quick Estimate for May 2026 stood at 122.7 against 116.7 in May 2025.
- MoSPI adopted Output PPI as deflator for value-based item groups in the revised 2022-23 IIP series.
- The deflator switch affects 234 of the 463 item groups in the IIP basket.
How many of the above statements are correct?
(a) Only one (b) Only two (c) All three (d) None
Answer: (c) All three
Explanation:
All three statements match the PIB release. The General Index rose to 122.7, Output PPI replaced WPI for value-based item groups, and 234 of 463 item groups are affected.
Prelims MCQ 2
Which use-based category recorded the highest year-on-year growth in the May 2026 IIP highlights cited by PIB?
(a) Primary Goods (b) Capital Goods (c) Consumer Durables (d) Infrastructure and Construction Goods
Answer: (b) Capital Goods
Explanation:
Capital Goods grew 12.9% in May 2026, higher than Primary Goods at 2.6%, Consumer Durables at 7.2%, and Infrastructure and Construction Goods at 5.9%.
UPSC Mains Questions
- The revision of IIP with Output PPI as deflator shows that growth measurement is as important as growth itself. Discuss the significance of deflators, base-year revisions, and data transparency in Indian macroeconomic policymaking.
- May 2026 IIP growth was supported by manufacturing, electricity, and capital goods, while mining contracted. Analyze how sectoral and use-based IIP data should be used to assess the health of India’s industrial economy.
- Official statistics require both technical accuracy and public trust. Examine this statement using the 2022-23 IIP series revision as an example.
Sources: PIB, Ministry of Statistics and Programme Implementation and The Hindu Economy.
Frequently Asked Questions
What is IIP?
IIP, or Index of Industrial Production, is a short-term indicator that measures changes in industrial output relative to a base year. It tracks sectors such as mining, manufacturing, electricity and gas supply, and water-related services.
What changed in May 2026 IIP?
MoSPI reported 5.1% IIP growth for May 2026 and revised the 2022-23 IIP series by using Output PPI instead of WPI as the deflator for value-based item groups.
Why does Output PPI matter?
Output PPI captures producer-level output prices. For item groups where production is collected in value terms, it helps remove price effects more precisely and improves the estimation of real industrial output.
How many IIP groups are affected?
The Output PPI deflator affects 234 out of 463 item groups in the IIP basket. PIB said these groups account for 36.02% of the total index weight.
Which sector led May growth?
Electricity and Gas Supply grew 9.9%, while Manufacturing grew 5.5%. Mining and Quarrying contracted 1.6%, so the headline 5.1% growth came with mixed sectoral signals.
Why is this relevant for UPSC?
It links GS3 Economy themes such as industrial growth, statistical systems, national income accounting, deflators, base-year revision, and data governance. It can appear in both Prelims facts and Mains analytical questions.
Tell Google you want more of this.
Add Anantam IAS as a preferred sourceOne tap, and this site shows up more often in your own Top Stories, AI Overviews and AI Mode. Remove it any time.