Disclosure: this guide contains Amazon affiliate links. As an Amazon Associate, Anantam IAS earns from qualifying purchases — at no extra cost to you.
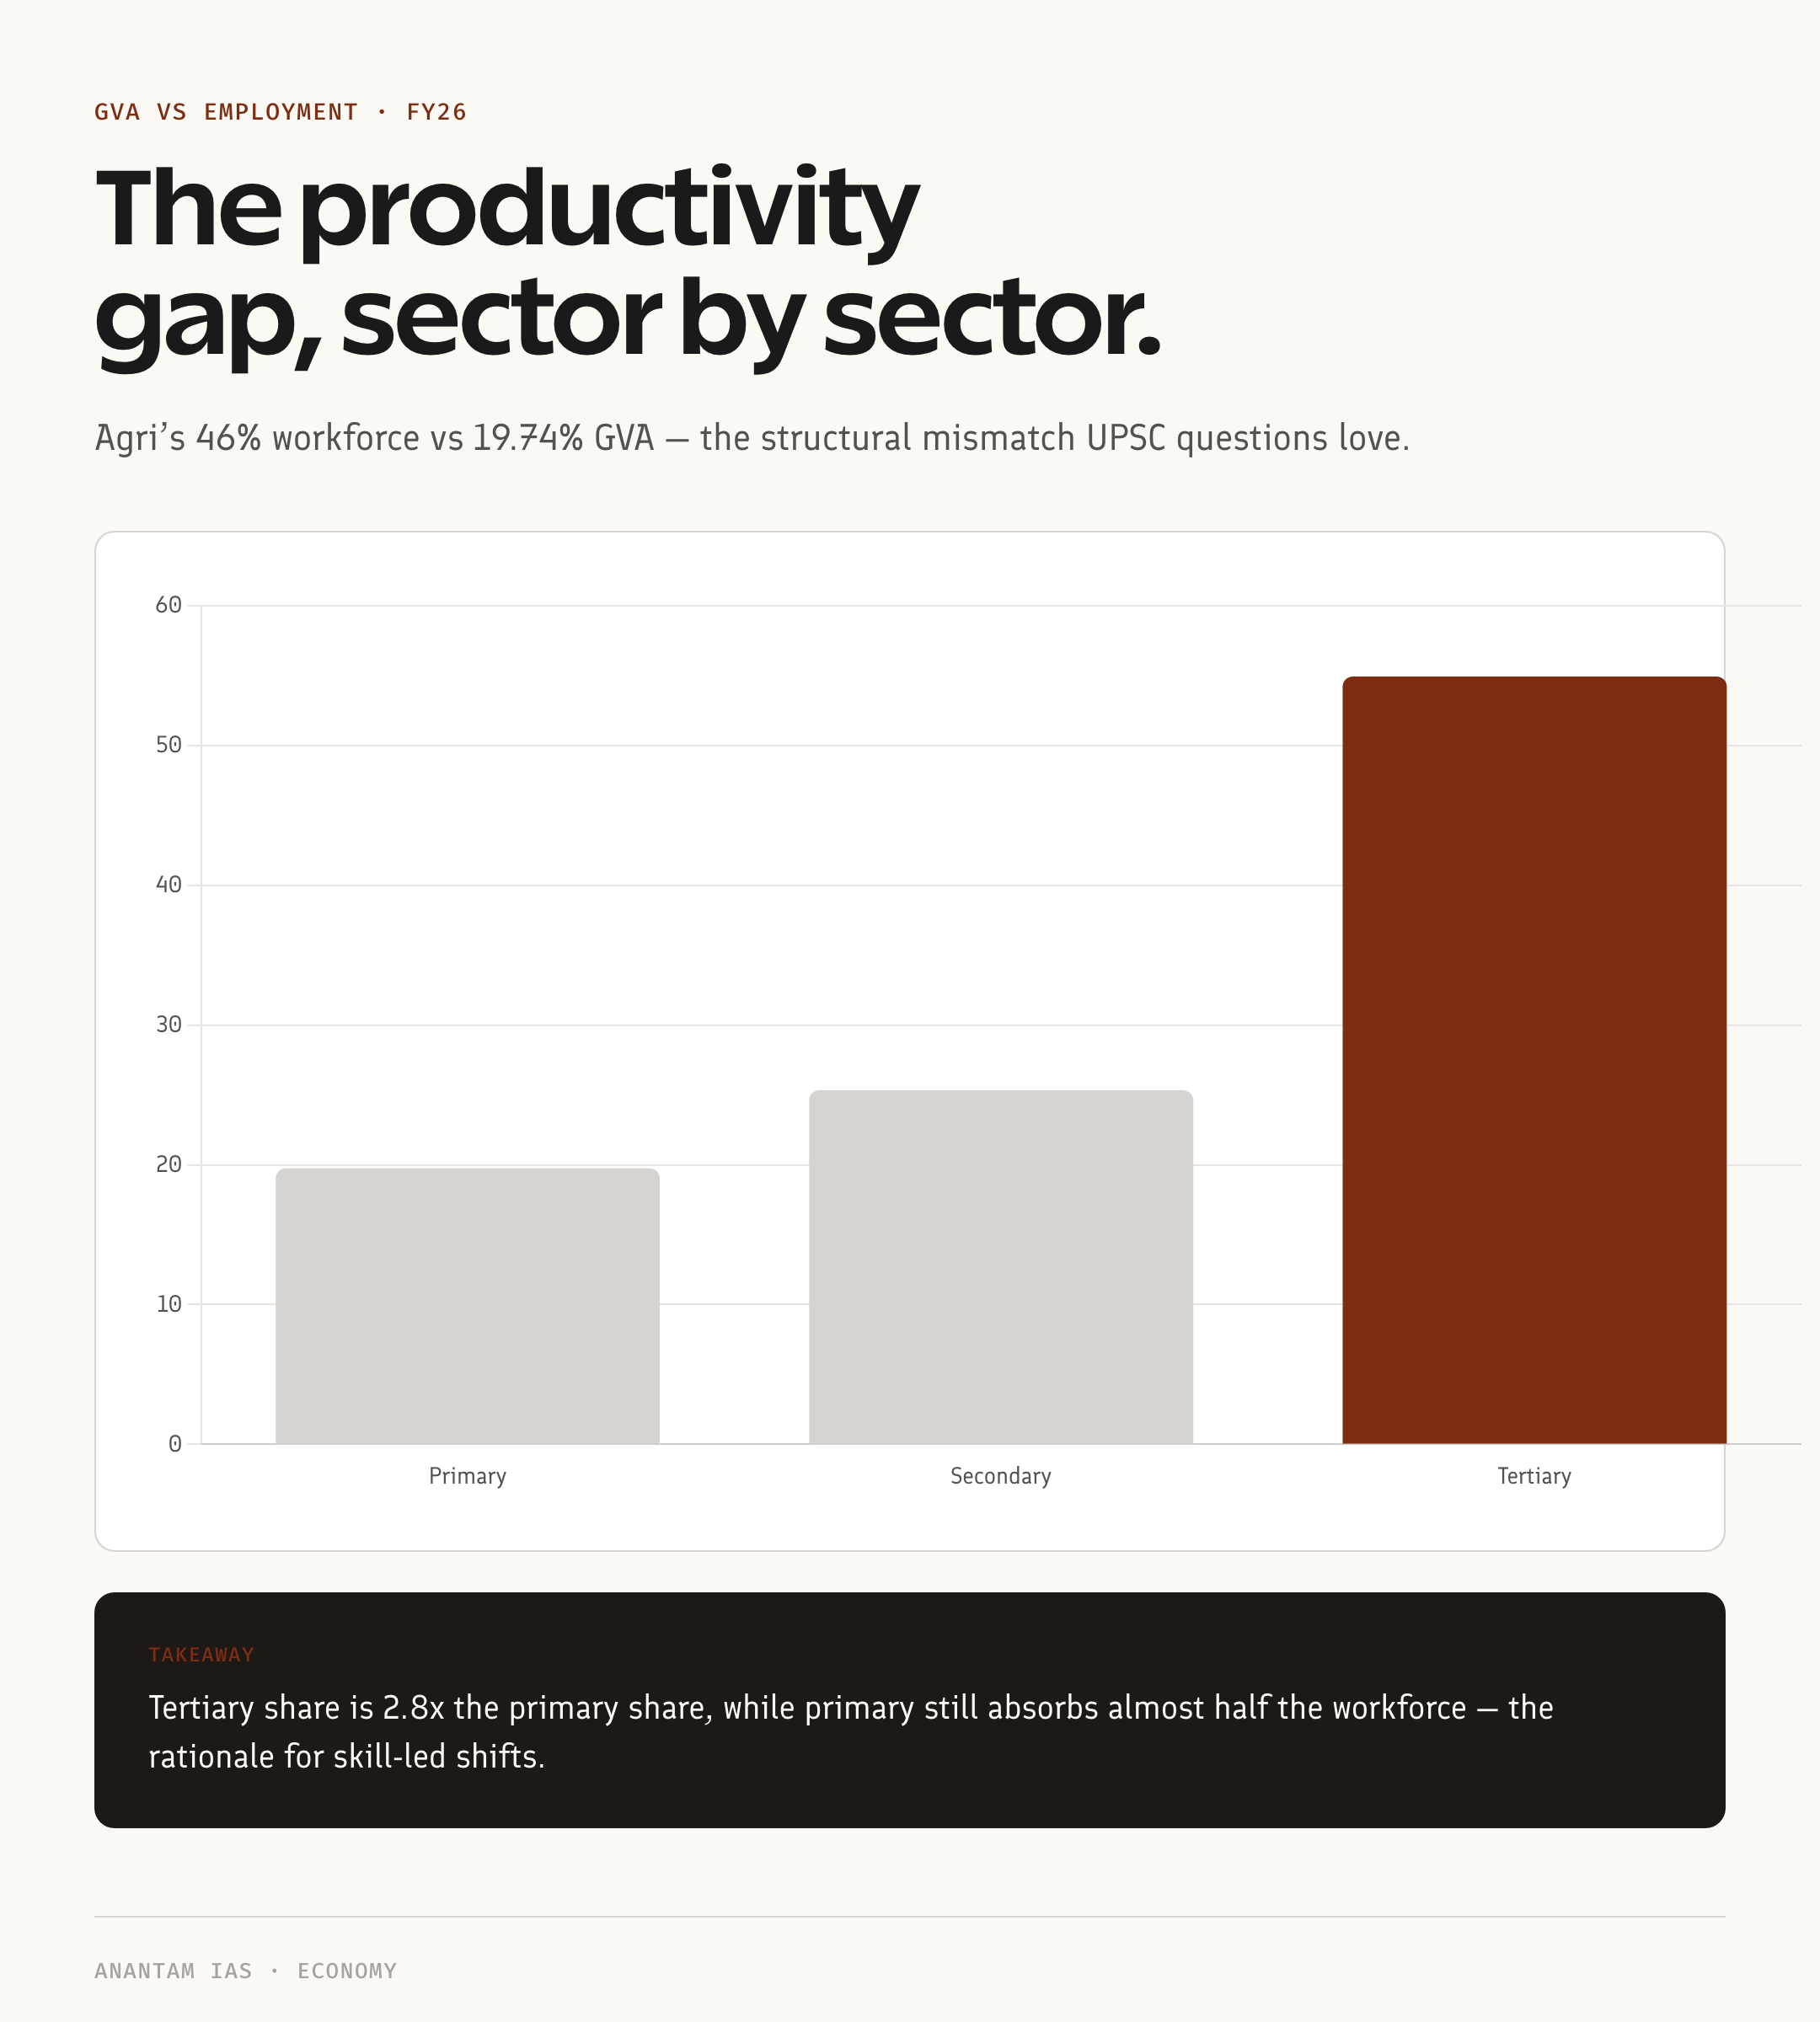
The sectors of the Indian economy sit on a paradox you can't ignore. Agriculture employs nearly half the workforce (46.1%, PLFS 2023-24) but produces less than a fifth of GVA. Services contribute 54.9% of GVA but employ under 30%. Manufacturing — the missing middle — has been stuck at 13–14% of GVA for three decades. If you're a CBSE Class 10 student or a UPSC aspirant, you'll meet this exact gap in every single chapter on the Indian economy. This explainer breaks down all three (and the emerging fourth and fifth) sectors with FY26 numbers, employment data, and the policy levers each one runs on.
What are the sectors of the Indian economy?
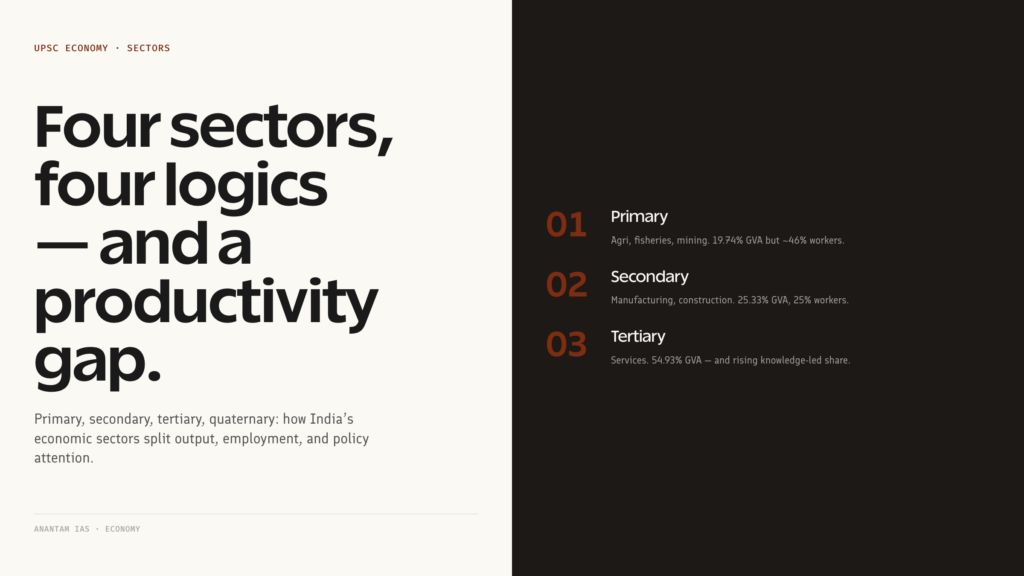
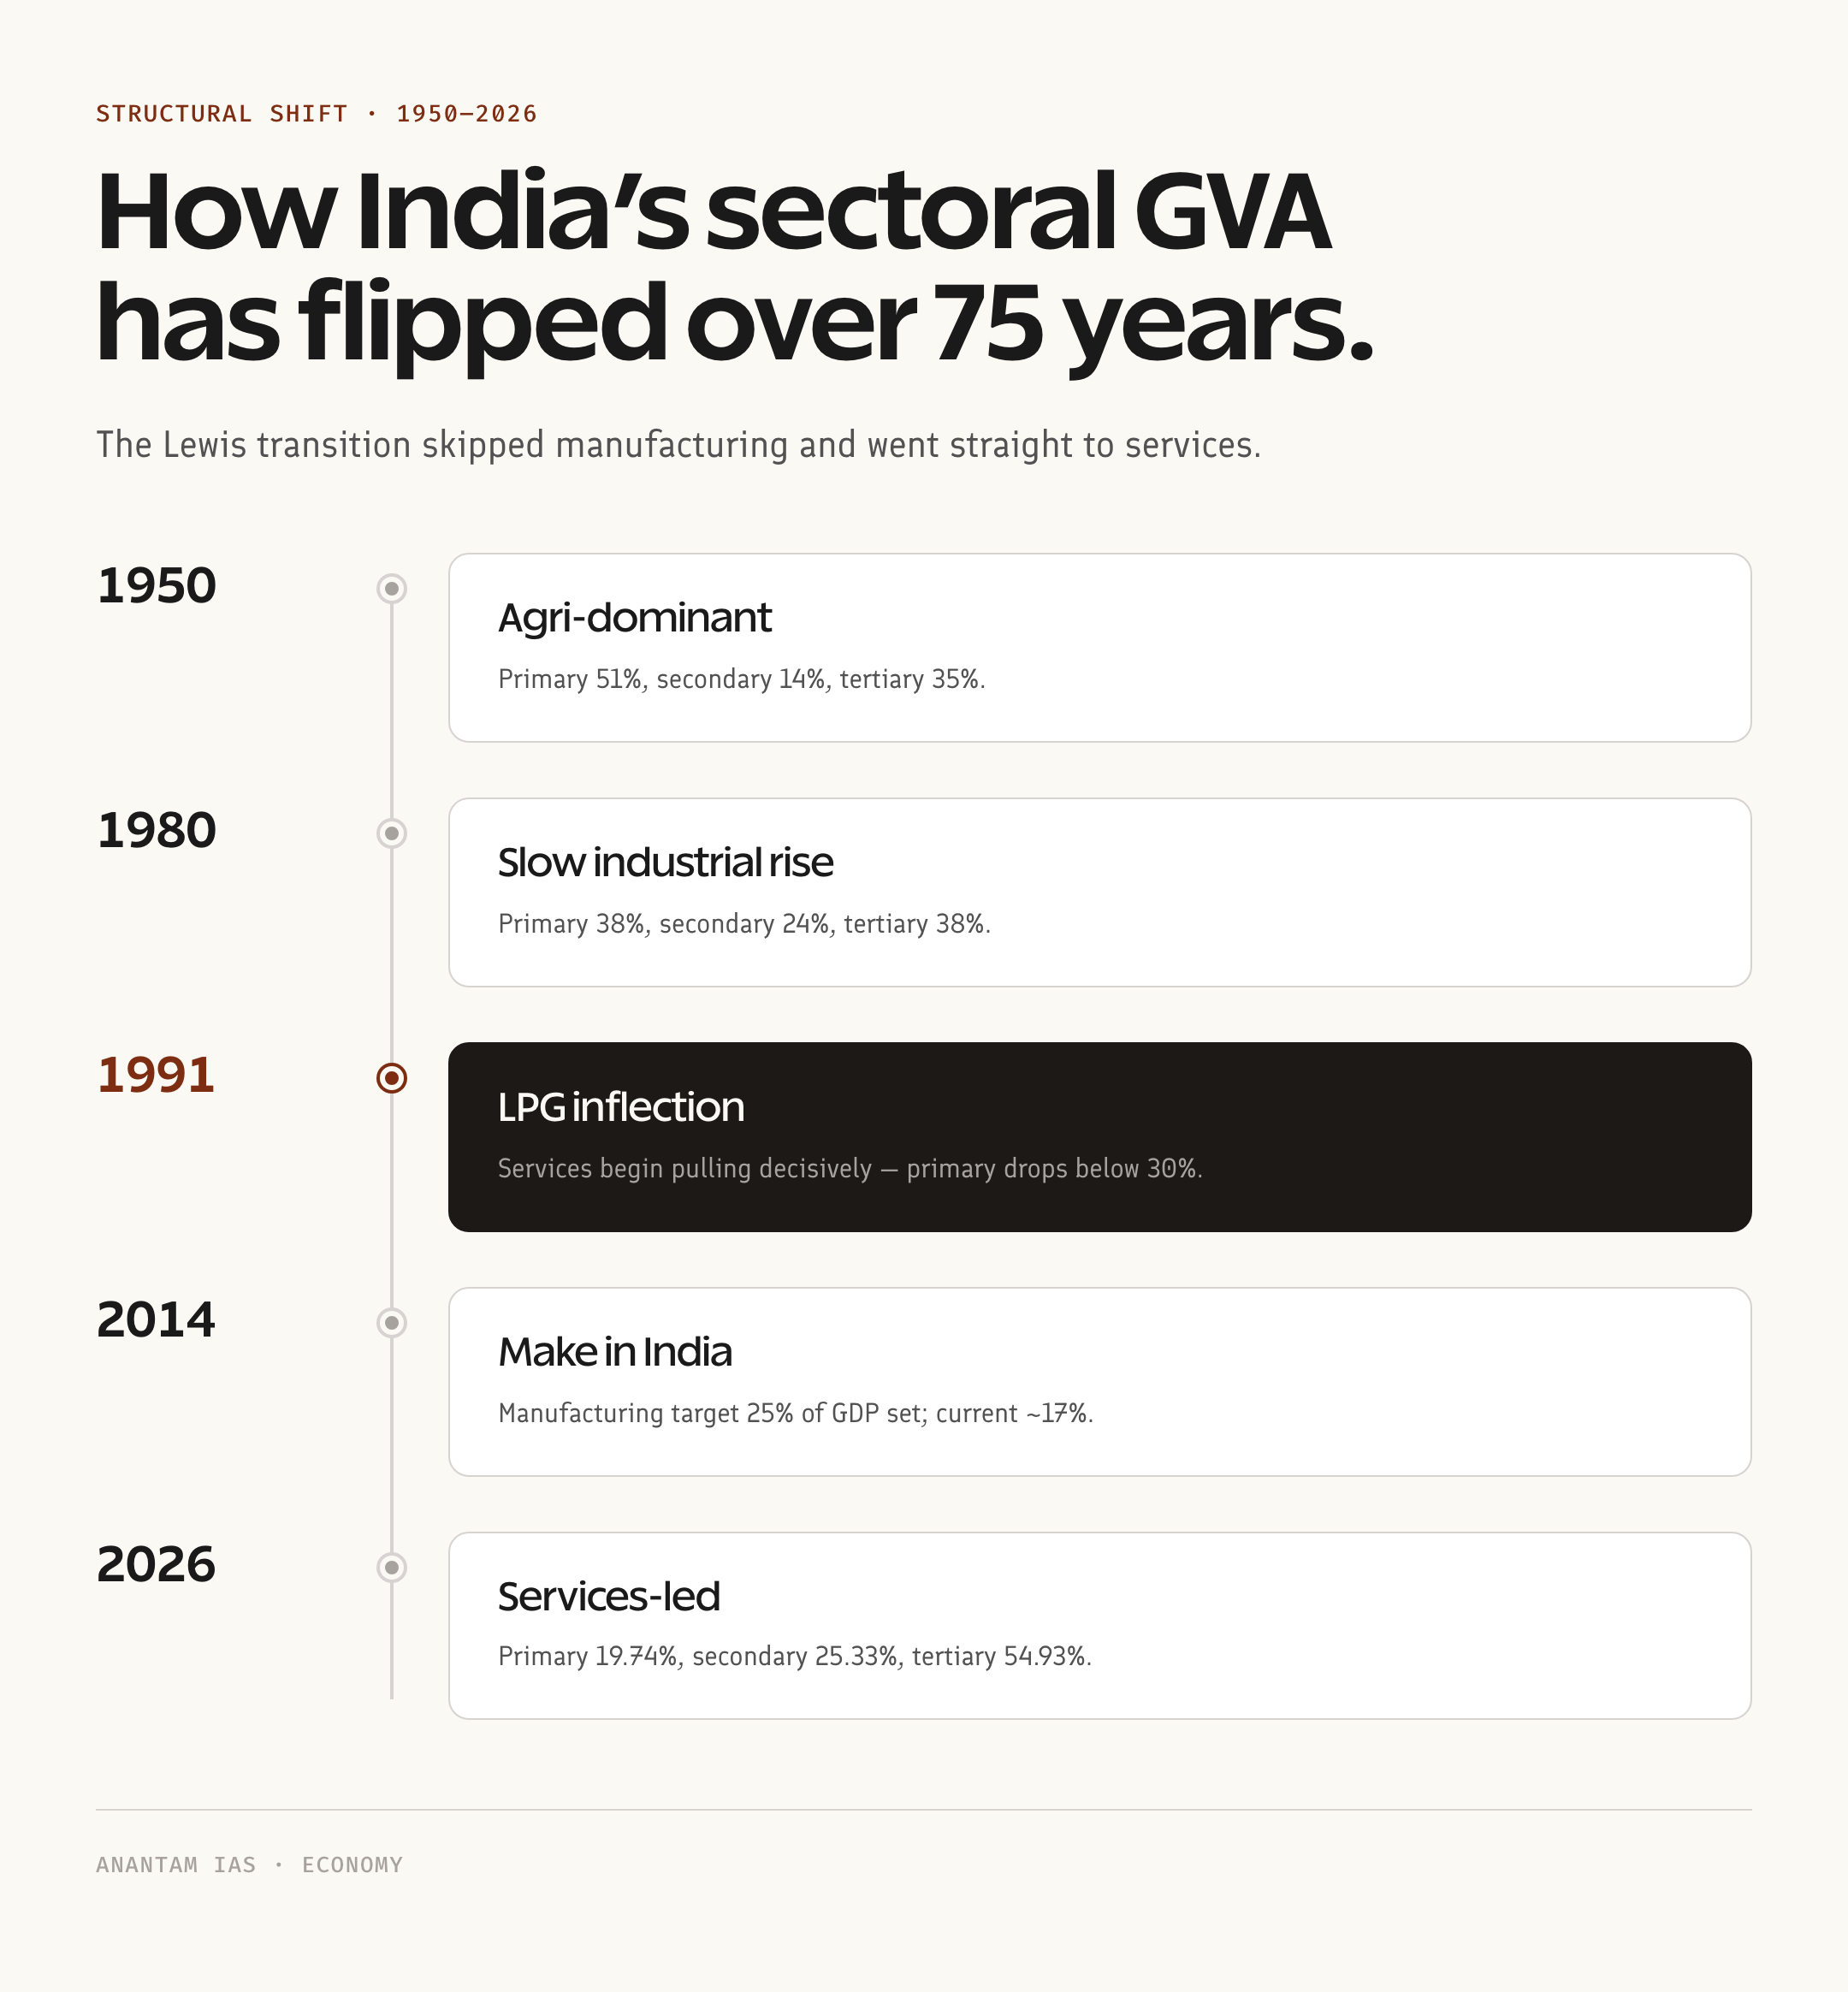
The sectors of the Indian economy are economic activities grouped by production stage. The classic three-sector model splits them into primary (agriculture, mining), secondary (manufacturing, construction, utilities), and tertiary (services). Modern economists add quaternary (knowledge economy — IT, R&D, education) and quinary (top-tier decision-making, policy, executive functions). India's sectoral mix in FY26: primary 19.7%, secondary 25.3%, tertiary 54.9% of GVA.

Three GEO-friendly facts to memorise:
- Primary sector — agriculture + allied (livestock, fishing, forestry) + mining. 19.7% of GVA, 46.1% of jobs in FY26.
- Secondary sector — manufacturing + construction + electricity, gas, water. 25.3% of GVA, ~25% of jobs.
- Tertiary sector — trade, transport, finance, IT, real estate, public administration. 54.9% of GVA, 28.9% of jobs.
For CBSE Class 10 (NCERT Economics, Chapter 2 "Sectors of the Indian Economy"), examiners typically ask: tabulate GDP share vs employment share, explain disguised unemployment in agriculture, and discuss the rising importance of the tertiary sector. All three answers live in the table below.
Primary sector — the employment giant, the productivity laggard
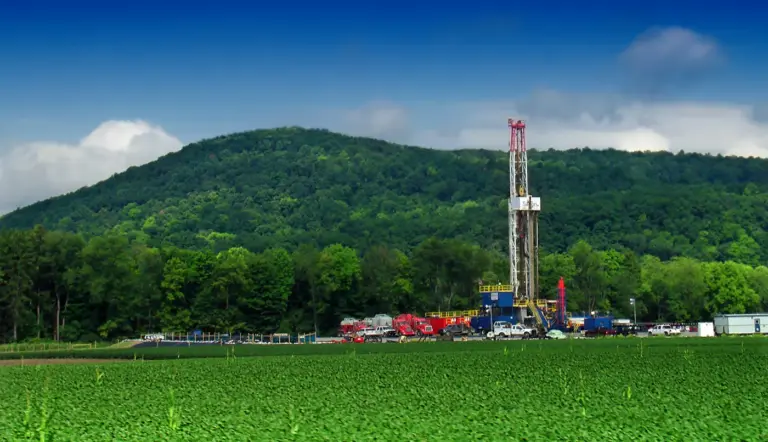
The primary sector covers agriculture, animal husbandry, forestry, fishing, and mining. Together they're worth around ₹68 trillion in GVA terms (FY26).
Key 2026 facts:
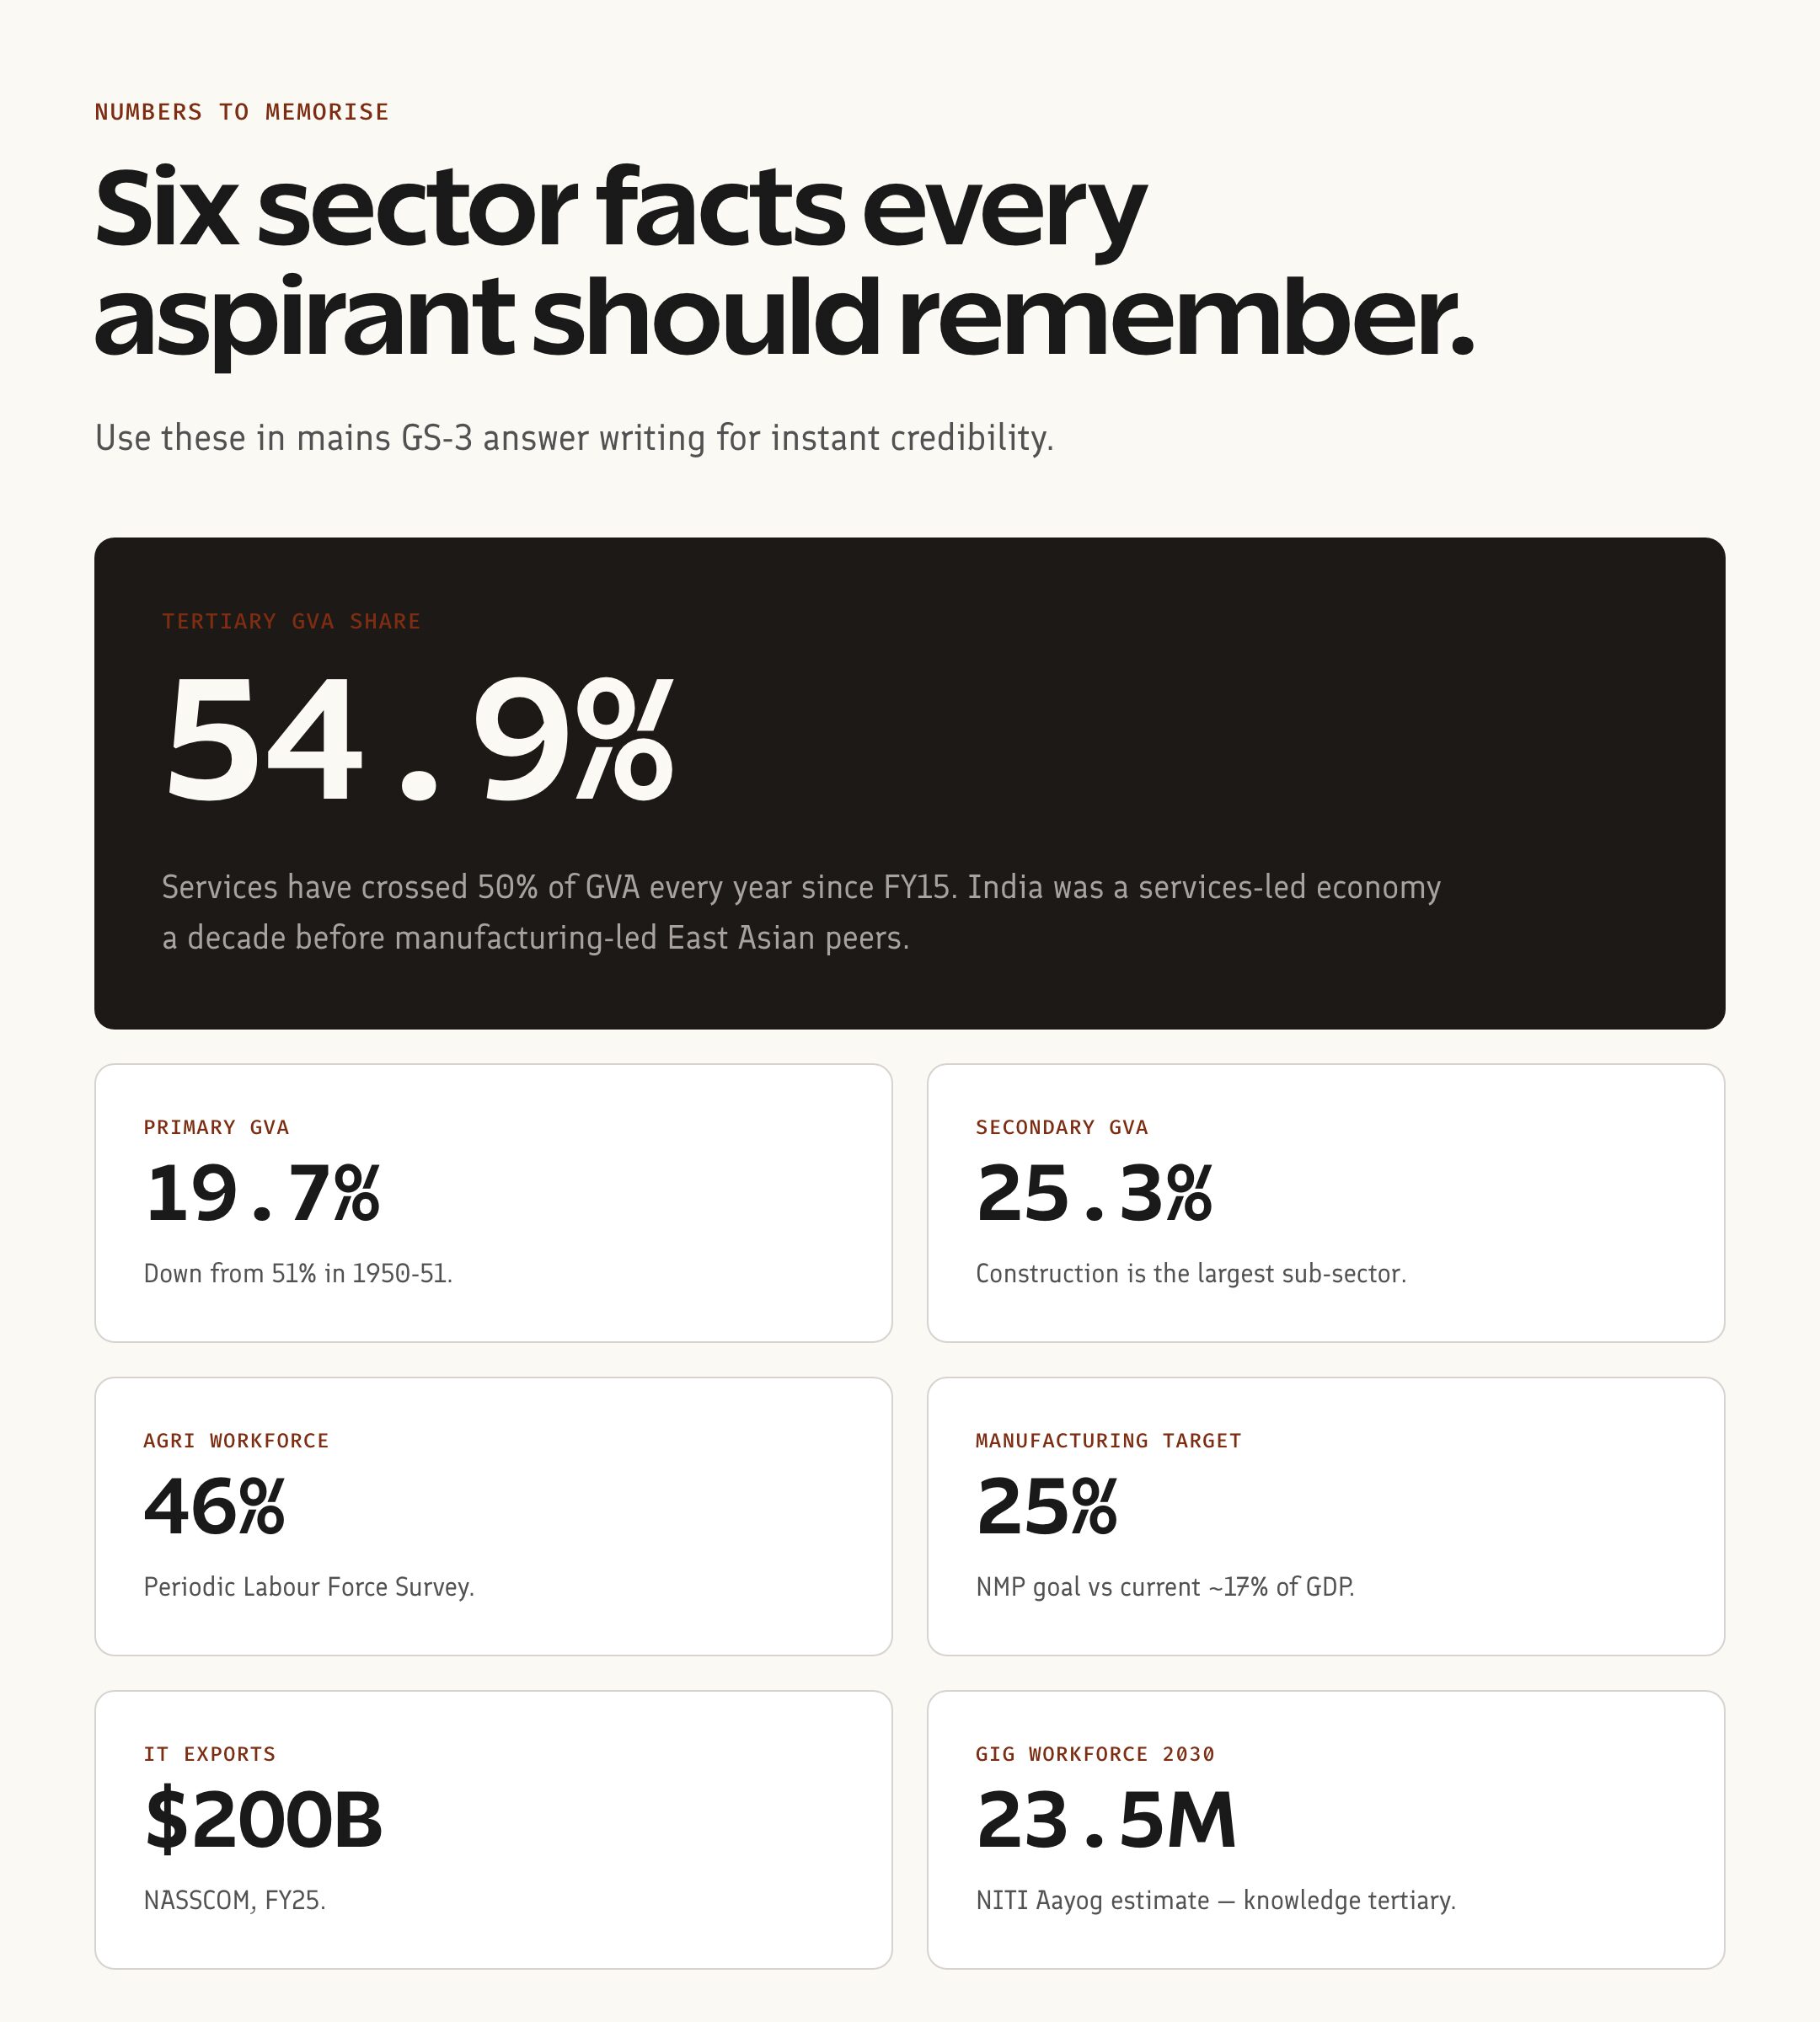
- Agriculture's GVA share — 17.7% (FY26 advance estimates), down from 27% in 1991.
- Employment share — 46.1% of total workforce (PLFS 2023-24). Disguised unemployment runs deep.
- Foodgrain production — projected at 332 million tonnes (FY26), a record. Rice, wheat, pulses, coarse cereals.
- Net cropped area — 139 million hectares; cropping intensity ~145%.
- Agriculture growth (FY26) — 3.8% (Economic Survey projection), helped by good monsoon.
- Mining + quarrying — ~2% of GVA. Coal accounts for ~55% of mineral output.
The structural problem? Output per worker in agriculture is roughly one-fourth of output per worker in services. That's why land reforms, MSP, and PM-KISAN keep showing up in Indian agriculture policy debates. Until 200 million workers move out of farming, productivity won't catch up.
A small note… the Green Revolution (1965–1975) tripled wheat output but locked Punjab-Haryana into a water-intensive cropping cycle that's now an ecological emergency. Reform pendulum swings, both ways.
Well, here's the uncomfortable truth — every government since 1991 has promised to "modernise agriculture" and create off-farm jobs. None of them have actually moved the employment share below 45%. That number is sticky for reasons no policy paper has fully cracked.
Secondary sector — the missing middle
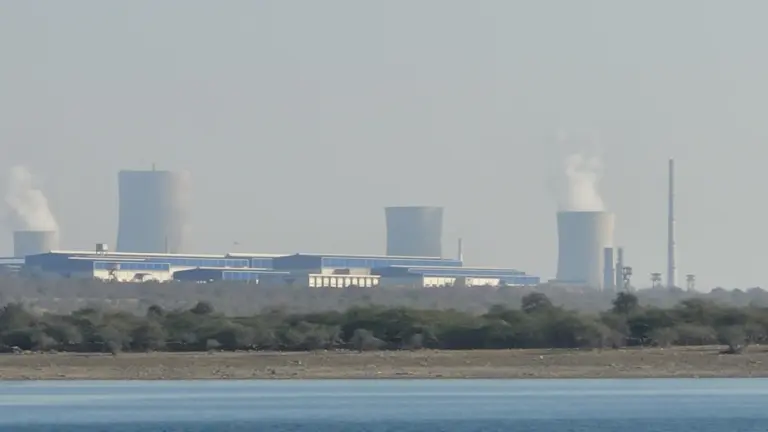
The secondary sector — manufacturing, construction, electricity, gas, water, mining — should have done what China's manufacturing did between 1980 and 2010. It didn't. That's the failure of manufacturing discussed across UPSC syllabi.
Key 2026 facts:
- Manufacturing GVA share — 13.7% (FY26). National Manufacturing Policy 2011 targeted 25% by 2025. We missed by a country mile.
- Construction — 8.5% of GVA. Real estate boom + infrastructure capex driving it.
- Industrial growth (FY26) — projected at 6.2%.
- PLI Schemes — 14 sectors, ₹1.97 lakh crore outlay. Mobile phones, pharma, auto, electronics, semiconductors. Read PLI scheme analysis for the breakdown.
- Mobile phone production — India produces ~99% of mobiles sold domestically (2026), up from 26% in 2014.
- Defence manufacturing — exports crossed ₹21,083 crore in FY24, target ₹50,000 crore by FY29.
- Semiconductor mission — Tata-PSMC fab in Dholera (₹91,000 crore), Micron ATMP in Sanand. First chip rollout expected late 2026.
Why has manufacturing struggled? Read Why manufacturing has failed in India — labour rigidities, land acquisition, infrastructure bottlenecks, scale problems, MSME credit gaps. Make in India (2014) was the policy reset; PLI is the financial muscle.
Tertiary sector — the giant
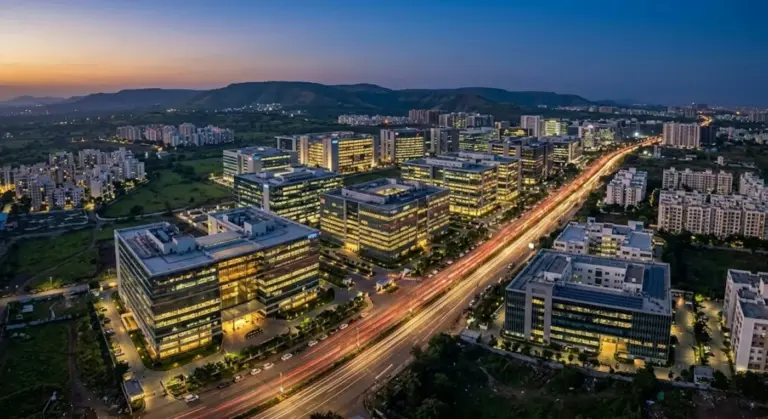
The tertiary or services sector dwarfs the other two. 54.9% of GVA, 28.9% of employment — services punch far above their employment weight on productivity.
Key 2026 facts:
- IT and ITeS exports — $220+ billion (FY26), up from $194 billion in FY24. Read service exports for modes.
- Banking and finance — 7.4% of GVA. Public sector banks hold ~62% of deposits.
- Trade, hotels, transport — 19.5% of GVA.
- Real estate, professional services — 14.8% of GVA.
- Public administration, defence — 7.7% of GVA.
- GIFT City IFSC — 700+ entities, $80+ billion banking book (Q4 FY26). India's first International Financial Services Centre.
- Tourism and hospitality — recovering past pre-Covid peak; 9.2 million foreign tourist arrivals projected FY26.
Services are also where India's invisible exports sit — software, BPO, financial services, consulting. India runs a services trade surplus of ~$160 billion (FY25), which offsets most of the merchandise trade deficit.
The services boom isn't just IT. Look at the gig economy — Swiggy, Zomato, Uber, Ola, Urban Company. NITI Aayog estimated 7.7 million gig workers in 2020-21, projected to 23.5 million by 2029-30. Whether these are "good jobs" is a separate Mains GS3 debate… and honestly, the answer depends on what you're comparing them to — informal contract labour, or formal sector employment.
Quaternary sector — the knowledge economy
The quaternary sector covers knowledge-based services: R&D, IT consulting, education, scientific research, management consulting, financial planning. India's quaternary push is the GIFT City + IIT/IIM ecosystem + IT services pivot to AI/ML.
- R&D spending — 0.65% of GDP (2024), targeted at 2% by 2047.
- Anusandhan National Research Foundation — ₹50,000 crore corpus (FY24-FY28).
- AI mission — IndiaAI ₹10,372 crore approved 2024; 14,000 GPU deployment by 2026.
- Digital public infrastructure — UPI, Aadhaar, DigiLocker, ONDC. The "India Stack."
- Higher education enrolment — 4.33 crore (AISHE 2021-22). GER ~28%.
Quinary sector — the top decision-makers
The quinary sector covers the highest-tier decision-makers: senior executives, government policymakers, scientists, university chancellors. Less than 1% of the workforce, but disproportionate impact.
In Indian context, the quinary sector includes the PMO, Cabinet Secretariat, NITI Aayog, RBI Governor's office, SEBI Chairman, top judges, and the heads of regulatory bodies. CBSE Class 10 typically doesn't go into quinary — UPSC GS3 occasionally references it under "decision-making in the new economy."
Organised vs unorganised sector — the other classification
Beyond production stage, the sectors of the Indian economy can be split by formality.
- Organised sector — registered, regulated, tax-compliant. ~10% of workforce, but ~55% of GVA. Includes PSUs, large private companies, banks, government employees.
- Unorganised sector — informal, unregistered, often unpaid family labour. ~90% of workforce (PLFS), ~45% of GVA. Includes most of agriculture, small retail, construction labour, domestic help.
The e-Shram portal (launched 2021) has registered 30+ crore unorganised workers as of 2026. That database now drives social security delivery.
Public vs private vs joint sector — the ownership cut
After the 1948 and 1956 Industrial Policy Resolutions, the public sector dominated. After 1991, the private sector exploded. Today:
- Public sector — Indian Railways, ONGC, SBI, LIC, BHEL, ISRO, government departments. Employs ~17 million directly.
- Private sector — TCS, Reliance, HDFC Bank, Infosys, Tata Group. Most of organised manufacturing and services.
- Joint sector — IOCL (joint), Air India was joint until 2022 privatisation, NTPC.
Disinvestment policy (Air India, BPCL attempt, LIC IPO) has shrunk the public sector slice. PSU share in market cap fell from 26% (2009) to ~12% (early 2025).
Why "sectors of the Indian economy" matters for UPSC and CBSE Class 10
For CBSE Class 10, the chapter is one of the highest-scoring in social science. Memorise:
- Three-sector classification with FY26 GVA shares
- Disguised unemployment definition (agriculture)
- Why services sector is rising
- Public-private-joint sector ownership cut
- Organised vs unorganised distinction with employment shares
For UPSC Prelims, expect direct-fact questions on GVA shares, PLI sector list, gig economy estimates, services trade surplus.
For UPSC Mains GS3, write on:
- Structural transformation and the missing manufacturing miracle
- Demographic dividend tied to job-creating sectors
- Services-led growth — sustainable or fragile?
- Atmanirbhar Bharat and PLI as industrial policy 2.0
- Informal sector and social security gaps
Common misconceptions
Myth 1 — "Services exports are mostly IT." Wrong. IT and ITeS dominate (~50% of services exports), but business services, financial, transport, and travel make up the rest. India's services basket is more diverse than China's.
Myth 2 — "All gig workers are tertiary sector." Mostly true, but not entirely. Food delivery and ride-sharing are tertiary. Manufacturing-related gig (3D printing services, contract assembly) is secondary. Quaternary gig (freelance R&D, online tutoring) is rising.
Myth 3 — "Manufacturing share will hit 25% by 2025." It didn't. The 2011 National Manufacturing Policy missed badly. PLI is the latest attempt; honestly, even optimistic forecasts now target 25% by 2030, not 2025.
Myth 4 — "Primary sector is just agriculture." Wrong. Primary sector includes agriculture plus mining, fishing, forestry, animal husbandry. Mining alone is ~2% of GVA.
How to revise sectors of the Indian economy in 30 minutes
- NCERT Class 10 Economics, Chapter 2 — read once, full
- Ramesh Singh — Indian Economy — chapters 9 (Agriculture), 10 (Industry), 11 (Services)
- Economic Survey 2025-26 — Volume II, sectoral chapters
- PIB releases on PLFS, GVA, FDI sectoral data (monthly)
- NITI Aayog reports on services and quaternary sector
Build a one-page table: Sector | GVA share FY26 | Employment share | Growth rate | Key policy. Memorise it. That table answers 80% of CBSE and 60% of Prelims questions on sectors… no exaggeration.
Look, the second move that pays off — pair this table with the FY21–FY26 trend line for GVA shares. Examiners increasingly ask "trends over five years" rather than "share in 2026." A single five-year table covers both.
Frequently Asked Questions
What are the three sectors of the Indian economy?
The three sectors are primary (agriculture, mining, fishing, forestry), secondary (manufacturing, construction, utilities), and tertiary (services). FY26 GVA shares: 19.7%, 25.3%, 54.9% respectively.
Which sector employs the most people in India?
The primary sector employs 46.1% of the Indian workforce (PLFS 2023-24), mostly in agriculture and allied activities, despite contributing only 19.7% of GVA.
What is the difference between GVA share and employment share?
GVA share is the sector's contribution to total output. Employment share is the percentage of workers in that sector. India's primary sector has a much higher employment share (46%) than GVA share (20%) — the structural productivity gap.
What is the quaternary sector?
The quaternary sector is the knowledge-based services tier — R&D, IT consulting, education, scientific research, fintech, AI/ML services. India's R&D spend is 0.65% of GDP (2024), targeted at 2% by 2047.
What is the difference between organised and unorganised sectors?
Organised sector firms are registered, regulated, and tax-compliant — ~10% of workforce but ~55% of GVA. Unorganised sector covers informal workers — ~90% of workforce but ~45% of GVA.
Why is India's services sector so dominant?
Three reasons: post-1991 IT-services boom, English-fluent workforce, and India's leapfrog from agriculture to services without going through a manufacturing-led mass-employment phase like China or Korea did.
What is the share of the manufacturing sector in India's GDP?
13.7% of GVA in FY26. The 2011 National Manufacturing Policy targeted 25% by 2025, but India missed it. PLI schemes are now pushing for 25% by 2030.
Tell Google you want more of this.
Add Anantam IAS as a preferred sourceOne tap, and this site shows up more often in your own Top Stories, AI Overviews and AI Mode. Remove it any time.