Why in News?
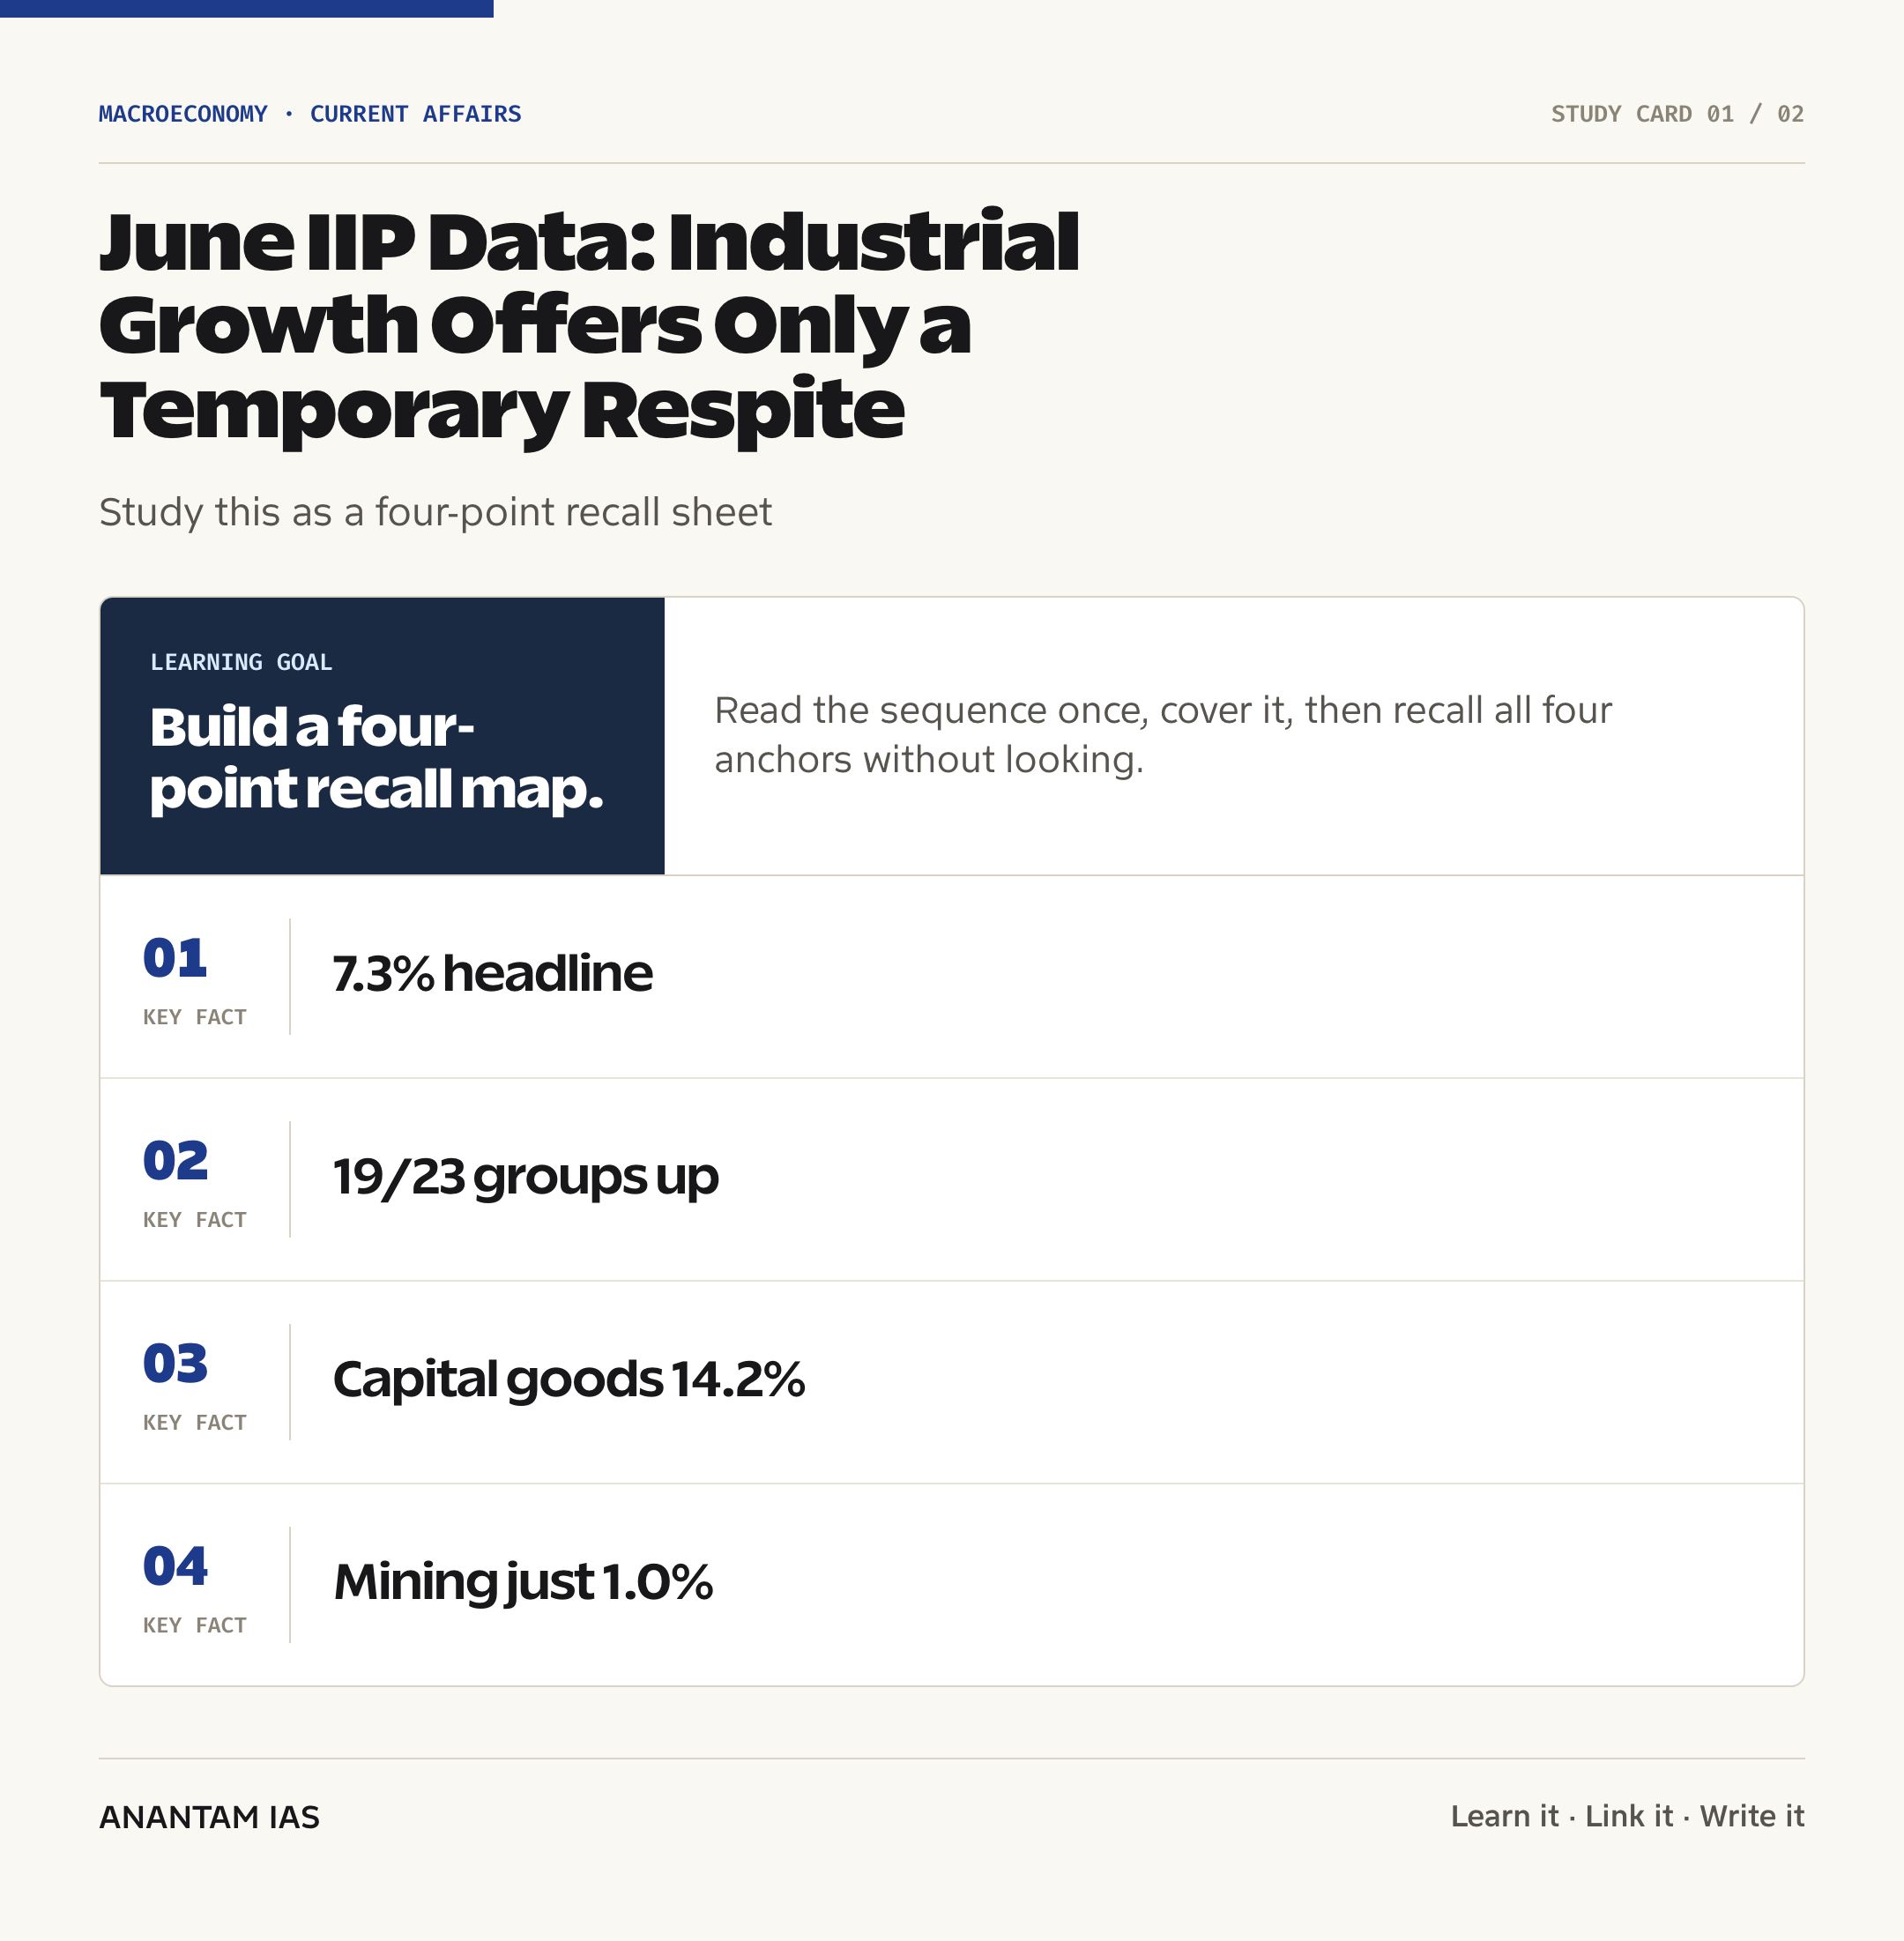
The National Statistics Office under the Ministry of Statistics and Programme Implementation released the Quick Estimates of the Index of Industrial Production for June 2026 on July 28, 2026. The general index recorded 7.3% year-on-year growth, up from the revised 5.0% recorded for May.
The headline improvement was led by Manufacturing at 7.8% and Electricity and Gas Supply at 10.6%. But Mining and Quarrying grew only 1.0%, and the pattern across industries and use-based categories shows why one strong month should be treated as a temporary respite rather than proof of a durable industrial upcycle.
- The general IIP index rose to 123.1 in June 2026 from 114.7 in June 2025.
- Sectoral growth was 1.0% in Mining, 7.8% in Manufacturing, 10.6% in Electricity and Gas Supply, and 6.1% in Water Supply, Sewerage and Waste Management.
- 19 of 23 manufacturing groups recorded positive year-on-year growth, indicating wider participation than a rise driven by only one industry.
- Capital goods grew 14.2%, the fastest among the six use-based categories, while primary goods and consumer non-durables each grew 4.9%.
- The April-June cumulative IIP grew 5.8%; mining contracted 1.4% over the same period even as manufacturing expanded 6.3%.
The development matters in the context of:
- The data matters in the context of whether India’s industrial recovery is becoming broad, investment-led and employment-supporting.
- It also tests the quality of the newly rebased 2022-23 IIP series, which expanded coverage and updated the production basket.
- A high monthly growth rate can reflect base effects, sector concentration and temporary production cycles; the level, breadth and persistence must be read together.
- For the wider macroeconomic frame, connect IIP with India’s sectoral economic structure, industrial GVA, capacity use, credit and private investment.
UPSC Relevance
Prelims Relevance
- IIP is a volume index that tracks short-term changes in industrial production relative to a base year.
- It is compiled and released by the National Statistics Office under MoSPI.
- The current series uses 2022-23 as the base year, where the index is set at 100.
- The four sectoral groups are Mining and Quarrying, Manufacturing, Electricity and Gas Supply, and Water Supply, Sewerage and Waste Management.
- Manufacturing has the largest sectoral weight at 76.062 out of 100 in the new series.
- The six use-based categories are Primary Goods, Capital Goods, Intermediate Goods, Infrastructure or Construction Goods, Consumer Durables and Consumer Non-durables.
- The new basket contains 463 item groups, including 120 newly added item groups.
- Quick Estimates are released with a 28-day lag and can be revised as source agencies submit updated production data.
Mains Relevance
GS Paper 3
- Assess the quality and durability of industrial growth through sectoral breadth, use-based demand and cumulative trends rather than the headline rate alone.
- Link capital goods and intermediate goods growth to investment demand, while using consumer categories to test the strength of household demand.
- Discuss the role of base-year revision, updated weights and better deflators in improving measurement of real industrial output.
GS Paper 2
- Use the new IIP series as an example of statistical governance, data transparency, revision policy and public trust in official institutions.
Essay
- What gets measured shapes what gets governed: statistical reform as economic infrastructure.
- Growth is durable only when its breadth, demand base and productive capacity reinforce one another.
Background and Context
What the IIP Measures
The IIP is a high-frequency indicator of changes in the physical volume of industrial production, not a complete measure of industrial welfare or value added.
- An index value above 100 means the measured output level is above the 2022-23 base-year level; it does not itself state the growth rate.
- The reported monthly growth rate compares the index with the same month a year earlier, which reduces seasonal distortion but can still carry a favourable or adverse base effect.
- The IIP tracks production, while Gross Value Added measures value created after subtracting intermediate consumption. Read the distinction alongside the GDP and GVA explainer.
- Because IIP arrives quickly, it helps policymakers and analysts assess momentum before more comprehensive national accounts and industrial survey data become available.
- The Quick Estimate is provisional. MoSPI revises it when source agencies provide more complete factory and establishment returns.
Reading the June Headline
The 7.3% headline combines sectors with sharply different weights and growth rates, so the contribution of each sector matters.
- Manufacturing, with a 76.062% weight, grew 7.8% and supplied the main weight-driven push to the general index.
- Electricity and Gas Supply grew 10.6%, with electricity itself rising 11.4% while gas supply slipped 0.1%.
- Mining and Quarrying grew only 1.0% in June and contracted 1.4% over April-June, revealing a persistent weak point beneath the headline.
- Water Supply, Sewerage and Waste Management, newly included as a separate sector in the rebased series, grew 6.1% in June.
- The overall index stood at 123.1, while cumulative April-June growth was 5.8%. A quarterly cumulative rate is a better persistence check than a single monthly print.
- The May index was updated as more production data arrived. That revision is a reminder to state whether a number is a Quick Estimate or a revised estimate.
Manufacturing: Broad Improvement, Uneven Strength
Manufacturing growth was fairly broad, but the fastest industries and the laggards point to an uneven recovery.
- 19 of 23 NIC two-digit groups expanded over June 2025, a useful breadth signal that supports the headline.
- Electrical equipment grew 34.0%, motor vehicles, trailers and semi-trailers grew 17.5%, and food products grew 10.8%; MoSPI identified them as the top positive contributors.
- A high growth rate is not the same as a high contribution. Contribution also depends on an industry’s weight and absolute change in the index.
- Wearing apparel contracted 6.9%, wood products fell 7.4%, refined petroleum products declined 0.5%, and chemicals slipped 0.3%.
- The mix suggests strength in equipment, vehicles and selected intermediate industries, but does not show a uniform rise across labour-intensive and consumption-facing manufacturing.
- For a prior-month comparison and the deflator change, the June 30 current-affairs digest records the May 2026 IIP release.
Use-Based Categories and the Demand Signal
Use-based classification reorganises industrial items by their economic purpose and helps separate investment, production-chain and consumption signals.
- Capital goods grew 14.2% in June and 14.0% over April-June, consistent with a strong investment-related production signal.
- Intermediate goods grew 9.3% in June and 8.5% cumulatively, pointing to activity within production chains.
- Infrastructure and construction goods grew 7.5% in June and 6.8% over April-June, aligning with continued construction-linked demand.
- Consumer durables grew 7.7% in June and 7.2% cumulatively, while consumer non-durables grew 4.9% in June but only 1.5% cumulatively.
- Primary goods grew 4.9% in June and 2.9% cumulatively, a comparatively softer outcome.
- Capital-goods growth is encouraging but not conclusive proof of a private investment cycle. It should be checked against new orders, credit, capacity utilisation, imports and project completion.
Why the Respite May Be Temporary
A durable industrial recovery needs repeated, broad-based gains that survive base effects and translate into demand, jobs and new capacity.
- One month is not a trend. June’s 7.3% rise must be tested against the next several releases and the cumulative trajectory.
- Mining’s weak result and contractions in selected manufacturing groups show that the rebound is not uniform across the supply base.
- The gap between strong capital goods and modest cumulative consumer non-durables may indicate that investment-facing production is firmer than mass-consumption demand.
- Electricity growth can reflect weather, cooling demand and the production calendar as well as sustained industrial use, so it needs corroboration.
- A favourable base can lift year-on-year growth without an equally large sequential improvement. Compare both the index level and annual growth rate.
- The analytical test is whether the rebound expands into labour-intensive sectors, strengthens household demand and raises private capacity creation.
The 2022-23 Series and Data Quality
The new series improves relevance, but the transition also requires careful comparison and transparent revision.
- The base year moved from 2011-12 to 2022-23 to reflect newer production patterns, technologies and products.
- The basket now covers 463 item groups, compared with 407 in the old series, and includes 120 newly introduced groups.
- Coverage now separately includes gas supply and Water Supply, Sewerage and Waste Management, along with greater detail for renewable and non-renewable electricity.
- MoSPI adopted the Output Producer Price Index as the deflator for 234 item groups collected in value terms. These groups account for 36.02% of total weight.
- The June Quick Estimate used an 86.7% weighted response rate; the final May estimate used 93.1%. Greater response completeness can change later estimates.
- Because the basket, weights, coverage and methods changed, lower-level comparisons with the old series need caution. The Economic Survey explainer provides the wider policy setting for growth, investment and demand.
Way Forward
Read the Dashboard, Not One Number
- Track at least three to six months of sectoral and use-based data before declaring a durable turn.
- Cross-check IIP with industrial GVA, the Index of Core Industries, capacity utilisation, credit, exports, GST activity and employment.
- Separate growth, contribution and weight in Mains answers; the fastest-growing group need not be the largest contributor.
Broaden the Industrial Recovery
- Improve logistics, reliable power, technology adoption and access to finance for MSMEs and labour-intensive industries.
- Support productive investment without mistaking temporary tax or inventory effects for structural competitiveness.
- Strengthen household purchasing power and job creation so that consumer demand can reinforce investment-led production.
Deepen Statistical Credibility
- Publish clear revision tables, response rates and methodological notes with every release.
- Expand digital reporting and source-agency coordination to improve timeliness, completeness and comparability.
- Explain breaks in series and avoid mechanical lower-level linking where changed baskets make comparison unreliable.
Build a Balanced Mains Answer
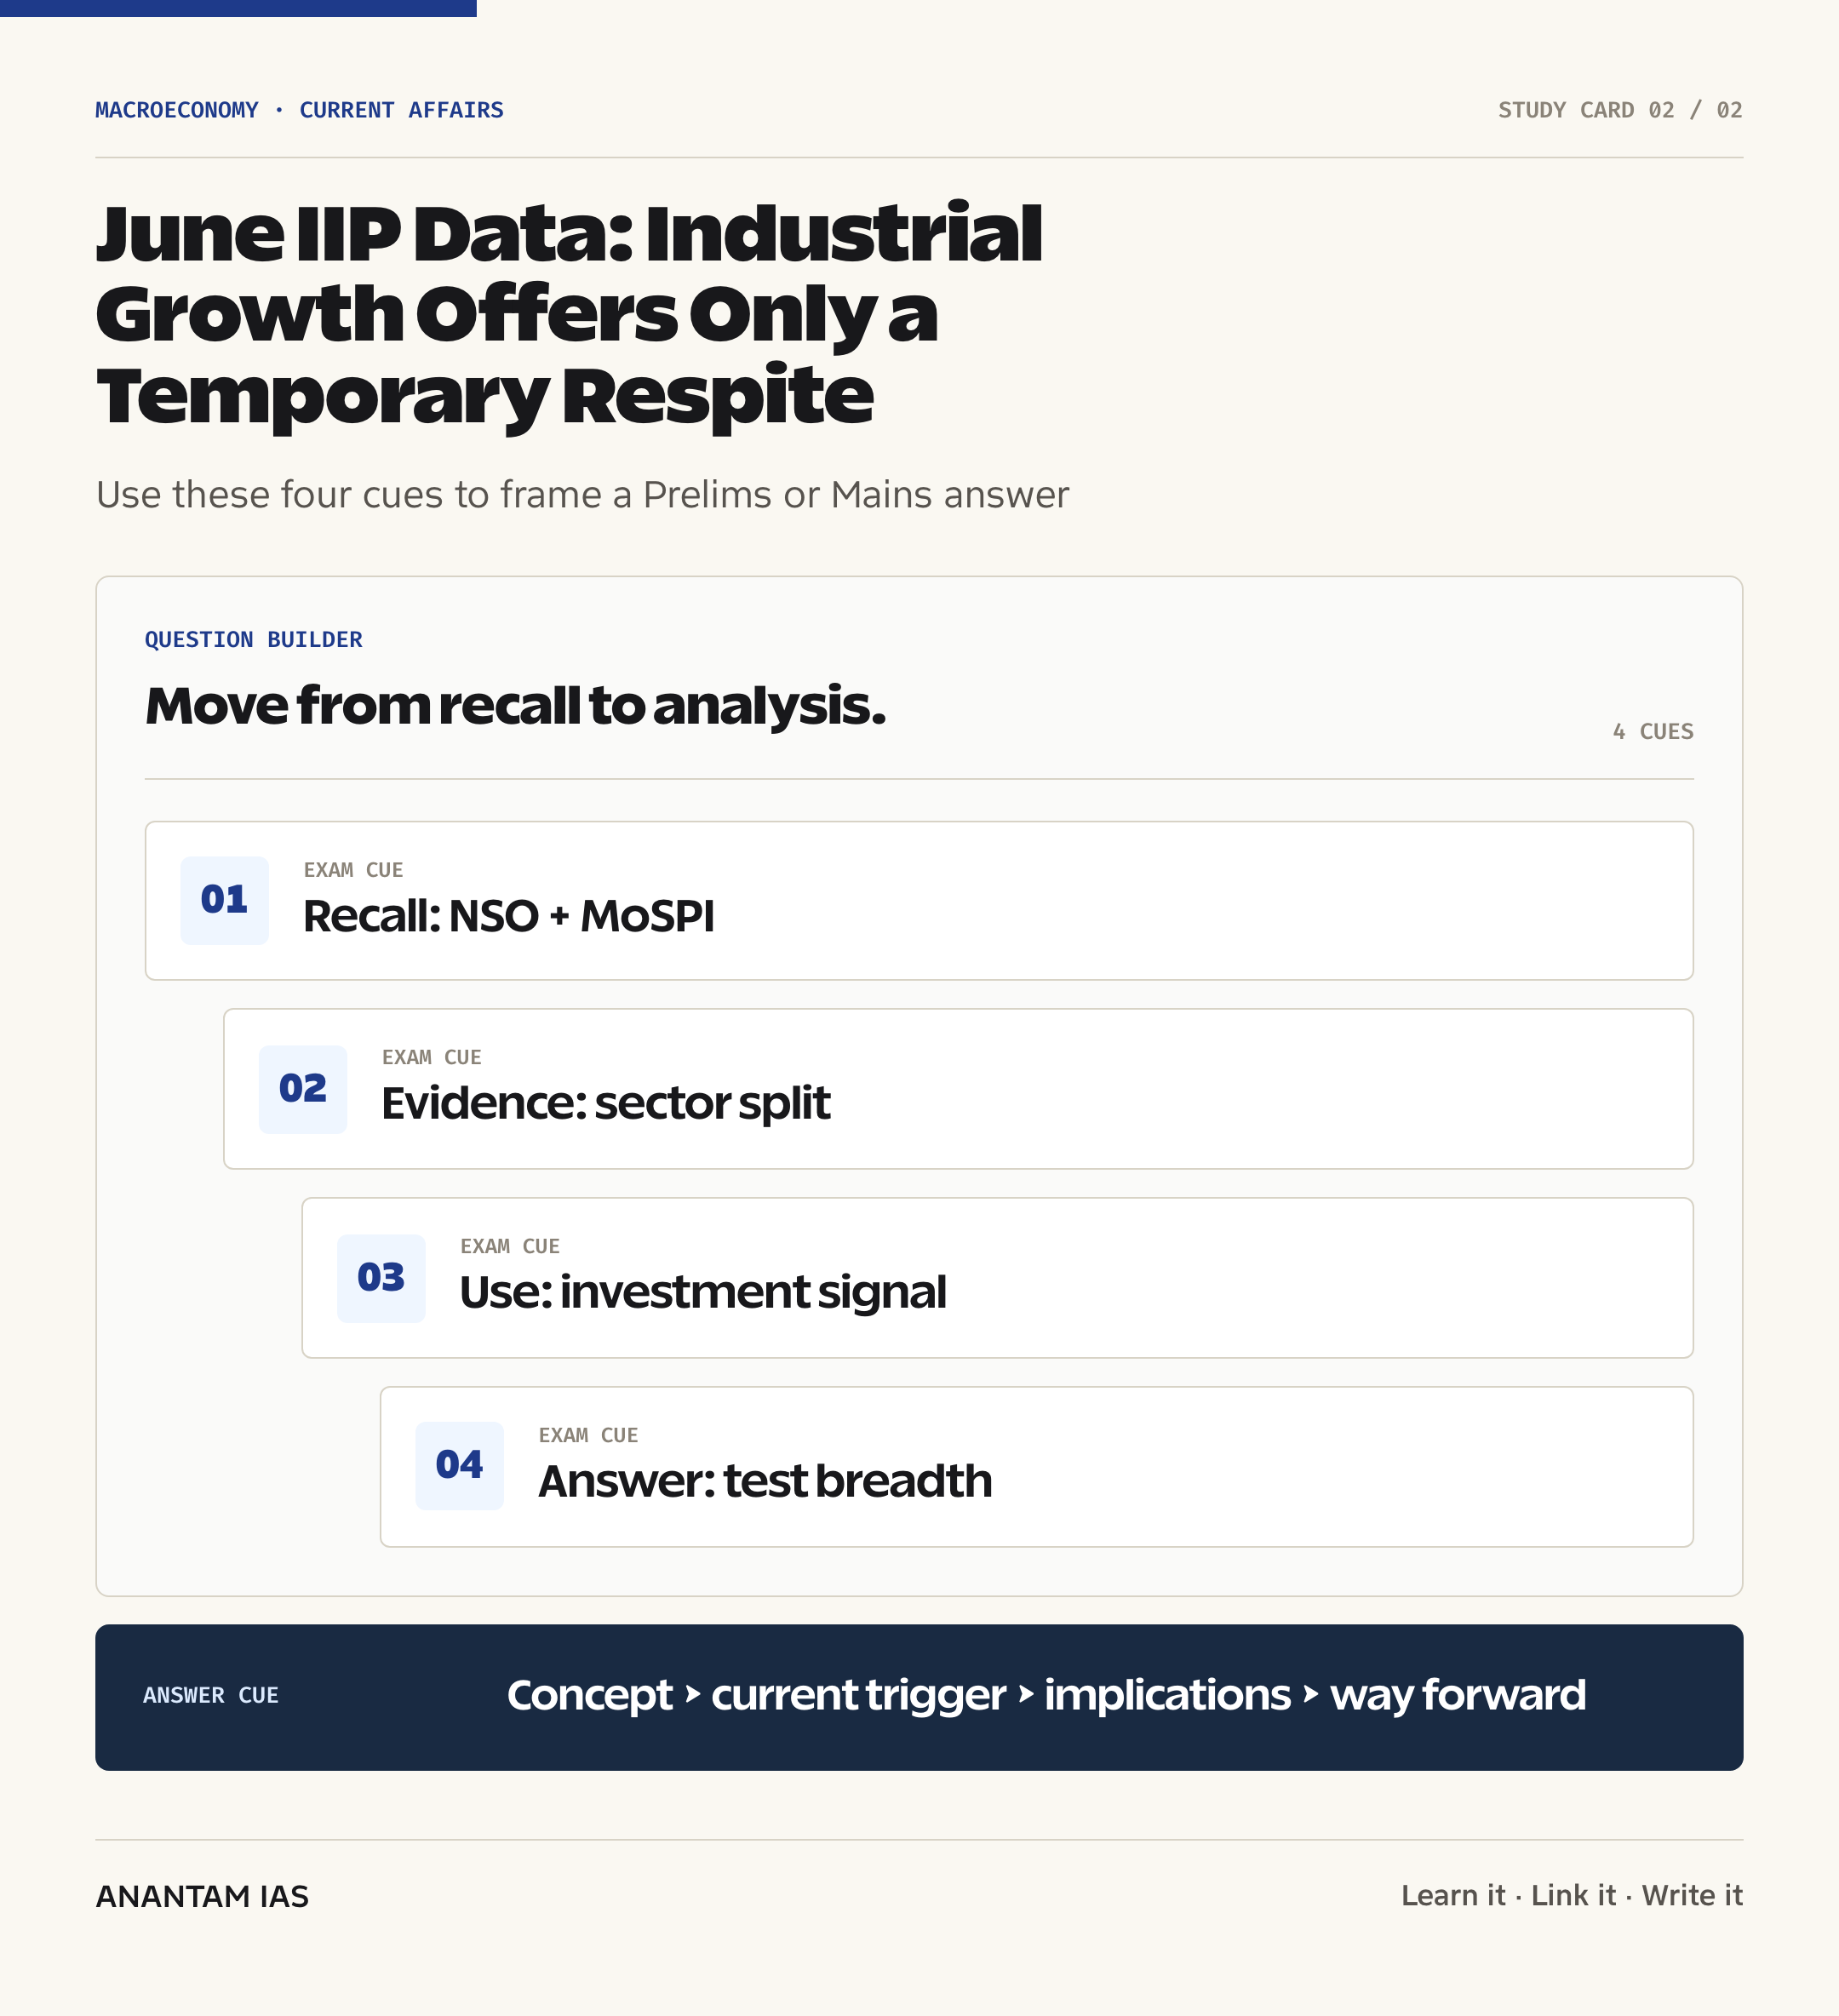
- Open with the 7.3% headline, qualify it with the 5.8% cumulative rate, and then split the evidence into sectoral and use-based signals.
- Place the positive case, including manufacturing breadth and capital goods, against the cautions of weak mining, uneven industries and revisions.
- Close with the test of persistence, breadth, jobs and private capacity rather than predicting a boom or slowdown from one print.
Conclusion
June’s 7.3% IIP growth is a welcome improvement, especially because manufacturing expanded across 19 of 23 groups and capital goods remained strong. It offers evidence of industrial momentum, not a licence to read the economy through one headline.
The stronger judgment is conditional: industrial recovery becomes durable when it persists across months, spreads to mining and labour-intensive manufacturing, supports consumer demand, and converts investment signals into productive capacity and jobs. Until those tests are met, the June print is best treated as a respite that still needs confirmation.
UPSC Practice Questions
Prelims MCQ 1
With reference to India’s Index of Industrial Production, consider the following statements:
- It is compiled by the National Statistics Office under the Ministry of Statistics and Programme Implementation.
- The current series uses 2022-23 as its base year.
- Manufacturing carries the largest sectoral weight in the index.
How many of the above statements are correct?
(a) Only one (b) Only two (c) All three (d) None
Answer: (c) All three
Explanation:
All three statements are correct. The NSO under MoSPI compiles IIP; the current base is 2022-23; and Manufacturing has the largest sectoral weight at 76.062.
Prelims MCQ 2
Which one of the following use-based categories recorded the fastest year-on-year IIP growth in June 2026?
(a) Primary Goods (b) Capital Goods (c) Consumer Durables (d) Infrastructure and Construction Goods
Answer: (b) Capital Goods
Explanation:
Capital Goods grew 14.2%, compared with 4.9% for Primary Goods, 7.7% for Consumer Durables, and 7.5% for Infrastructure and Construction Goods.
UPSC Mains Questions
- June 2026 IIP growth provides encouraging evidence of manufacturing and investment momentum, but not yet proof of a durable industrial recovery. Analyze this statement using sectoral breadth, use-based classification, cumulative trends and the limits of monthly data.
- Base-year revision is not a statistical formality; it changes how an economy sees its productive structure. Discuss the significance of the 2022-23 IIP series, expanded coverage, updated item basket and improved deflation for economic policymaking.
Sources: PIB, Ministry of Statistics and Programme Implementation and The Hindu Editorial.
Frequently Asked Questions
What is the IIP?
The Index of Industrial Production is a monthly volume index that tracks changes in industrial output relative to a base year. India’s NSO compiles it from production data supplied by factories, establishments and source agencies. It is a quick indicator of industrial momentum, not the same as industrial GVA or a complete measure of economic welfare.
Who releases India’s IIP?
The National Statistics Office, which functions under the Ministry of Statistics and Programme Implementation, compiles and releases the IIP. Under the 2022-23 series, the Quick Estimate is released with a 28-day lag. The estimate can be revised as reporting agencies submit more complete production data.
What was June 2026 IIP growth?
India’s general IIP grew 7.3% year on year in June 2026, with the index rising to 123.1 from 114.7 a year earlier. Manufacturing grew 7.8%, Electricity and Gas Supply 10.6%, Water-related activities 6.1%, and Mining and Quarrying 1.0%.
Why is the recovery called temporary?
The description is a caution, not a forecast. The result covers only one month, Mining remained weak, some manufacturing groups contracted, and cumulative consumer non-durables growth was modest. A durable turn needs repeated gains across sectors, stronger household demand, employment creation and evidence that capital-goods production is becoming real productive capacity.
What does capital-goods growth show?
Capital goods grew 14.2% in June and 14.0% during April-June. This can signal demand for machinery and investment-related equipment. But it cannot by itself prove a broad private investment cycle; the reading should be checked against new orders, capacity utilisation, credit, imports, project execution and industrial GVA.
What changed in the new IIP series?
The new series uses 2022-23 as the base year, covers 463 item groups and adds newer products and activities. It separately includes gas supply and water, sewerage and waste management. MoSPI also adopted Output PPI for value-based groups to remove price effects more closely from measured production.
Tell Google you want more of this.
Add Anantam IAS as a preferred sourceOne tap, and this site shows up more often in your own Top Stories, AI Overviews and AI Mode. Remove it any time.