The GDP full form is Gross Domestic Product. GDP is the total monetary value of all final goods and services produced within a country’s domestic territory during a specific period — usually a financial year or a quarter. In India, official GDP estimates are released by the National Statistical Office (NSO) under the Ministry of Statistics and Programme Implementation (MoSPI). As per the Second Advance Estimates released in 2026, India’s real GDP grew 7.6% in FY 2025-26, with nominal GDP at ₹345.47 lakh crore. India is the third-largest economy by PPP and currently the sixth-largest by nominal GDP after the rupee depreciation and the February 2026 base-year revision.
Quick facts: GDP full form and key parameters
| Parameter | Detail |
|---|---|
| GDP full form | Gross Domestic Product |
| Category | Macroeconomic indicator (flow variable) |
| UPSC relevance | Prelims and GS-III Mains, Indian Economy |
| First conceptualised | 1937, by Simon Kuznets, for the US Congress |
| Estimating body in India | NSO, MoSPI |
| Current base year | 2022-23 (revised by NSO in February 2026) |
| FY 2025-26 nominal GDP | ₹345.47 lakh crore |
| FY 2025-26 real GDP growth | 7.6% (Second Advance Estimates) |
What does GDP mean? Three words, three rules
The GDP full form unpacks into three precise rules. UPSC tests this distinction repeatedly in Prelims, so memorising the three-word logic is non-negotiable.
- Gross means depreciation (consumption of fixed capital) has not been deducted. Subtract depreciation and you get Net Domestic Product (NDP). NDP is what is actually available to society after wear and tear of capital.
- Domestic means output is counted by territorial boundaries, not by the nationality of the producer. A Suzuki car factory in Gujarat counts in India’s GDP, not Japan’s. An Infosys office in London counts in UK’s GDP, not India’s.
- Product means only final goods and services are counted. Intermediate inputs are excluded to avoid double counting. Steel sold to a car factory is not counted separately from the car that contains it.
A 2019 Prelims question turned exactly on this distinction between “domestic” and “national.” Mark these three words on your notes.
Three approaches to calculating GDP
GDP can be measured in three theoretically equivalent ways. India’s NSO uses all three, with cross-checks.
1. Expenditure approach
The standard expenditure identity is:
GDP = C + I + G + (X − M)
| Component | Meaning | Indian example |
|---|---|---|
| C | Private Final Consumption Expenditure (PFCE) | Household spending on food, rent, healthcare, transport |
| I | Gross Capital Formation (investment) | Factory construction, machinery, residential housing |
| G | Government Final Consumption Expenditure (GFCE) | Salaries of govt employees, defence spending, public administration |
| X − M | Net exports | IT services exports minus crude oil imports |
2. Production (value-added) approach
The production approach uses Gross Value Added (GVA), which measures the value each sector adds at every stage of production. The bridge between GVA and GDP is:
GDP at market prices = GVA at basic prices + Product taxes − Product subsidies
For FY 2025-26, the GVA mix in India is approximately:
- Services: ~55% (IT, finance, trade, hospitality, public services).
- Industry: ~28% (manufacturing, construction, mining, electricity).
- Agriculture and allied: ~17% (crops, livestock, fisheries, forestry).
Manufacturing has clocked double-digit growth in both FY 2023-24 and FY 2025-26, which is why the NSO highlights it as the resilience driver in its 2026 release. For the full sector breakdown, see our notes on the sectors of the Indian economy.
3. Income approach
The income approach sums all factor incomes earned in the economy:
GDP = Compensation of employees + Operating surplus + Mixed income + Net taxes on production
In theory, the three approaches give the same number. In practice, the NSO publishes a small “discrepancy” line to keep the books balanced.
Nominal GDP vs Real GDP
The nominal-versus-real distinction is the most common Prelims trap on GDP.
| Parameter | Nominal GDP | Real GDP |
|---|---|---|
| Price basis | Current year prices | Base year prices (constant prices) |
| Inflation effect | Included | Removed |
| Best use | Measuring economic size in rupee terms today | Measuring actual growth across years |
| FY 2025-26 | ₹345.47 lakh crore | ₹322.58 lakh crore (constant 2022-23 prices) |
| FY 2025-26 growth | 8.6% | 7.6% |
If prices rise 10% but production stays flat, nominal GDP rises 10% while real GDP shows zero growth. That is why real GDP is the better indicator for comparing performance across years, and the headline number you should quote in any Mains answer.
India’s GDP global ranking in 2026
This is the section that has changed the most since the article was first published, and it is the kind of update that decides Prelims outcomes.
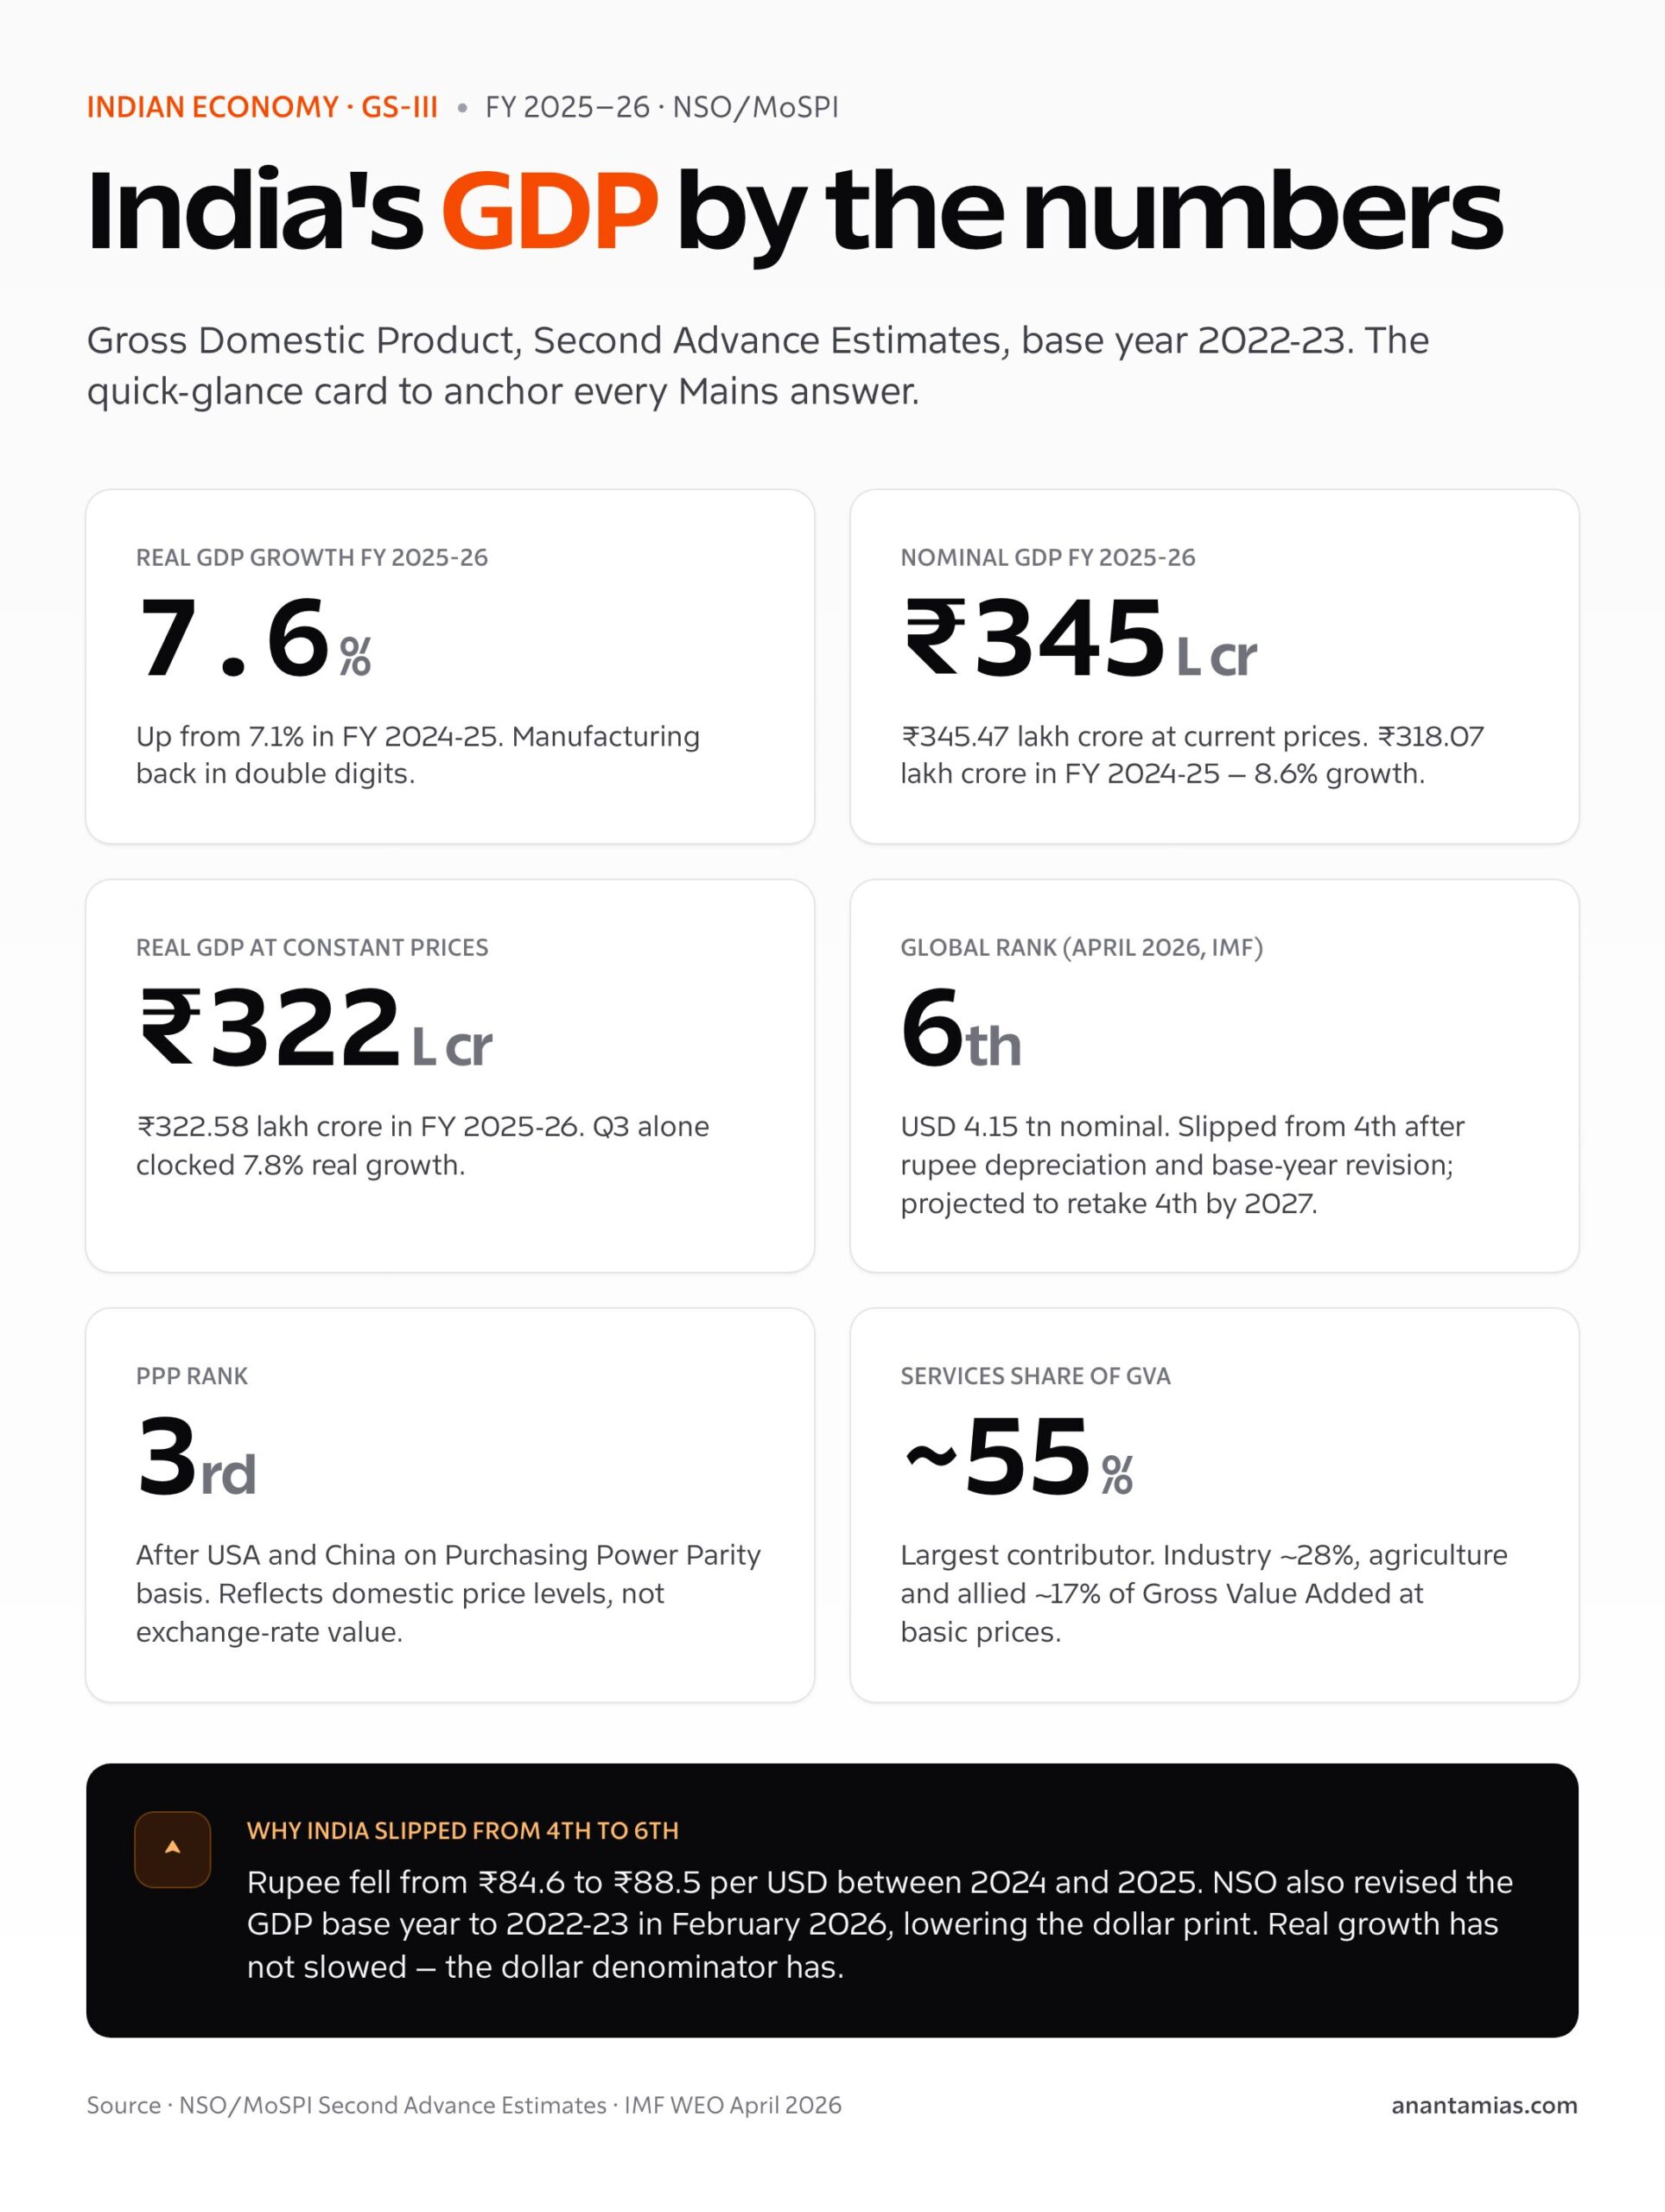
- By nominal GDP, April 2026: India is the 6th-largest economy in the world (USD 4.15 trillion), behind the USA, China, Germany, Japan (USD 4.38 tn) and the UK (USD 4.26 tn). India had briefly held the 4th rank in early 2025 after surpassing Japan; the slip happened mainly because the rupee depreciated from ₹84.6 per USD in 2024 to ₹88.5 per USD in 2025, and because the NSO revised the base year to 2022-23 in February 2026, lowering the dollar print.
- By PPP-adjusted GDP: India remains the 3rd-largest economy, behind China and the USA. PPP corrects for differences in domestic price levels, and India’s domestic basket is much cheaper than its dollar exchange-rate suggests.
- Forward IMF projections: India is forecast to regain the 4th position by 2027 (USD 4.58 tn) and to surpass Japan in 2028 (USD 5.06 tn vs Japan’s USD 4.74 tn).
The lesson for an aspirant is to never quote a global rank without specifying the basis (nominal vs PPP) and the date of the estimate. For deeper context, see our note on the rank of the Indian economy in the world.
GDP at PPP and why it matters
Purchasing Power Parity (PPP) is the exchange rate at which a basket of goods costs the same in two countries. PPP-adjusted GDP is therefore more honest about the actual standard of living a citizen can buy with their income.
- India’s PPP rank: 3rd after the USA and China.
- India’s nominal rank: 6th (April 2026).
- The gap exists because Indian goods and services are priced lower in rupees than the dollar exchange rate would suggest.
- For per-citizen comparisons, look at per capita income rather than aggregate GDP.
GDP deflator and why it differs from CPI
The GDP deflator is the price index used to convert nominal GDP into real GDP.
GDP Deflator = (Nominal GDP / Real GDP) × 100
The GDP deflator is broader than the Consumer Price Index (CPI) because it covers all domestically produced final goods and services, not just a fixed consumer basket. CPI inflation and deflator inflation often diverge because:
- CPI includes imported goods like crude oil and edible oils. The GDP deflator excludes them because they were not produced in India.
- CPI excludes exports. The GDP deflator includes them because exports are produced domestically.
- CPI is a fixed-weight Laspeyres index. The GDP deflator is a Paasche-type implicit deflator that updates weights every period.
UPSC has asked candidates to explain why CPI and GDP deflator can diverge. The answer is the basket. Different baskets, different inflation prints.
India’s GDP growth trends
| Year | Real GDP growth (%) | Note |
|---|---|---|
| 2019-20 | 3.7 | Pre-pandemic slowdown |
| 2020-21 | −6.6 | COVID-19 contraction |
| 2021-22 | 8.7 | Sharp post-pandemic rebound |
| 2022-23 | 7.2 | Manufacturing recovery |
| 2023-24 | 8.2 | Manufacturing in double digits |
| 2024-25 | 7.1 | Revised under new base year |
| 2025-26 (Second Advance Estimate) | 7.6 | Manufacturing again in double digits |
The −6.6% contraction in 2020-21 followed by the 8.7% rebound in 2021-22 is one of the steepest V-shaped recoveries in the world. The 7.6% print for FY 2025-26 keeps India among the fastest-growing major economies.
GDP vs GNP: a clean Prelims distinction
| Parameter | GDP | GNP |
|---|---|---|
| Full form | Gross Domestic Product | Gross National Product |
| Basis | Territorial (within India’s borders) | National (by Indian residents anywhere) |
| Bridge formula | — | GNP = GDP + Net Factor Income from Abroad (NFIA) |
| Includes | Output by all producers within India | Output by Indian nationals worldwide |
| Excludes | Income earned by Indians abroad | Output by foreign producers within India |
The simple rule: If NFIA is positive, GNP > GDP. For India, NFIA has historically been negative because foreigners earn more in India than Indians earn abroad, so GNP < GDP.
GDP vs GVA, NDP, NNP — the full hierarchy
UPSC also asks how GDP relates to other national income aggregates. Keep this ladder in mind:
- GVA at basic prices = output of each sector minus intermediate inputs.
- GDP at market prices = GVA + product taxes − product subsidies.
- NDP at market prices = GDP − depreciation.
- GNP at market prices = GDP + Net Factor Income from Abroad (NFIA).
- NNP at market prices = GNP − depreciation.
- NNP at factor cost = National Income = NNP at market prices − net indirect taxes.
NNP at factor cost is what economists technically call national income. The full ladder is covered in our deep dive on national income accounting.
February 2026 base year revision: what changed
On 27 February 2026, the NSO released a new GDP series with base year 2022-23, replacing the earlier 2011-12 base. Three things shifted:
- Updated weights: sectoral weights now reflect the 2022-23 economy, with services and digital activity weighing more than they did under 2011-12.
- Revised methodology: better integration of CPI, GST data, and corporate filings, in line with the 2008 SNA framework.
- Optical effect on rank: the rupee value of nominal GDP changed slightly, and combined with the rupee’s fall against the dollar, India’s nominal-USD print went down even as real growth held up.
The base year revision is exactly the kind of structural detail UPSC has historically tested. Note both the date (Feb 2026) and the previous base year (2011-12).
Why GDP matters — and why it is not enough
GDP is the workhorse indicator of an economy’s size and short-term trajectory. It still leaves a lot out.
- Income inequality: Two countries with identical GDP can have very different distributions. GDP says nothing about who got the income.
- Unpaid care work: Household labour, subsistence farming for self-consumption, and informal caregiving are largely invisible in GDP.
- Environmental degradation: A polluting factory raises GDP. Cleaning up its damage also raises GDP. The natural-capital loss does not.
- Quality vs quantity of public services: GDP counts spending on health and education, not whether the schools or hospitals are any good.
- Underground economy: Informal and unrecorded activity is not fully captured, especially in agriculture, construction, and trade.
That is why aspirants should always pair GDP with companion indicators in Mains answers:
- HDI (Human Development Index) for health, education, and income together.
- Multidimensional Poverty Index (MPI) for deprivation across health, education, and living standards.
- Green GDP for environmental adjustment.
- Gini coefficient and Palma ratio for inequality.
- Gender Inequality Index and Labour Force Participation Rate for inclusion.
For a focused critique, see our explainer on overestimation in GDP calculation, and on the link with employment via the PM Viksit Bharat Rozgar Yojana.
Historical context: from Kuznets and Naoroji to NSO
The concept of national income accounting was developed by Simon Kuznets in 1937 for the US Congress. The Bretton Woods institutions standardised it after World War II. In India:
- 1867 onwards: Dadabhai Naoroji made the first national-income estimate in Poverty and Un-British Rule in India (1901), driving the famous “Drain Theory.”
- 1949: The National Income Committee was formed under P. C. Mahalanobis, with D. R. Gadgil and V. K. R. V. Rao.
- 1956 onwards: Central Statistical Organisation (CSO) began annual estimates.
- 2015: Shift to base year 2011-12 with the new GDP series, methodology aligned to 2008 SNA, headline measure shifted from “GDP at factor cost” to “GDP at market prices.”
- 2026: Base year shifted to 2022-23. CSO and NSSO functions are now consolidated under NSO/MoSPI.
For the broader macro story, our Indian Economy overview and the chapter map of Ramesh Singh’s Indian Economy are useful companions.
Limitations and alternatives to GDP
A high-scoring Mains answer treats limitations not as decoration but as part of the analysis. Three policy threads to weave in:
- Welfare vs growth: Bhutan’s Gross National Happiness, OECD’s Better Life Index, and the UN’s Beyond GDP agenda all point to the same critique. Growth is necessary but not sufficient.
- Sustainability: The System of Environmental-Economic Accounting (SEEA) framework is the official template for Green GDP. India is building SEEA satellite accounts for water, energy, and forests.
- Equity: Per capita GDP and the Gini coefficient must be read together. India’s GDP rank is 6th nominal, but its per capita income rank is much lower, around 140th globally — a gap that drives most of the policy debate around globalisation and the Indian economy.
FY 2025-26 quarterly trajectory and demand-side breakdown
Reading GDP only as an annual number flattens the story. The quarterly path for FY 2025-26 is the angle that turns a generic answer into a sharp one.
| Quarter | Real GDP growth (YoY, %) | Nominal GDP growth (YoY, %) |
|---|---|---|
| Q1 FY 2025-26 | 7.8 | 8.7 |
| Q2 FY 2025-26 | 8.2 | 9.0 |
| Q3 FY 2025-26 | 7.8 | 8.9 |
| FY 2025-26 (full year, SAE) | 7.6 | 8.6 |
Three things stand out. First, every quarter has stayed above 7.5% real growth. Second, Q3 alone added ₹84.54 lakh crore in real GDP terms, a record print at constant 2022-23 prices. Third, manufacturing has been the strongest contributor on the supply side, with double-digit GVA growth in two of the three quarters.
Demand-side composition
On the expenditure side, the FY 2025-26 mix tells you which engines are firing.
- Private Final Consumption Expenditure (PFCE): still the largest engine at roughly 56% of GDP, supported by rural recovery and services consumption.
- Gross Fixed Capital Formation (GFCF): sustained capex push from the Centre and a slow but steady private capex revival, with capital spending around 32% of GDP.
- Government Final Consumption Expenditure (GFCE): in single digits as a share of GDP, with revenue spending kept on a fiscal-glide-path discipline.
- Net exports (X − M): a small drag on growth, reflecting strong import demand despite a healthy services-export surplus.
The takeaway is structural. Private capex and capital formation are gradually replacing public capex as the marginal driver of growth, which is the inflection most analysts have been waiting for.
Sectoral GVA composition: where the growth comes from
| Sector | Approx. share of GVA (FY 2025-26) | FY 2025-26 GVA growth |
|---|---|---|
| Agriculture, forestry, fishing | ~17% | ~3.8% |
| Manufacturing | ~17% | ~10.5% (double-digit) |
| Mining and quarrying | ~2% | ~5.0% |
| Electricity, gas, water, utilities | ~3% | ~6.7% |
| Construction | ~9% | ~9.0% |
| Trade, hotels, transport, communication | ~18% | ~7.5% |
| Financial, real estate, business services | ~22% | ~7.0% |
| Public administration, defence, other services | ~12% | ~7.5% |
The sector mix has slowly tilted away from agriculture’s share of output, but agriculture still employs nearly 45% of the workforce. That gap between value-added share and employment share is the central productivity puzzle of the Indian economy. For deeper context, see sectors of the Indian economy and our chapter map of Ramesh Singh’s Indian Economy.
Per capita GDP: the rank that tempers the size story
India’s GDP rank says one thing. India’s per capita income rank says another. Both are true, and both belong in the same answer.
- Per capita GDP (nominal, FY 2025-26): roughly USD 2,800, well below the global average.
- Per capita GDP (PPP): roughly USD 11,500, which is closer to the upper-middle-income world.
- Global per capita rank: India sits around 140th out of ~190 economies on nominal per capita GDP.
That is why GDP rank and per capita rank can mislead in opposite directions. India is a giant aggregate economy and a middle-income country at the same time. A Mains answer that uses only one rank will read as half-finished.
State-level: GSDP and the federal angle
India’s national GDP is built from the bottom up. The state-level analogue is Gross State Domestic Product (GSDP), estimated by State Directorates of Economics and Statistics with the NSO’s coordination.
- Largest state economies (FY 2025-26 estimates): Maharashtra, Tamil Nadu, Gujarat, Karnataka, Uttar Pradesh, and West Bengal lead by GSDP size.
- Highest per capita SDP: Goa, Sikkim, Delhi, Karnataka, and Telangana lead, while Bihar, Uttar Pradesh, and Jharkhand sit at the bottom.
- Federal use: The 16th Finance Commission uses GSDP among its devolution criteria. Centrally Sponsored Scheme allocations and state borrowing limits under the FRBM-style fiscal rules are also indexed to GSDP.
State-level numbers matter for centre–state finance, regional inequality, and the convergence question — three of the most testable threads in GS-II and GS-III.
Reading the GDP release calendar
The NSO publishes GDP data in a fixed cadence. Knowing the calendar gives you the right vocabulary in interview rounds.
| Release | Timing | What it covers |
|---|---|---|
| Quarterly Estimates | 2 months after each quarter ends (Aug, Nov, Feb, May) | Real and nominal GDP for that quarter |
| First Advance Estimates (FAE) | Early January | Full-year forecast for the running fiscal year |
| Second Advance Estimates (SAE) | End of February | Revised full-year forecast plus Q3 actuals |
| Provisional Estimates (PE) | End of May | First near-final number for the closed fiscal year |
| First Revised Estimates (FRE) | End of January, next year | First revision after PE, more complete data |
| Second / Third Revised Estimates | Following two Januaries | Final revisions before the number freezes |
The cadence matters because the same year can have a 7.6% print in February and a 7.4% print a year later. Quote the version. The current FY 2025-26 figure of 7.6% is the Second Advance Estimate, released in February 2026.
India compared with peers in 2026
| Country | Real GDP growth 2025 (%) | Nominal GDP 2026 est. (USD tn) |
|---|---|---|
| India | ~7.6 | ~4.15 |
| China | ~4.5 | ~19.5 |
| USA | ~2.0 | ~30.0 |
| Japan | ~0.7 | ~4.38 |
| Germany | ~0.6 | ~4.90 |
| UK | ~1.2 | ~4.26 |
| ASEAN-5 (avg) | ~4.6 | — |
India is growing close to twice as fast as the global average. The gap with China has narrowed, and the gap with the rest of the G7 is now structural. That is the macro backdrop behind the 2027–28 IMF projection that India retakes 4th place by 2027 and surpasses Japan in 2028.
Common GDP misconceptions UPSC tests
The Prelims pattern on GDP often turns on small definitional traps. A few worth pinning to your notes:
- GDP is not a stock, it is a flow. It measures production over a period, not the wealth held at a point in time. National wealth is a different concept entirely.
- GDP at market prices is not the same as GDP at factor cost. Market prices include net indirect taxes; factor cost does not. India’s headline today is GDP at market prices, after the methodology shift in 2015.
- GDP growth is not the same as per capita income growth. If population grows faster than GDP, per capita income can still fall even when aggregate GDP rises.
- Higher GDP does not always mean higher tax revenue. Composition matters. A formal-sector-led expansion lifts tax revenue more than an informal-sector-led one of the same size.
- GDP and exports are not the same. Only net exports (X − M) enter GDP, not gross exports. A high export-to-GDP ratio with an even higher import bill can still mean a small or negative net contribution.
- Negative GDP growth is a recession only with caveats. Two consecutive quarters of contraction is one common rule-of-thumb, but the NBER-style approach in mature economies looks at depth, diffusion, and duration together.
If you keep these traps memorised, the Prelims framing of GDP becomes far more legible. They are also the cleanest one-line corrections to drop into a Mains answer when an examiner expects definitional precision.
UPSC relevance and answer scaffold
| Paper | How GDP appears |
|---|---|
| Prelims GS | GDP full form, GDP vs GNP, GDP vs GVA, GDP deflator vs CPI, base year revision dates, NSO/MoSPI, NFIA |
| Mains GS-III | Growth analysis, fiscal policy, employment-growth linkage, sectoral composition, base-year debates, India’s global rank |
| Mains GS-II | Centre–state finance, Finance Commission devolution based on GSDP, federal fiscal architecture |
| Essay | Growth vs development, beyond-GDP welfare measures, sustainability and inclusion |
A 250-word Mains scaffold on GDP as a measure of welfare
- Definition (1 line): GDP is the total monetary value of final goods and services produced within India’s territory in a year, estimated by the NSO under MoSPI.
- Approaches (1 line): Expenditure (C+I+G+X−M), production (GVA + product taxes − subsidies), and income (sum of factor incomes).
- India today (1–2 lines): Real GDP grew 7.6% in FY 2025-26; nominal GDP at ₹345.47 lakh crore. India ranks 6th by nominal GDP and 3rd by PPP after the rupee’s depreciation and the February 2026 base-year revision.
- Strengths: Widely understood, comparable across countries, anchors fiscal and monetary policy.
- Limits (3–4 lines): Ignores distribution, environment, unpaid work, and quality of public services.
- Alternatives: HDI, MPI, Green GDP, Gini coefficient, Beyond-GDP indicators.
- Conclusion: GDP remains essential but not sufficient. A development-state today must read GDP alongside HDI, MPI, and environmental accounts to govern for inclusive and sustainable growth.
Key takeaways
- The GDP full form is Gross Domestic Product — the monetary value of all final goods and services produced within India’s territory during a period.
- Three calculation approaches: expenditure, production (GVA), and income.
- FY 2025-26: nominal GDP ₹345.47 lakh crore, real GDP ₹322.58 lakh crore at constant 2022-23 prices, real growth 7.6%.
- Global rank (April 2026): 6th by nominal GDP, 3rd by PPP. IMF projects 4th place by 2027 and ahead of Japan by 2028.
- Base year: revised to 2022-23 by NSO in February 2026, replacing 2011-12.
- GDP is essential but incomplete: pair with HDI, MPI, Green GDP, and Gini for a full welfare picture.
Frequently asked questions
What is the full form of GDP?
The GDP full form is Gross Domestic Product. It is the total monetary value of all final goods and services produced within a country’s domestic territory during a given period, usually a financial year or a quarter.
Who calculates India’s GDP?
India’s GDP is officially estimated by the National Statistical Office (NSO) under the Ministry of Statistics and Programme Implementation (MoSPI). The NSO releases First Advance, Second Advance, Provisional, and First Revised estimates each year.
What is India’s GDP for FY 2025-26?
Per the Second Advance Estimates released by NSO in 2026, India’s nominal GDP for FY 2025-26 is ₹345.47 lakh crore, with real GDP at ₹322.58 lakh crore at constant 2022-23 prices and real growth of 7.6%.
What is the difference between nominal and real GDP?
Nominal GDP is measured at current prices, so it includes inflation. Real GDP is measured at base-year (constant) prices, so the inflation effect is stripped out. Real GDP is the better indicator of actual growth across years.
What is India’s GDP global ranking in 2026?
Per the IMF World Economic Outlook (April 2026), India is the 6th-largest economy by nominal GDP at USD 4.15 trillion, behind the USA, China, Germany, Japan, and the UK. By PPP-adjusted GDP, India is the 3rd-largest after China and the USA. The IMF expects India to retake 4th place by 2027 and surpass Japan in 2028.
Why did India slip from 4th to 6th in IMF GDP rankings?
Two reasons. First, the rupee depreciated from ₹84.6 per USD in 2024 to ₹88.5 per USD in 2025, lowering India’s GDP when converted to dollars. Second, the NSO revised the GDP base year from 2011-12 to 2022-23 in February 2026, with a small downward adjustment to nominal output. India’s real growth has not slowed.
What is the difference between GDP and GNP?
GDP is measured by territory — output produced within India’s borders, regardless of producer nationality. GNP is measured by nationality — output produced by Indian residents anywhere in the world. The bridge is GNP = GDP + Net Factor Income from Abroad (NFIA). For India, NFIA is typically negative, so GNP is slightly less than GDP.
What is the GDP deflator and how is it different from CPI?
The GDP deflator is the price index used to convert nominal GDP into real GDP. It covers all domestically produced final goods and services. CPI covers a fixed basket of consumer goods and services. CPI includes imports like crude oil but excludes exports; the GDP deflator does the opposite. That is why their inflation prints can diverge in the same year.
What are the limitations of GDP as a measure of welfare?
GDP does not capture income inequality, unpaid care work, environmental damage, the quality of public services, or the underground economy. A polluting factory raises GDP, while household labour and subsistence farming for self-consumption are largely invisible. That is why HDI, the Multidimensional Poverty Index, the Gini coefficient, and Green GDP are used alongside GDP.
When did India revise its GDP base year to 2022-23?
On 27 February 2026, the NSO released a new GDP series with base year 2022-23, replacing the earlier 2011-12 base. The methodology was aligned to the 2008 SNA framework, with updated sectoral weights and better integration of GST, CPI, and corporate filings data.
Tell Google you want more of this.
Add Anantam IAS as a preferred sourceOne tap, and this site shows up more often in your own Top Stories, AI Overviews and AI Mode. Remove it any time.