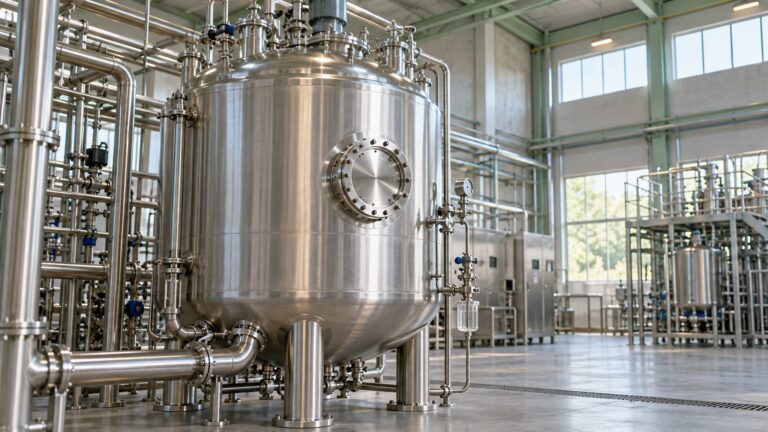
The LEADS 2025 Report, the seventh annual Logistics Ease Across Different States exercise, has placed state logistics performance back at the center of India’s competitiveness conversation. Released by the Department for Promotion of Industry and Internal Trade on May 13, 2026, the report assesses all 36 states and union territories on a four-pillar framework covering infrastructure, services, operational ease, and regulatory environment. Its findings shape how investors read state-level logistics, how the Centre allocates capital expenditure under PM Gati Shakti, and how the National Logistics Policy translates into measurable outcomes.
LEADS sits in a small but powerful family of Indian state ranking exercises that includes the Ease of Doing Business Reform Action Plan, the State Energy Efficiency Index, and the SDG India Index. Like its peers, LEADS uses a competitive federalism logic: rank states, publicize results, and let political and investor incentives drive improvement. Unlike most peers, LEADS relies heavily on perception surveys of logistics users, which gives it sensitivity to operational reality but also exposes it to methodological debate.
For UPSC, the LEADS 2025 Report is a versatile asset. It anchors GS Paper 3 questions on infrastructure and economy, GS Paper 2 questions on cooperative and competitive federalism, and prelims questions on government reports and ranking indices. The report’s link to PM Gati Shakti and the National Logistics Policy makes it especially useful in mains essays on infrastructure and trade.
Quick Facts
- Released by: Department for Promotion of Industry and Internal Trade (DPIIT), Ministry of Commerce and Industry
- Edition: Seventh, covering financial year 2024-25
- Release date: May 13, 2026
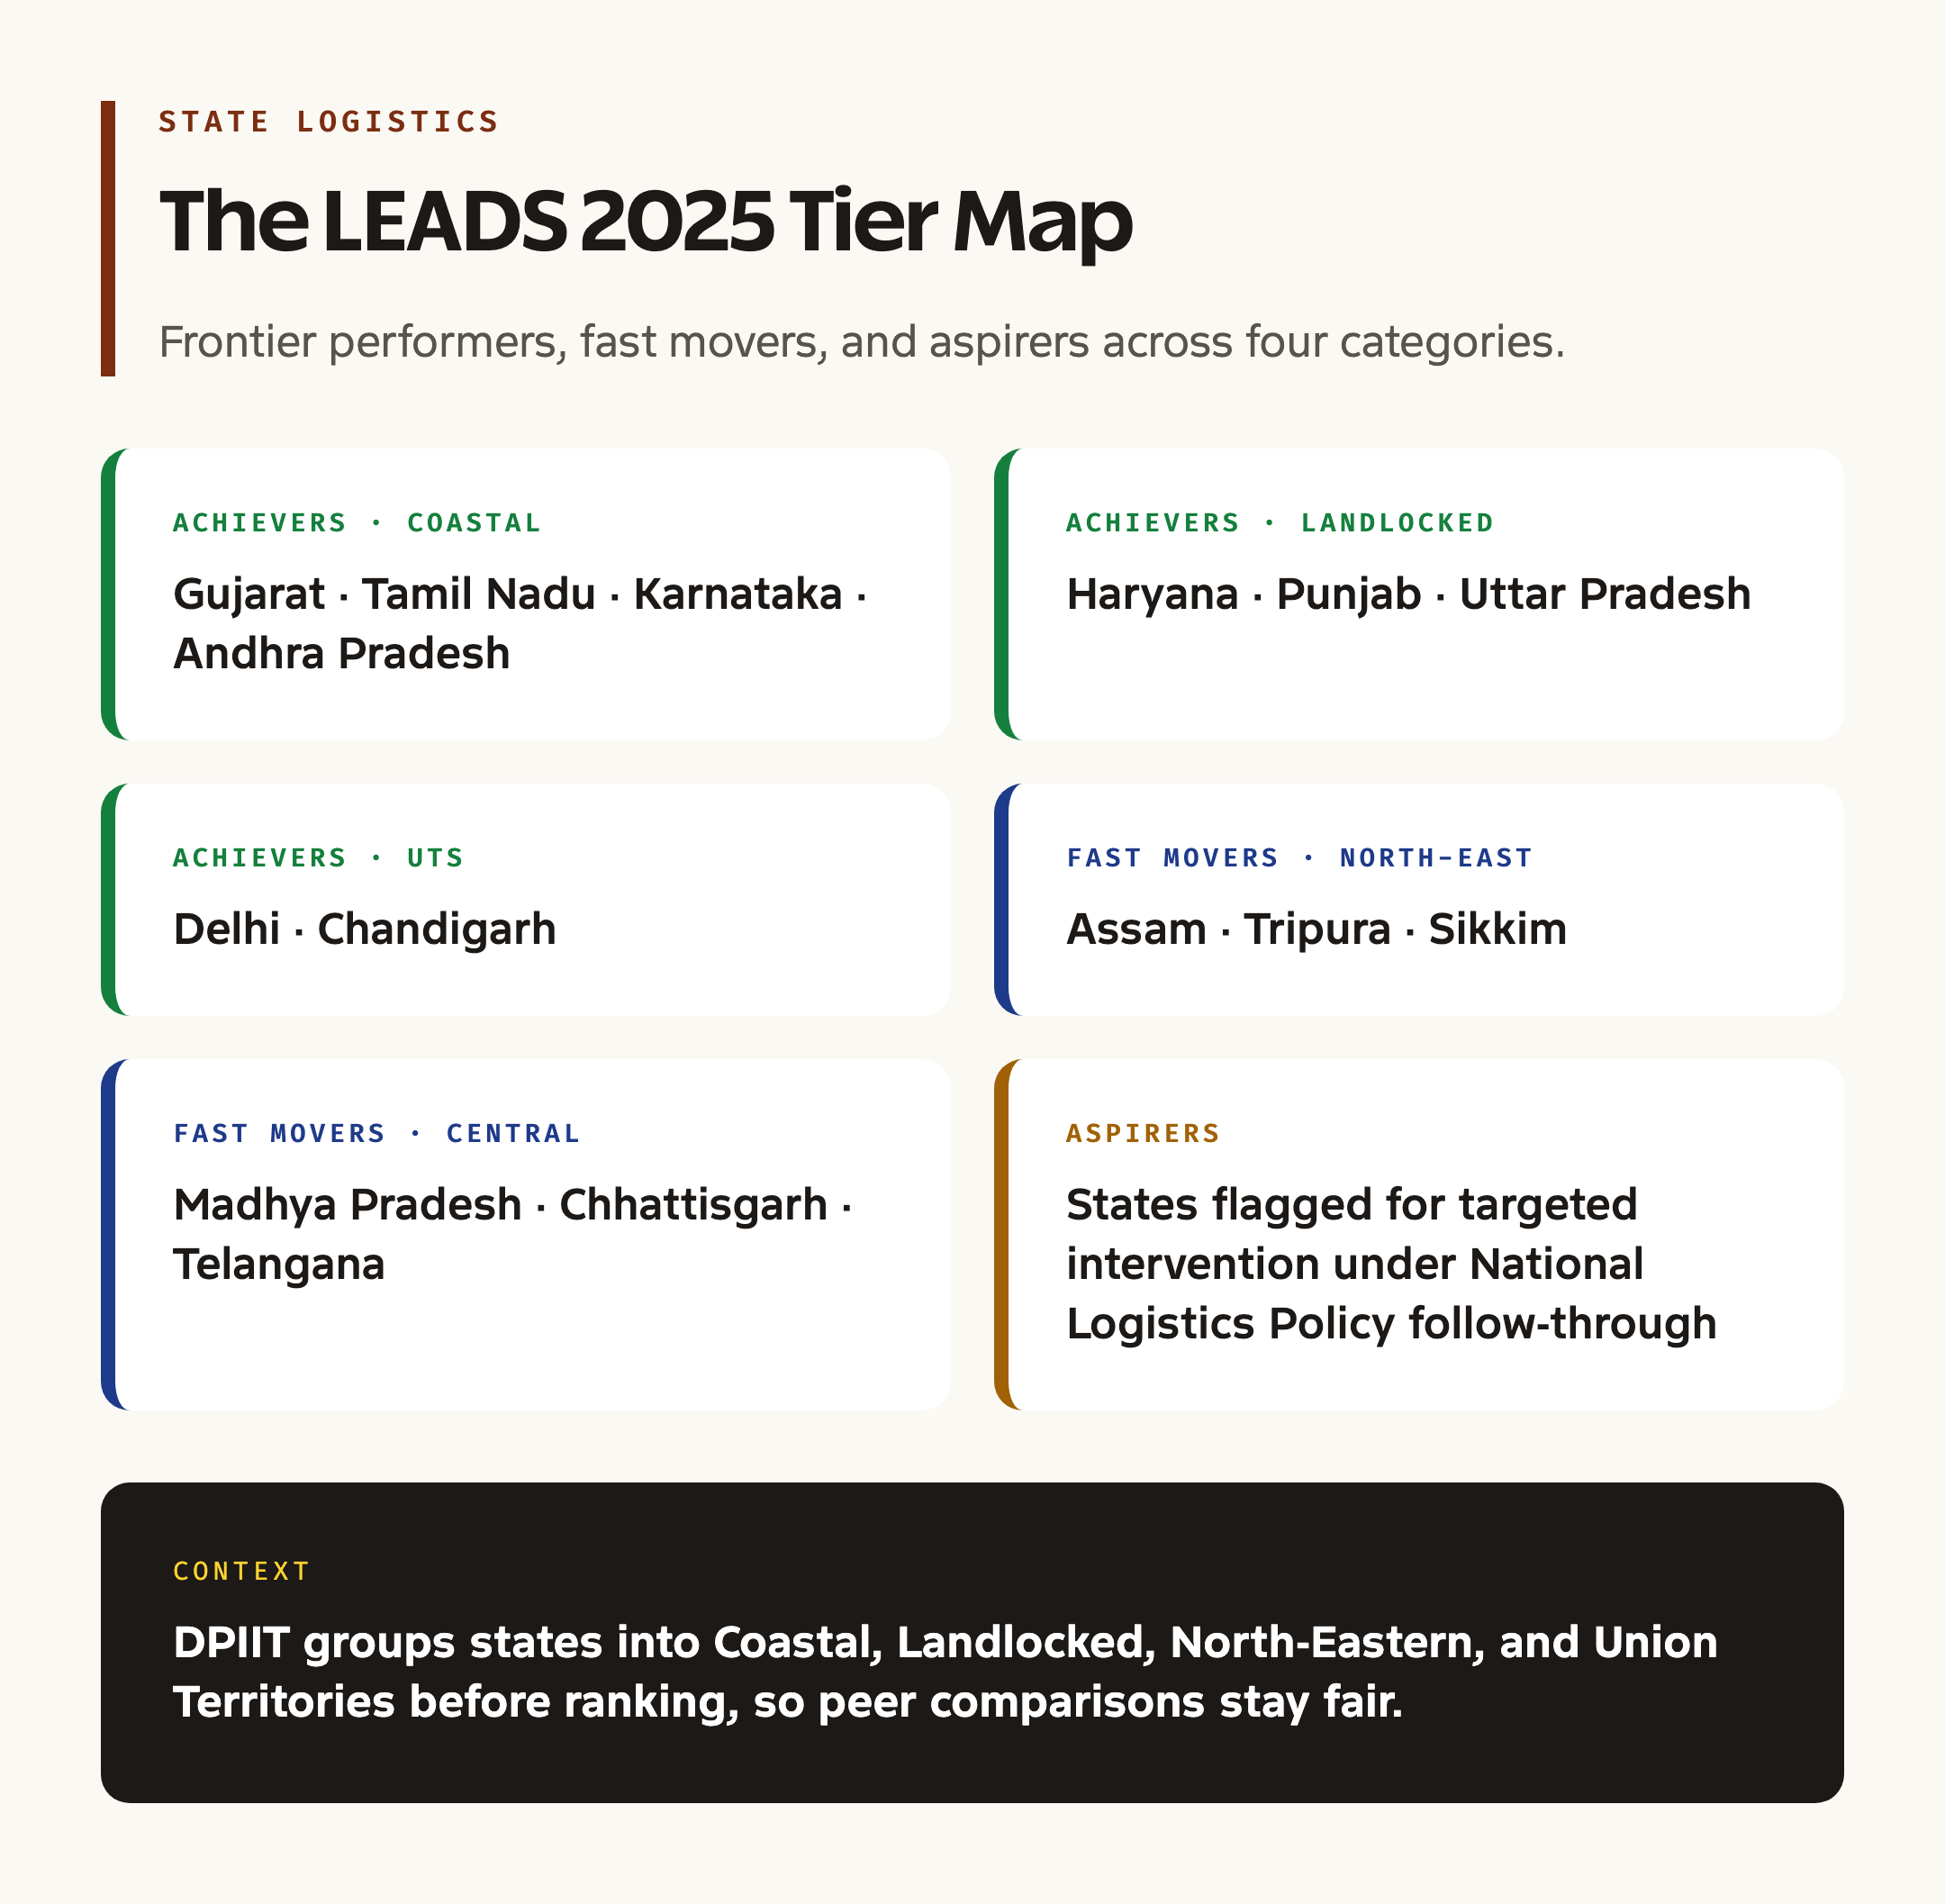
- Coverage: All 36 states and union territories grouped into Coastal, Landlocked, North-East, and Union Territories categories
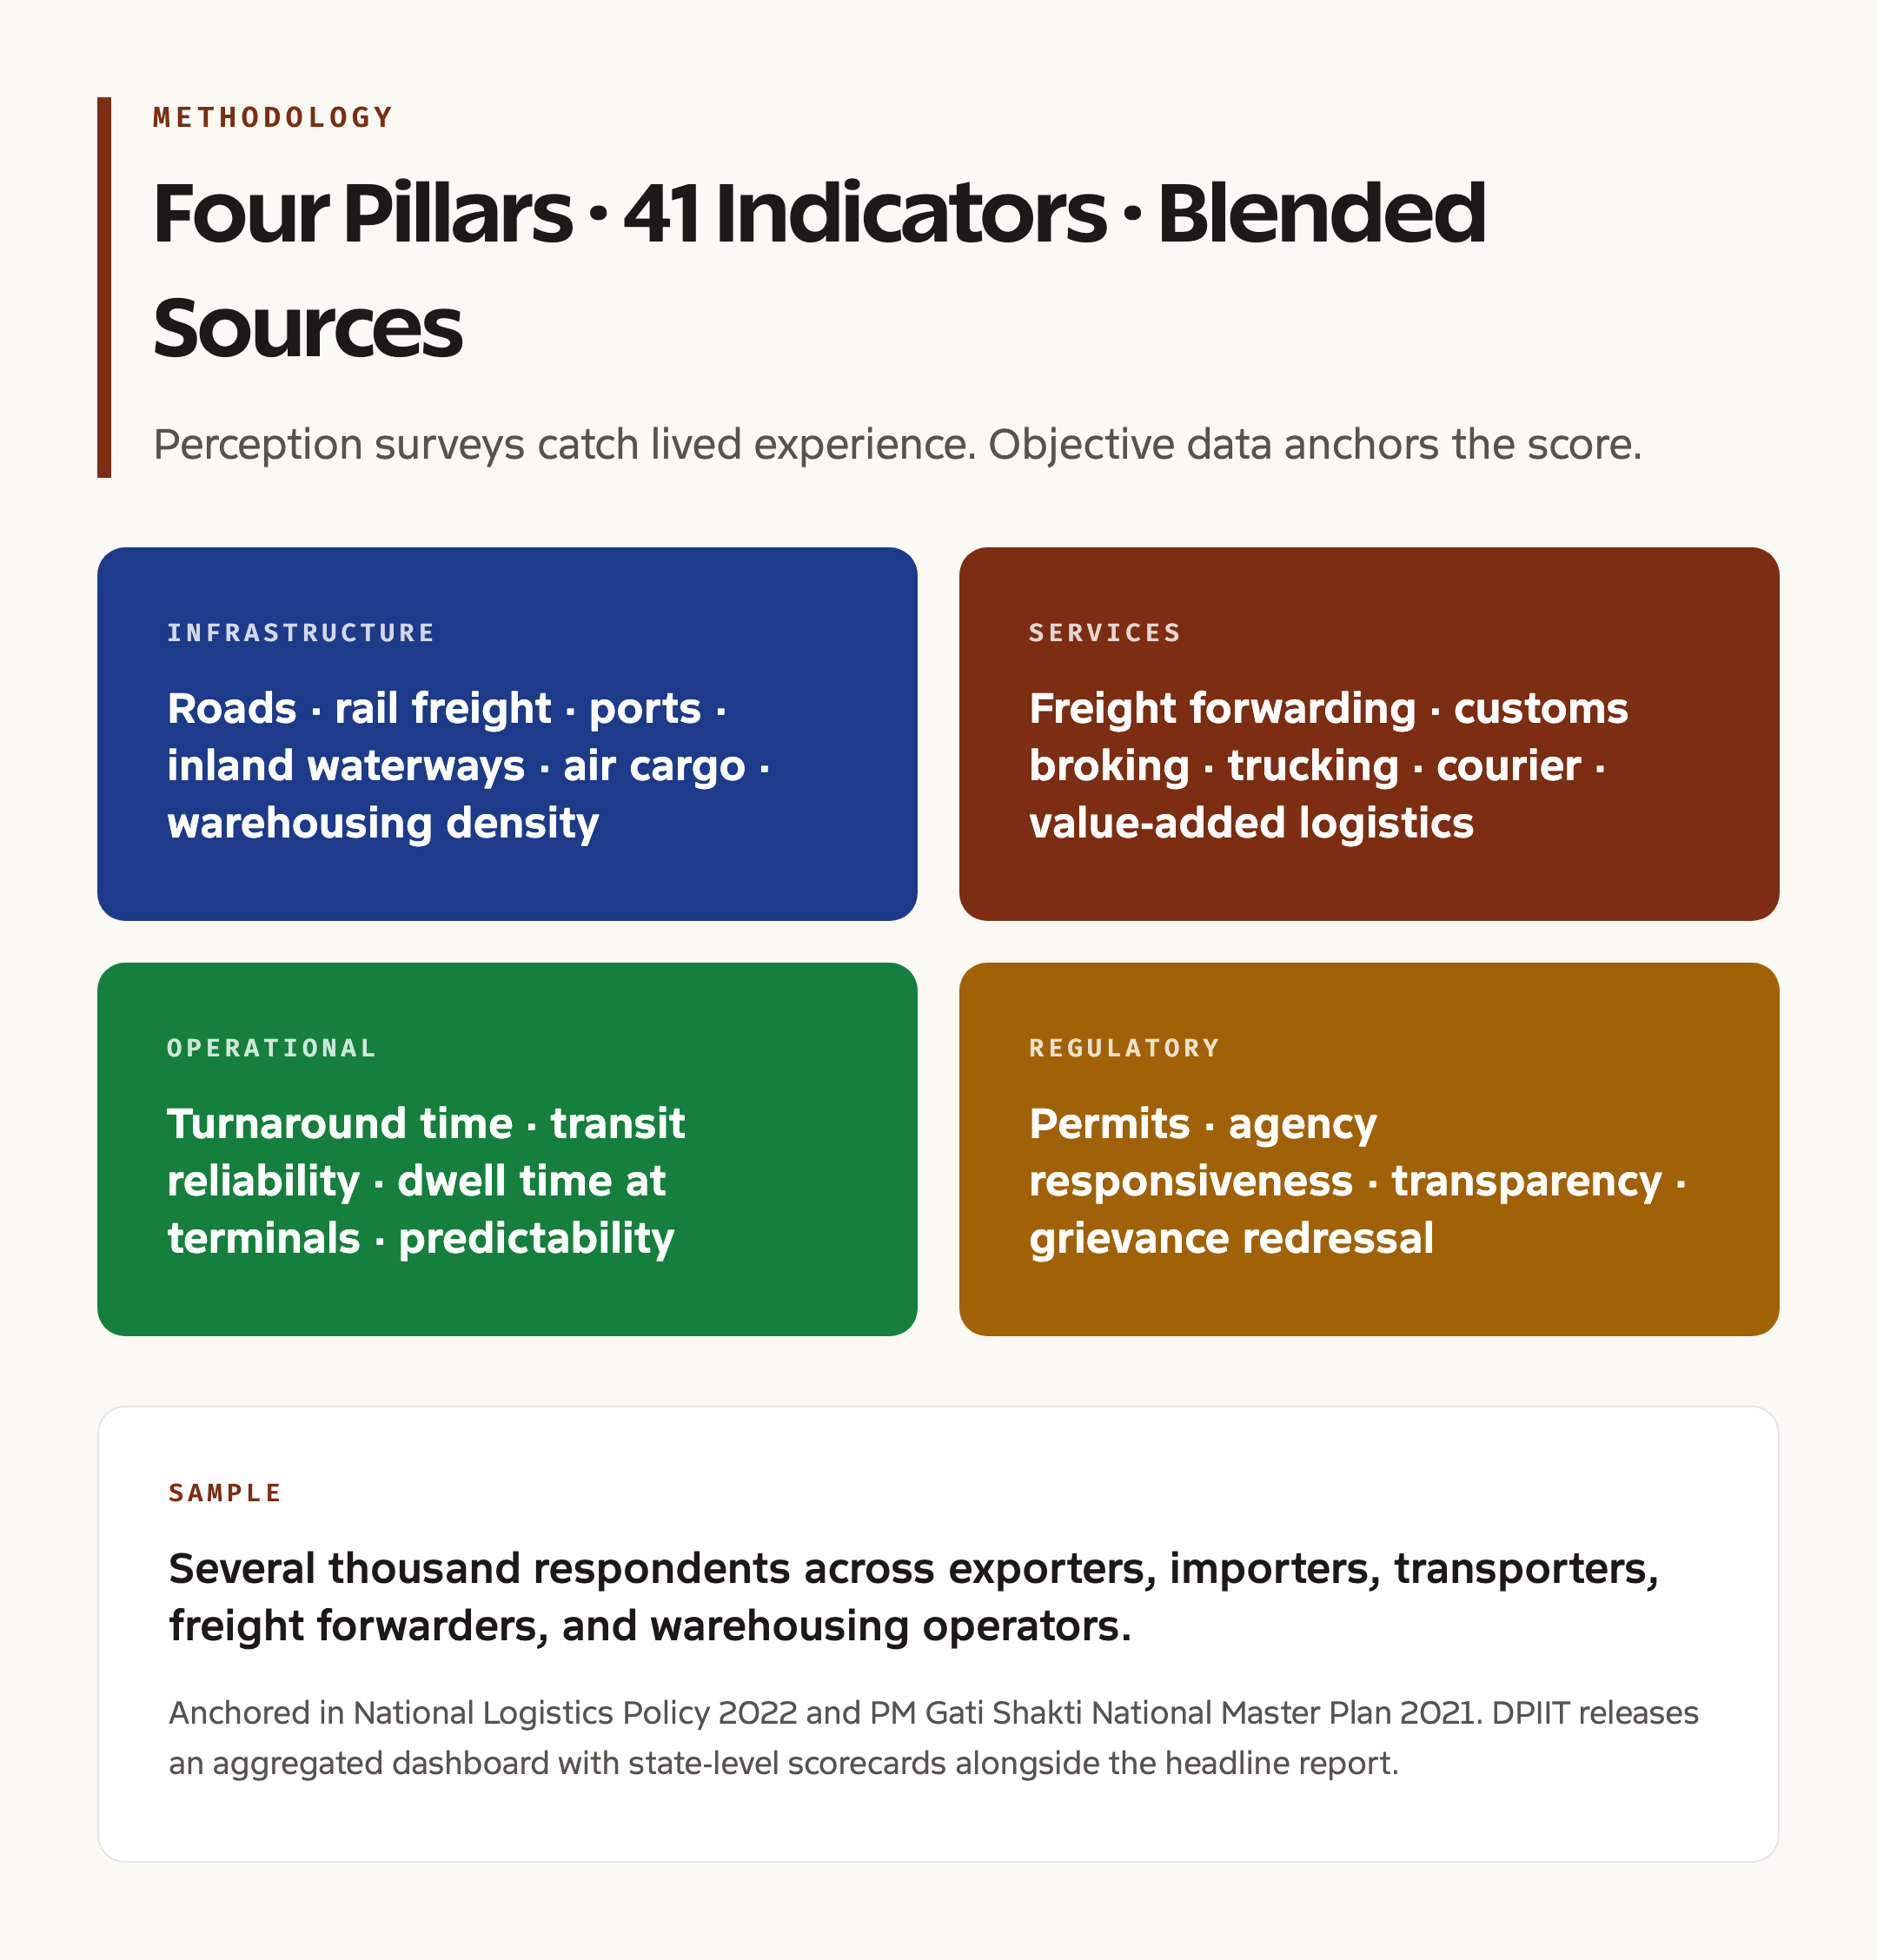
- Methodology: 41 indicators across four pillars, blending stakeholder perception surveys with objective data
- Tiers: Achievers, Fast Movers, Aspirers, with the highest tier identifying frontier performers in each category
- Anchored in: National Logistics Policy 2022 and PM Gati Shakti National Master Plan launched in 2021
- Sample: Several thousand respondents across exporters, importers, transporters, freight forwarders, and warehousing operators
What Just Happened
The seventh edition of LEADS extends the methodology refined since the 2018 launch and adds a sharper read on multimodal corridors. The Department for Promotion of Industry and Internal Trade released the report along with a state-level scorecard, an aggregated dashboard, and a set of recommendations for laggard states.
Achievers in the Coastal States category include Gujarat, Tamil Nadu, Karnataka, and Andhra Pradesh, reflecting deep port infrastructure, dense industrial clusters, and improving last-mile connectivity. In the Landlocked category, Haryana, Punjab, and Uttar Pradesh lead, helped by inland container depots, expressway networks, and proximity to the Delhi-Mumbai and Eastern Dedicated Freight Corridors. Among Union Territories, Delhi and Chandigarh dominate the Achievers tier.
The North-East has been a focus of LEADS attention since the third edition. Assam, Tripura, and Sikkim are flagged as Fast Movers, with the report attributing gains to the Bharatmala Pariyojana, Saubhagya power coverage, and the multi-modal Brahmaputra waterway investments under Inland Waterways Authority of India.
Beyond rankings, the 2025 edition identifies systemic gaps. Average truck turnaround time at major ports has improved but remains above global benchmarks. Warehousing capacity is concentrated in eight to ten states. Digital integration across state-level logistics agencies is uneven, with some states fully linked to the National Logistics Portal Marine and others outside it.
The report also previews a methodology refresh planned for the eighth edition, including expanded coverage of cold chain logistics, e-commerce last-mile performance, and air cargo ecosystem readiness.
Background and Historical Context
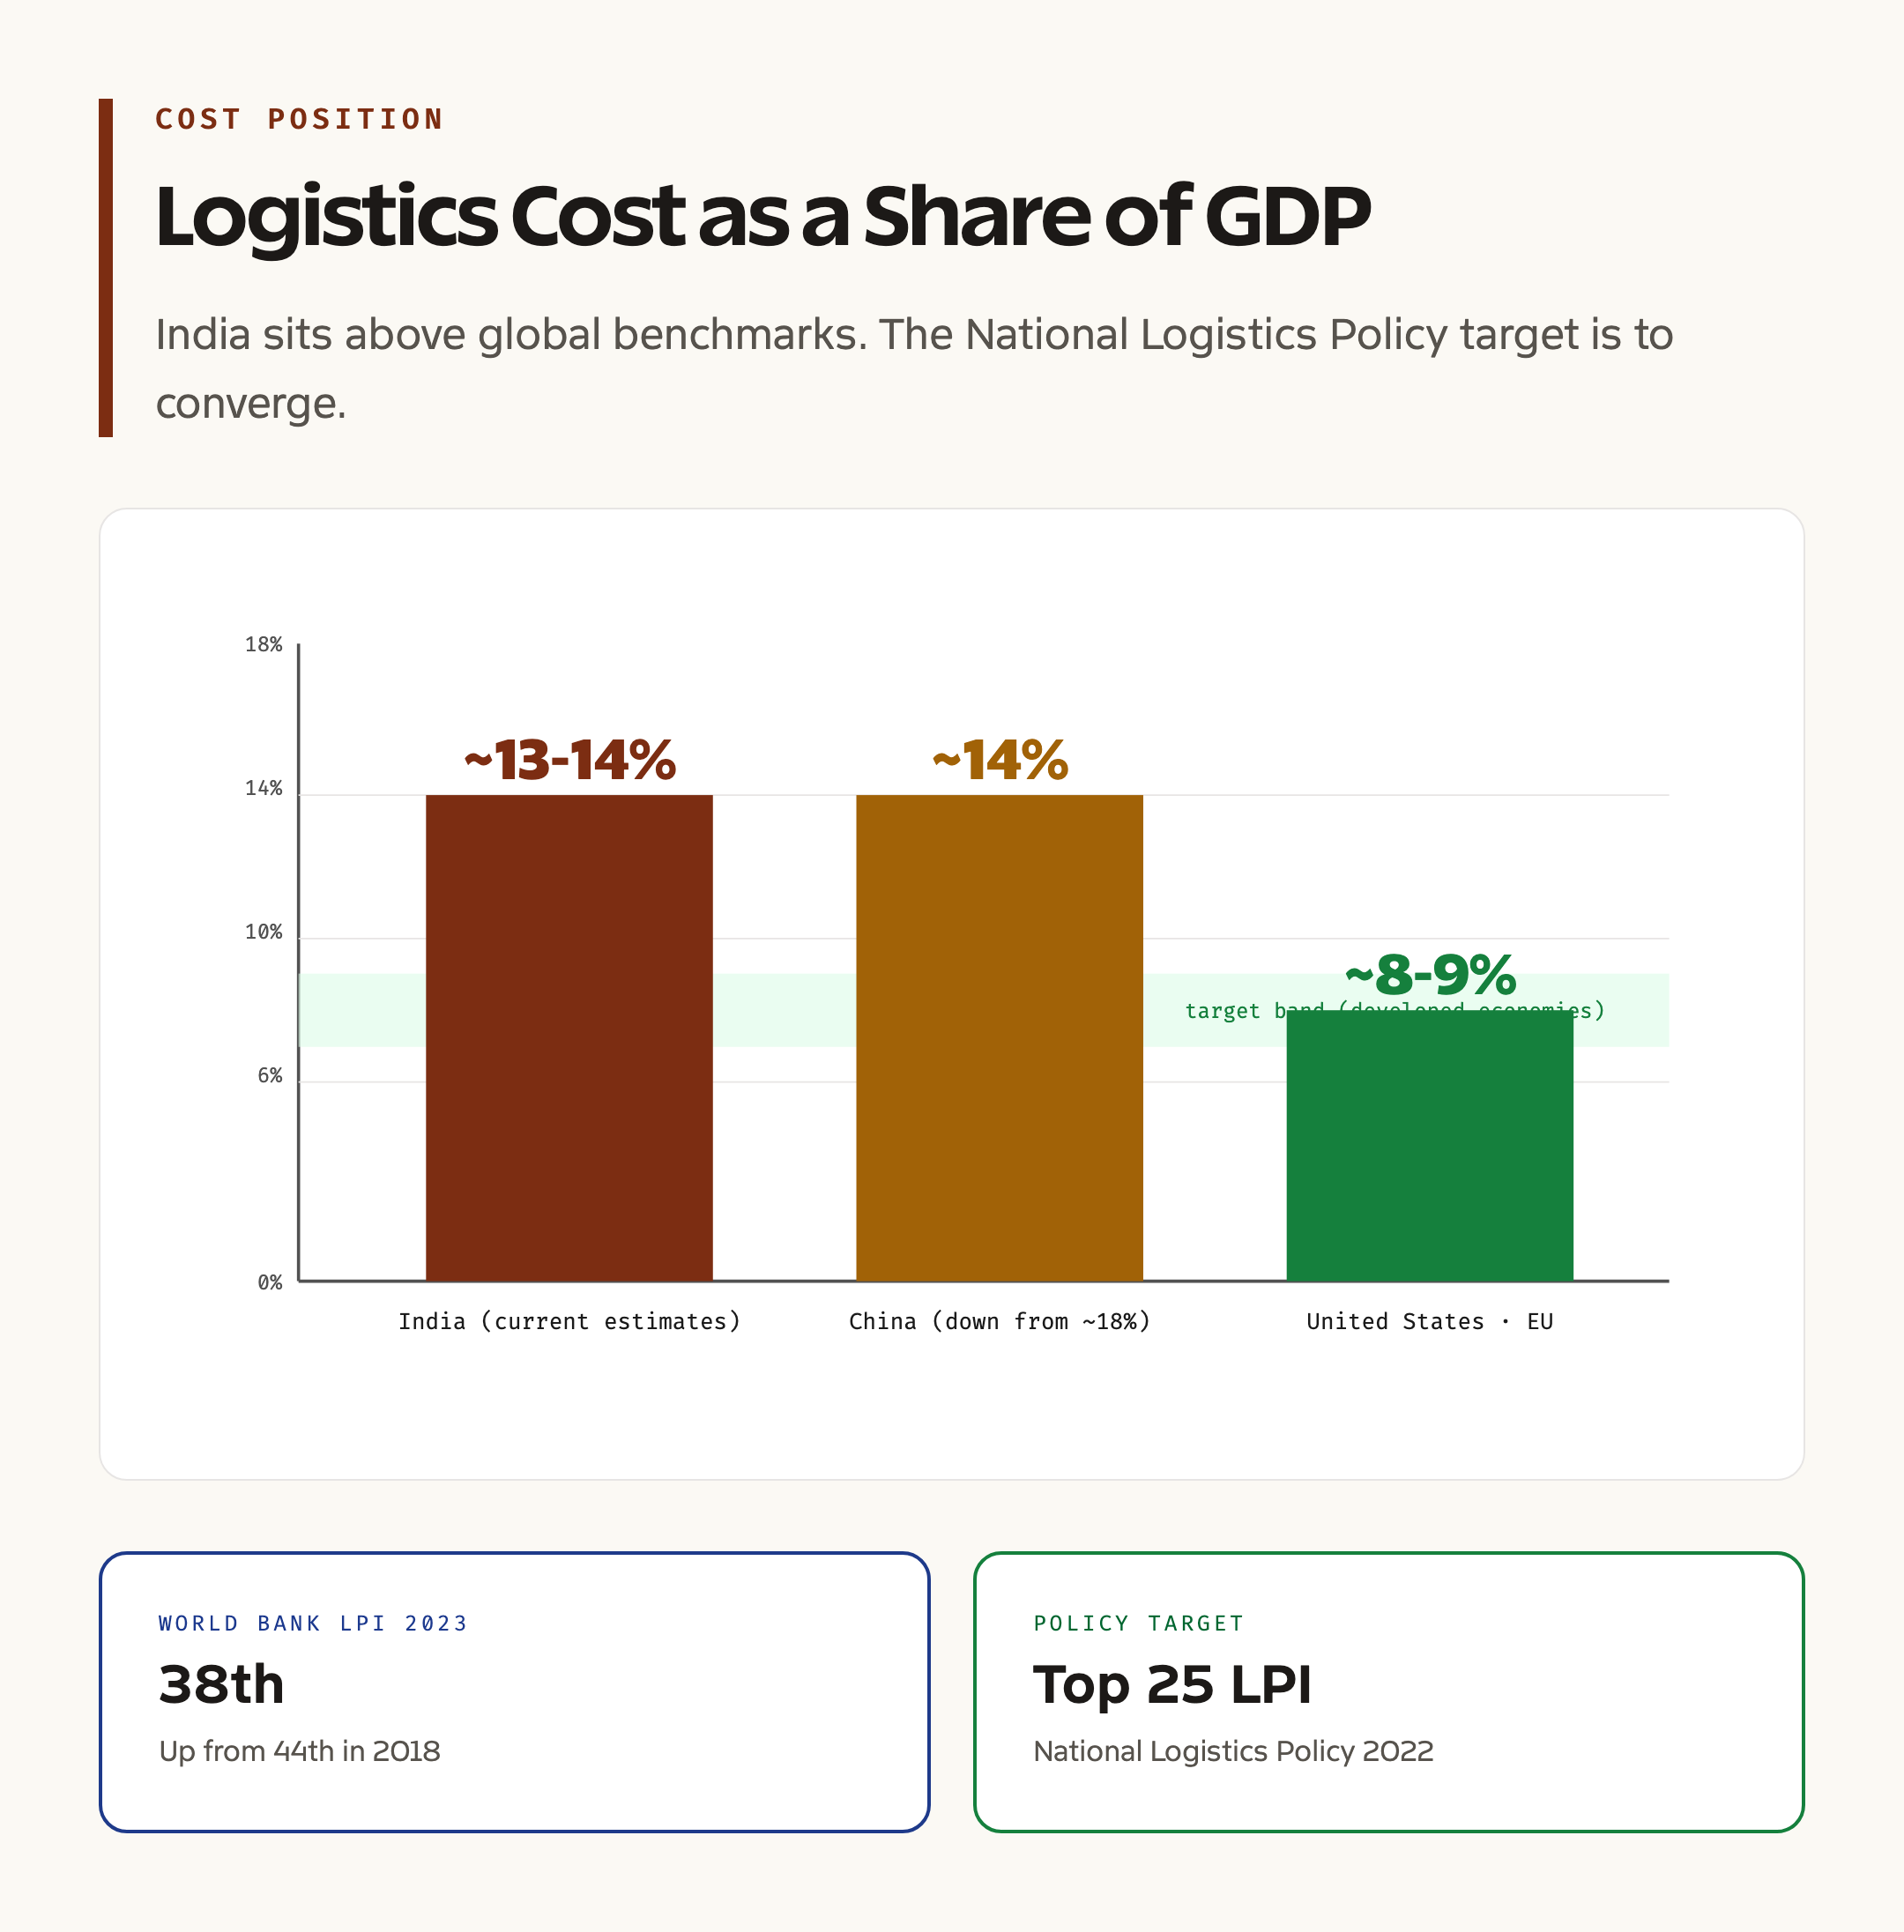
India’s logistics policy story has been a slow climb. The 1991 reforms opened trade and unleashed demand for moving goods, but logistics infrastructure lagged. Through the 1990s and 2000s, logistics costs as a share of GDP stayed elevated relative to peer economies, with multiple government and industry estimates placing them in the range of 13 to 14 percent. International benchmarks for developed economies sit closer to 8 to 9 percent.
The first comprehensive policy push came through the Ministry of Commerce and Industry establishing a Logistics Division in 2017. This was followed by the launch of the National Logistics Portal in 2020, the PM Gati Shakti National Master Plan in October 2021, and the National Logistics Policy in September 2022. Together, these formed the most ambitious institutional architecture India has built around logistics.
LEADS launched in 2018 as a state-level supplement to the broader policy push. The first edition was a relatively simple benchmarking exercise. Each subsequent edition refined methodology, expanded indicators, added categorical groupings, and deepened the survey sample. By the fifth edition in 2022, LEADS had become a standard reference in state-level investor briefings.
PM Gati Shakti is the structural backbone for cross-ministerial logistics coordination, and the broader policy logic is captured in earlier analysis of the Gati Shakti master plan benefits and challenges and the deeper logistics sector constraints and challenges review. It is a GIS-enabled digital platform that maps 36 central ministries and 36 states onto a single visualization, with infrastructure assets, project plans, and economic clusters layered together. The aim is to reduce project delays, avoid duplication, and synchronize utility planning. LEADS reads state performance partly through how well states use Gati Shakti tools.
The National Logistics Policy 2022 sets four central targets. Reduce logistics cost as a share of GDP to be comparable with global benchmarks. Improve India’s Logistics Performance Index rank to among the top 25. Create a unified logistics interface platform. Build robust data-driven decision support across the sector. LEADS reports progress on these targets at the state level.
Key Provisions and Methodology
LEADS scores states across four pillars. The Infrastructure pillar captures quality of roads, rail freight ecosystem, port and inland waterways access, air cargo facilities, and warehousing density. The Services pillar covers freight forwarding, customs broking, trucking services, courier and parcel networks, and value-added logistics services like packaging.
The Operational pillar tracks turnaround times, transit reliability, dwell times at terminals, and how predictable the end-to-end movement is for shippers. The Regulatory pillar evaluates ease of obtaining permits, the responsiveness of state logistics agencies, transparency in regulations, and quality of grievance redressal.
The 41 indicators draw from a combination of stakeholder perception surveys, objective administrative data, and Gati Shakti dashboard inputs. The blend matters. Perception surveys catch what users actually experience and reduce the chance that nominally well-performing states ignore on-the-ground bottlenecks. Objective data ensures the index is not dominated by sentiment.
States are grouped into four categories to enable fair comparison. Coastal States include states with major sea-port access. Landlocked States are those without ocean coastline. North-Eastern States are grouped together to reflect shared topographical and connectivity challenges. Union Territories form the fourth category.
Within each category, states are placed in tiers. Achievers are top performers operating at the frontier. Fast Movers have shown meaningful year-on-year improvement. Aspirers are states that need targeted intervention to catch up. The tier nomenclature is identical to NITI Aayog’s tier language in other indices.
Why It Matters
Logistics performance is one of the most consequential determinants of state competitiveness. Investment location decisions for manufacturing, especially under the Production Linked Incentive schemes, depend heavily on access to ports, freight corridors, and reliable last-mile transport. LEADS findings feed directly into how state investment promotion agencies pitch themselves.
For exporters, every percentage point of logistics cost saved translates into a margin gain that can be redeployed into product, market expansion, or pricing. India’s exporters operate on thinner logistics margins than peers in Vietnam or Thailand. Closing that gap matters disproportionately for labor-intensive sectors like textiles, leather, and engineering.
For consumers, logistics performance shapes price levels and product availability. Cold chain weakness explains why fresh produce prices spike sharply between harvest and consumption. Warehousing density gaps explain why e-commerce delivery in tier-3 and tier-4 cities lags metros by several days.
For state governments, LEADS rankings are political. Parallels run to debates about micro-irrigation initiatives challenges and way forward where competitive state performance has shaped Central scheme outcomes. A jump from Aspirer to Fast Mover, or Fast Mover to Achiever, is celebrated in state budget speeches. A drop reverses the narrative. This creates a useful pressure for state-level reform that pure top-down policy cannot generate on its own.
For the Centre, LEADS provides a basis for differentiated allocation under Gati Shakti and capital outlay. States with weaker logistics performance can be prioritized for targeted infrastructure, while frontier states can be templated for replication.
Detailed Analysis of Top Performers and Lessons
Gujarat’s leadership across the Coastal States category combines deep port infrastructure, a dense industrial corridor on the Delhi-Mumbai Industrial Corridor route, and a state-level Logistics Park policy that has crowded in private warehousing. The state’s electronic permit and single-window systems have substantially reduced regulatory friction.
Tamil Nadu’s performance reflects a different model. It anchors on multiple medium-sized ports rather than one giant terminal, has dense automotive and electronics clusters that drive specialized logistics services, and benefits from continuous infrastructure investment over multiple state governments. Tamil Nadu’s freight corridor planning is among the most disciplined in the country.
Haryana’s lead among Landlocked States is rooted in the Delhi-Mumbai Industrial Corridor passing through it, the Western Dedicated Freight Corridor’s Haryana segments, and concentration of multimodal logistics parks around Manesar, Rewari, and Faridabad. Its proximity to Delhi as a consumer market is structural.
Punjab and Uttar Pradesh’s positioning shows the Dedicated Freight Corridor effect. Both states sit on the Eastern Corridor route, and freight volumes have responded quickly. Uttar Pradesh’s emergence as a logistics geography also reflects expressway investments including the Purvanchal and Bundelkhand expressways.
The North-East story is incremental but real. Assam’s port and waterway investments on the Brahmaputra, the opening of additional border trade points with Bangladesh and Myanmar, and the expansion of air cargo through Guwahati have all moved indicators positively. Tripura’s role as a transshipment node for Bangladesh trade is growing.
Comparative Lens: India in Global Logistics
The World Bank’s Logistics Performance Index ranks India 38th in its 2023 release, an improvement from 44th in 2018, but still behind major peer economies. India’s strongest sub-component is international shipments, while customs and timeliness lag. LEADS-style state-level granularity is rare globally, with most countries assessing logistics performance at national level only.
China’s logistics cost as a share of GDP has fallen from over 18 percent two decades ago to roughly 14 percent today through systematic investment in expressways, high-speed rail freight, and port consolidation. India’s trajectory is similar but on a different timeline.
The European Union and the United States operate at logistics costs in the 8 to 9 percent range, reflecting mature infrastructure, decades of corridor consolidation, and dense intermodal hubs. India’s target under the National Logistics Policy to converge with these benchmarks is ambitious and depends on sustained capital outlay.
ASEAN economies have made LEADS-like exercises increasingly common as part of investment promotion. Vietnam, Thailand, and Indonesia all run state or provincial logistics assessments. India’s LEADS is among the most methodologically developed in the region and is studied by peer countries as a reference.
Challenges and Limitations
Methodological dependence on perception surveys is the most cited critique. Survey responses can be biased by recent experience, by who the respondents are, and by selection in who agrees to participate. The DPIIT has expanded sample sizes and weighting techniques each year, but some bias is structural.
Coverage gaps remain. Specialized logistics like cold chain, hazardous materials, and air cargo are unevenly captured. The 2025 edition flags this and announces deeper coverage in the next edition.
State-level data fragmentation is real. Several states do not yet feed comprehensive logistics data into the National Logistics Portal or PM Gati Shakti. Without this, the objective layer of LEADS underweights some categories of activity.
The federal policy disconnect is a deeper issue. Many logistics interventions sit with state agencies that report to different ministries, with little vertical coordination. LEADS can identify the gaps but cannot solve them without political alignment.
Climate adaptation is largely missing from current LEADS pillars. Floods in Chennai, Hyderabad, and Bengaluru have repeatedly disrupted port and warehousing operations. As climate volatility grows, logistics resilience needs explicit measurement and weighting.
Prelims Pointers
- LEADS is published by the Department for Promotion of Industry and Internal Trade under the Ministry of Commerce and Industry
- The seventh edition was released on May 13, 2026
- PM Gati Shakti National Master Plan was launched on October 13, 2021
- The National Logistics Policy 2022 was launched on September 17, 2022
- India’s rank in the World Bank Logistics Performance Index 2023 is 38
- The four LEADS pillars are Infrastructure, Services, Operational, and Regulatory
- LEADS classifies states into Coastal, Landlocked, North-Eastern, and Union Territories categories
- States are ranked into Achievers, Fast Movers, and Aspirers tiers
- The Dedicated Freight Corridor Corporation of India operates the Eastern and Western Dedicated Freight Corridors
Mains Questions
- “PM Gati Shakti and the National Logistics Policy form a complementary architecture for closing India’s logistics performance gap.” Examine this proposition using LEADS 2025 findings. (GS Paper 3, 15 marks)
- Discuss how state-level competitive federalism, anchored by indices like LEADS, has reshaped India’s infrastructure and policy environment. What are the limits of this approach? (GS Paper 2, 15 marks)
- India aims to bring logistics costs as a share of GDP in line with global benchmarks. Identify the structural bottlenecks and outline a sectoral roadmap drawing on LEADS findings. (GS Paper 3, 10 marks)
- Evaluate the role of multimodal corridors and Dedicated Freight Corridors in transforming India’s logistics geography. Discuss the regional impacts using examples from LEADS 2025. (GS Paper 3, 10 marks)
Way Forward
Deepening LEADS methodology is the immediate priority. The eighth edition should embed cold chain, e-commerce last mile, air cargo, and climate resilience indicators. Sample sizes should grow further, and the survey instrument should disaggregate by shipper size to capture MSME experience.
Closing the data integration gap requires every state to fully onboard onto PM Gati Shakti and the National Logistics Portal. The Centre can incentivize this through performance-linked capital grants tied to data coverage.
Cooperative arrangements between adjacent states need clearer institutional anchoring. The Delhi-Mumbai Industrial Corridor and the Chennai-Bengaluru Industrial Corridor show what is possible when states align. Replicating this around the Eastern and Western Dedicated Freight Corridors needs dedicated coordination structures.
Climate-resilient infrastructure investment must be embedded in Gati Shakti planning. Floodproofing of ports, warehouses, and access roads should be a standard design parameter. The LEADS framework should explicitly score this.
Skilling matters as much as capital. Logistics service quality depends on truck drivers, warehousing workers, customs brokers, and freight forwarders. Sector skill councils need to scale, and ITIs and polytechnics should include logistics-specific tracks.
Finally, India should engage internationally to push its DPI-style logistics platforms as exportable goods, building on the larger DPI India Stack reference architecture. The National Logistics Portal Marine, the Logistics Data Bank, and the Gati Shakti platform are world-class digital tools that peer economies are interested in adopting.
Frequently Asked Questions
What is the LEADS 2025 Report?
LEADS, or Logistics Ease Across Different States, is an annual assessment of state and union territory logistics performance published by the Department for Promotion of Industry and Internal Trade. The 2025 edition is the seventh in the series, released on May 13, 2026, covering financial year 2024-25.
How are states classified in the LEADS report?
States are grouped into four categories: Coastal States with sea-port access, Landlocked States, North-Eastern States, and Union Territories. Within each category, states are placed into Achievers, Fast Movers, or Aspirers tiers based on a four-pillar framework.
What are the four pillars of the LEADS framework?
The four pillars are Infrastructure (roads, rail, ports, warehousing), Services (freight forwarding, trucking, courier networks), Operational (turnaround times, transit reliability), and Regulatory (permits, transparency, grievance redressal).
How does LEADS connect to PM Gati Shakti?
PM Gati Shakti is the GIS-enabled national master plan that synchronizes infrastructure planning across central and state agencies. LEADS draws on Gati Shakti dashboard data and partly assesses how effectively states use the platform. The two are complementary tools in the National Logistics Policy architecture.
Which states are top performers in LEADS 2025?
Gujarat, Tamil Nadu, Karnataka, and Andhra Pradesh lead the Coastal States category. Haryana, Punjab, and Uttar Pradesh lead the Landlocked category. Delhi and Chandigarh lead Union Territories. Assam, Tripura, and Sikkim are Fast Movers in the North-East.
What is the National Logistics Policy 2022?
The National Logistics Policy, launched in September 2022, aims to reduce logistics costs, improve India’s Logistics Performance Index rank, build a unified logistics interface platform, and embed data-driven decision making. LEADS measures state-level progress toward these targets.
How is logistics cost as a share of GDP measured?
Multiple methodologies exist. Various government and industry estimates place India’s logistics cost at 13 to 14 percent of GDP, against 8 to 9 percent for developed economies. The DPIIT and NITI Aayog are working on a refined official methodology under the National Logistics Policy.
What is the role of Dedicated Freight Corridors in state performance?
Dedicated Freight Corridors, especially the Eastern and Western corridors operated by DFCCIL, separate freight from passenger rail traffic, raise rail freight modal share, and reduce transit times. States along these corridors, including Haryana, Uttar Pradesh, and Gujarat, have shown measurable improvement in LEADS rankings.
How does India compare globally on logistics?
India ranks 38th in the World Bank’s Logistics Performance Index 2023, an improvement from 44th in 2018. China, Vietnam, and Thailand outperform India in most LPI categories, while India outperforms regional peers like Pakistan and Bangladesh.
What are the main critiques of the LEADS methodology?
Critiques include heavy reliance on perception surveys, uneven coverage of specialized logistics like cold chain and air cargo, data integration gaps across states, and limited treatment of climate resilience. The DPIIT addresses many of these in successive editions and has signaled deeper coverage in the eighth edition.
Tell Google you want more of this.
Add Anantam IAS as a preferred sourceOne tap, and this site shows up more often in your own Top Stories, AI Overviews and AI Mode. Remove it any time.