Why in News?
On 31 August 2026, MoSPI released the trial Index of Services Production for June 2026, covering 19 service sub-sectors on a 2024-25 base.
- The release presents 19 separate sub-sector indices, rather than one headline composite measure for the entire services economy.
- Compared with June 2025, 18 sub-sectors recorded positive growth and 8 posted double-digit growth; air transport was the only sub-sector showing contraction.
- Real estate showed the strongest reported year-on-year increase at 24.7%, followed by retail trade at 18.0%; these are one-month readings, not established trends.
- MoSPI describes publication as experimental, intended to test data quality and resilience while gathering feedback from users and stakeholders.
- Services dominate India’s economic structure, yet many detailed output estimates arrive less frequently than comparable production indicators for industry.
- A monthly sub-sector lens can reveal turning points and divergence earlier, but policy interpretation depends on stable source data, revisions and longer sequences.
UPSC Relevance
Prelims Relevance
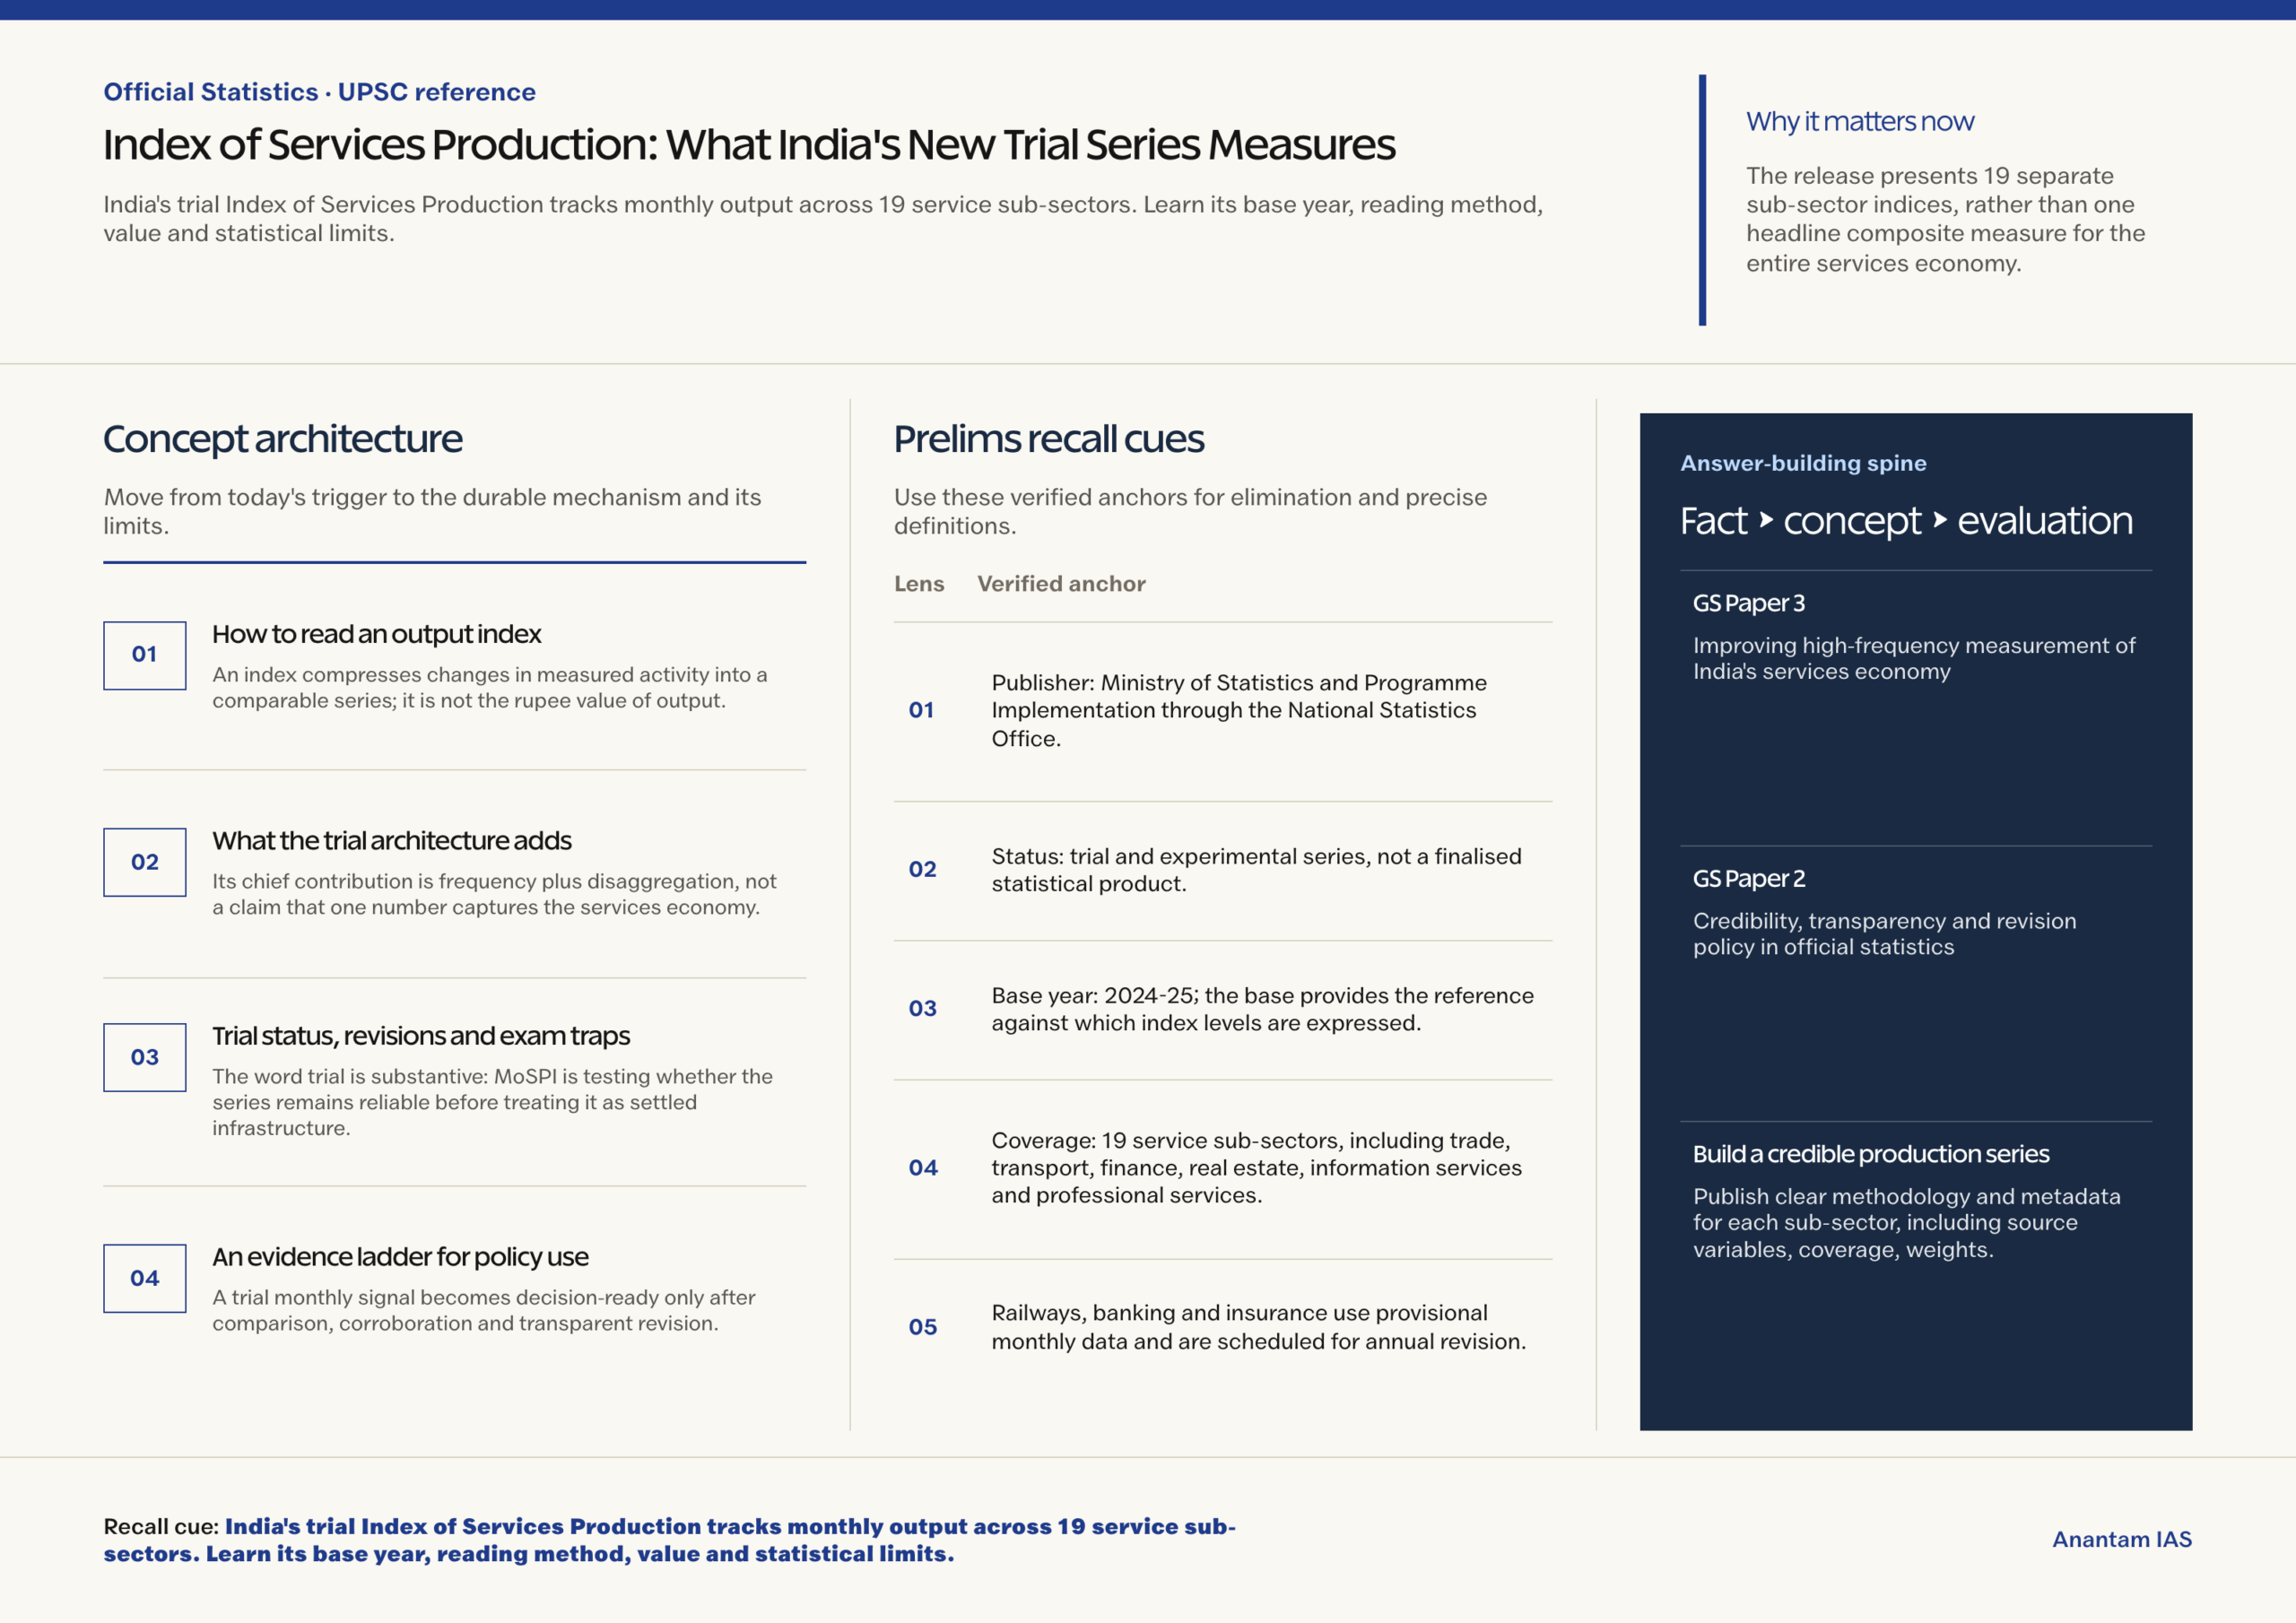
- Publisher: Ministry of Statistics and Programme Implementation through the National Statistics Office.
- Status: trial and experimental series, not a finalised statistical product.
- Base year: 2024-25; the base provides the reference against which index levels are expressed.
- Coverage: 19 service sub-sectors, including trade, transport, finance, real estate, information services and professional services.
- Railways, banking and insurance use provisional monthly data and are scheduled for annual revision.
Mains Relevance
GS Paper 3
- Improving high-frequency measurement of India’s services economy
- Using disaggregated indicators without confusing volatility with structural change
GS Paper 2
- Credibility, transparency and revision policy in official statistics
Essay
- Better public decisions require faster statistics, but speed must remain subordinate to transparent methods and credible revision.
Background and Context
How to read an output index
An index compresses changes in measured activity into a comparable series; it is not the rupee value of output.
- The base year 2024-25 supplies the reference point. An index above 100 indicates measured output above its base-period reference, subject to the published series method and later revisions.
- An index level such as 122.8 should not be read as 122.8 rupees, a percentage share of GDP, a growth rate, or a measure of employment.
- A year-on-year comparison matches June 2026 with June 2025, reducing seasonal distortion that may affect a comparison with the immediately preceding month.
- Year-on-year growth still describes only the change between two observations; it cannot by itself separate seasonal, cyclical, policy or data-source effects or explain the causal mechanism.
- The release provides sub-sector-specific readings. Divergence between air transport, real estate and trade is analytical information, not a contradiction requiring averaging away into a false common story.
What the trial architecture adds
Its chief contribution is frequency plus disaggregation, not a claim that one number captures the services economy.
- The 19 sub-sectors span market services such as wholesale and retail trade, accommodation, logistics, telecommunications, finance, real estate, professional services and entertainment.
- Monthly readings can support nowcasting, help analysts locate sector-specific stress and provide an earlier check against narratives built only from quarterly aggregates or anecdotal business reports.
- Separate indices preserve different operating rhythms: passenger transport, insurance, property activity and digital services need not move together during the same month or respond equally to a shock.
- The published release does not offer one overall ISP headline. Aspirants should not construct an unweighted average because sub-sectors differ greatly in economic size.
- ISP complements national accounts rather than replacing them. GDP and GVA measure broader value added within an accounting framework; this trial series tracks higher-frequency production movement.
Trial status, revisions and exam traps
The word trial is substantive: MoSPI is testing whether the series remains reliable before treating it as settled infrastructure.
- MoSPI says experimentation will examine data quality, test resilience and collect feedback, so coverage, sources or methods may be refined after evaluation rather than assumed final.
- Railways, banking and insurance currently rely on provisional monthly inputs; their published values may change during the stated annual revision process.
- A revision is not automatically evidence of manipulation. Statistical systems revise estimates when more complete source data replace early or provisional information, provided changes remain transparent and documented.
- The June breadth reading is notable, but one month cannot establish a trend. Trend claims need several comparable observations and attention to revisions, seasonality and base effects.
- The 24.7% real-estate increase is a headline observation, not proof that service-sector productivity, employment quality, household welfare or the entire services economy improved by the same proportion.
An evidence ladder for policy use
A trial monthly signal becomes decision-ready only after comparison, corroboration and transparent revision.
- First, read the direction and breadth: identify which sub-sectors rose or fell and whether movement is concentrated, without converting one release into a structural verdict.
- Second, compare several months and corresponding year-earlier observations, then check whether provisional values changed. Persistence matters more than an isolated high or low reading.
- Third, corroborate the signal with national accounts, employment, prices and sector-specific administrative evidence. Agreement strengthens diagnosis; disagreement identifies where measurement or transmission needs investigation.
- Policy should respond to the diagnosed mechanism, not the index alone. A transport decline caused by temporary disruption requires a different response from weak demand or capacity constraints.
Way Forward
Build a credible production series
- Publish clear methodology and metadata for each sub-sector, including source variables, coverage, weights, treatment of missing observations and revision schedules.
- Release vintage data so users can compare first estimates with revisions and judge whether early signals remain directionally reliable.
- Test seasonal adjustment only after sufficient observations accumulate, while retaining unadjusted data and explaining breaks in series.
- Use stakeholder feedback to improve coverage without sacrificing comparability across time or obscuring changes in methods.
Conclusion
- The trial ISP addresses a real information gap by making varied service activities visible at monthly frequency, but its strongest use is diagnostic, not definitive.
- A sound Mains answer should pair faster measurement with caveats on trial status, revisions and one-month volatility, then demand transparent methods before major policy reliance.
UPSC Practice Questions
Prelims MCQ 1
With reference to India’s trial Index of Services Production, consider the following statements:
- It uses 2024-25 as its base year.
- The June 2026 release presents separate indices for 19 service sub-sectors.
- Railways, banking and insurance are based on final monthly data that cannot be revised.
How many of the above statements are correct?
(a) Only one (b) Only two (c) All three (d) None
Answer: (b) Only two
Explanation:
Statements 1 and 2 are correct. MoSPI says the railways, banking and insurance indices use provisional monthly data and will undergo annual revision.
Prelims MCQ 2
Which interpretation of an Index of Services Production reading is most appropriate?
(a) It directly states the sub-sector’s share in GDP (b) It reports the rupee value of monthly service output (c) It tracks measured production relative to a base-period reference (d) It measures only employment generated by services
Answer: (c) It tracks measured production relative to a base-period reference
Explanation:
An output index expresses relative movement against its base reference. It is not a GDP share, rupee-value total or employment measure.
UPSC Mains Questions
- How can a monthly Index of Services Production improve economic policymaking in India? Discuss its value and the safeguards needed during a trial series.
- A high-frequency indicator can be timely without being conclusive. Explain with reference to sub-sectoral service indices, revisions and one-month volatility.
Source: PIB, Ministry of Statistics and Programme Implementation.
Frequently Asked Questions
What is the Index of Services Production?
It is a set of monthly indices tracking measured production movement across 19 service sub-sectors relative to a 2024-25 base-period reference.
Is India’s ISP a final official series?
No. MoSPI explicitly labels it a trial, experimental publication designed to test data quality and resilience and receive feedback before the system matures.
Does an index value of 122.8 mean 22.8% annual growth?
No. The index level is relative to its base reference. Annual growth must be calculated by comparing the index with the corresponding month a year earlier.
Why should one month not be called a trend?
A single comparison may reflect seasonality, base effects, temporary shocks or provisional inputs. A trend needs multiple comparable observations and scrutiny of later revisions.
How is ISP different from GDP or GVA?
ISP offers high-frequency movement for selected service sub-sectors. GDP and GVA are broader national-account aggregates measuring value added across the economy.
Tell Google you want more of this.
Add Anantam IAS as a preferred sourceOne tap, and this site shows up more often in your own Top Stories, AI Overviews and AI Mode. Remove it any time.