Disclosure: this guide contains Amazon affiliate links. As an Amazon Associate, Anantam IAS earns from qualifying purchases — at no extra cost to you.
एक लगातार बनी हुई धारणा है कि diagrams सिर्फ़ decoration हैं, यानी अगर कभी extra time मिले तो answer में डाल दीजिए। Extra time आपको कभी मिलता नहीं। हिसाब कुछ और बताता है।
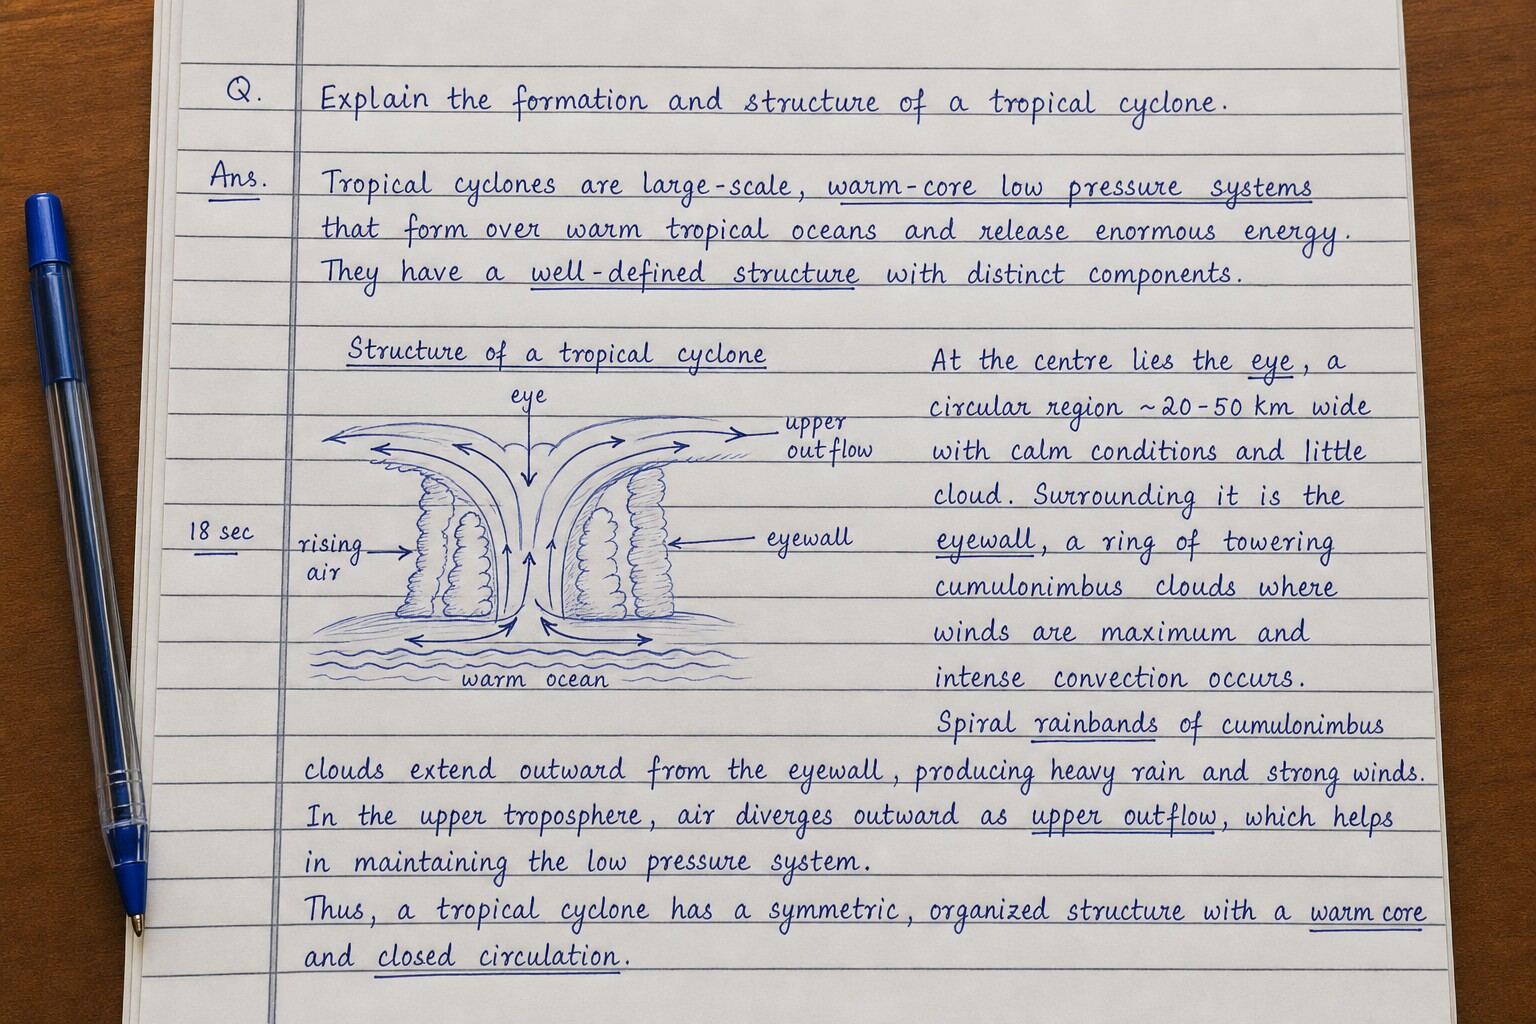
Evaluator के पास हर answer के लिए लगभग 90 seconds होते हैं। किसी process का labelled sketch करीब पाँच seconds में उसका content दिखा देता है और उसे बनाने में 15 से 20 seconds लगते हैं। वही content prose में लिखने पर आपको 60 seconds writing और evaluator को शायद 30 seconds reading में लगेंगे। इस लेन-देन में दोनों तरफ़ diagram जीतता है।
लेकिन यह हर तरह के content पर लागू नहीं होता। गलत चुना गया diagram बिना किसी लाभ के time खा जाता है।
Diagrams सबसे ज़्यादा कहाँ काम आते हैं
GS-1 physical geography। यह सबसे साफ़ example है। GS-1 में geography 31.9% है और उसके physical हिस्से में ऐसे processes भरे हैं जो स्वभाव से spatial हैं: cyclone structure, atmospheric circulation cells, ocean current gyres, plate boundary types, coastal landform sequences, monsoon का advance और retreat, temperature inversion। इन सबको describe करने से diagram बनाना तेज़ है।
किसी भी comparison में। दो-column table हमेशा दो paragraphs से बेहतर होती है। Himalayan और peninsular rivers, Nagara और Dravida, FDI और FPI, या अलग-अलग deficit measures, सब पर यही लागू है।
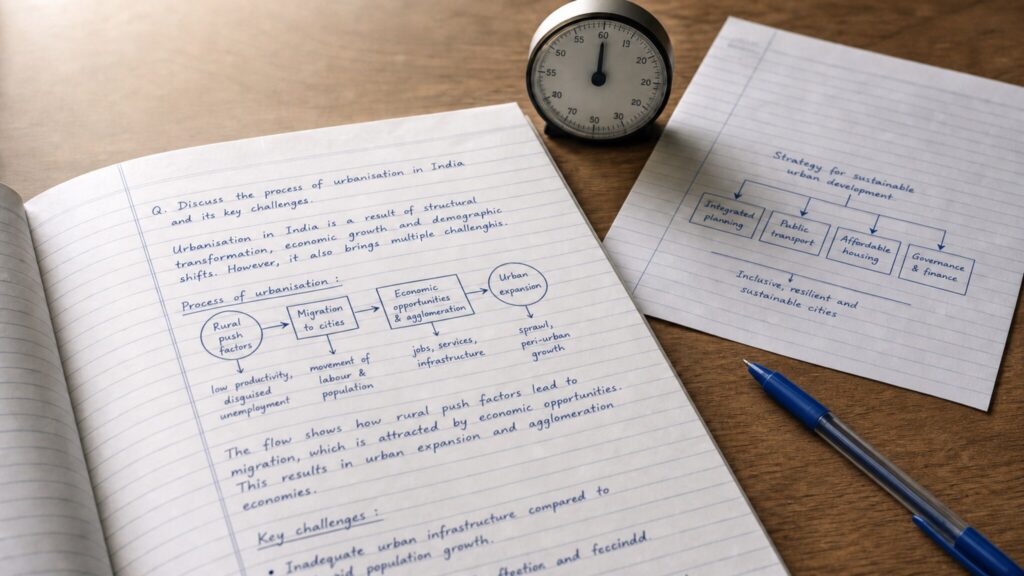
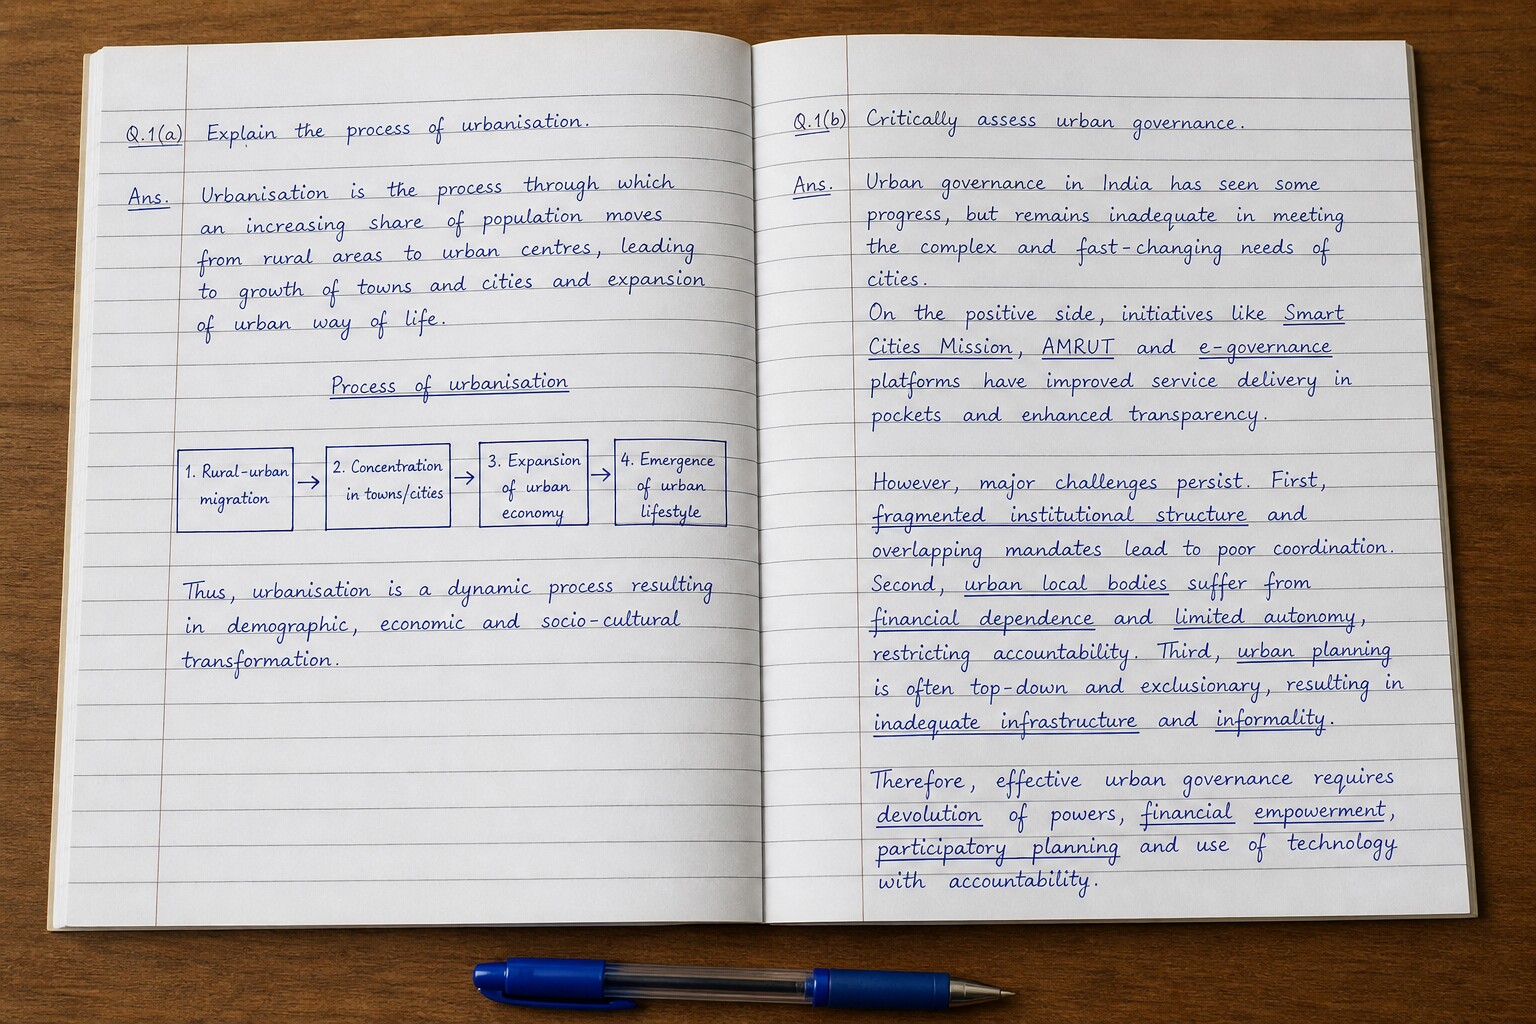
किसी process या chain में। Policy transmission, value chain, disaster-management cycle के stages और bill के act बनने की प्रक्रिया। Boxes और arrows लगाइए।
किसी classification में। एक simple tree: types of, categories under और branches of। अधिकतम तीन levels।
Locations। तीन या चार labelled points वाला rough India outline। यह artwork नहीं, locator है।
जहाँ diagrams काम नहीं आते
- Ethics answers। GS-4 prose में reasoning को reward करता है। Case study में stakeholder diagram बनाना उस असली judgment से बचने जैसा पढ़ा जाता है जिसकी question को ज़रूरत है।
- Evaluative questions। “Critically examine whether X worked” argument माँगता है। Diagram qualified judgment को hold नहीं कर सकता।
- ऐसी कोई चीज़ जिसकी practice नहीं की है। Hall में पहली बार बनाया गया diagram तीन गुना time लेगा और दिखेगा भी वैसा ही।
- Decoration। Borders, shading, colour और elaborate arrows। इनमें किसी से mark नहीं मिलता, लेकिन सब seconds खाते हैं।
समय के भीतर diagram बनाने के rules
छोटा। Page की width का एक-तिहाई, आधा page नहीं। Space सीमित है और space ही असली word limit है। इसके लिए UPSC Answer Writing Copyदेखिए।
Labelled। Unlabelled diagram किसी काम का नहीं, क्योंकि evaluator उस content को mark नहीं दे सकता जिसे पहचान ही न पाए। तीन से छह labels काफ़ी हैं।
हर diagram और map के लिए pen इस्तेमाल कीजिए। जिस medium को answer booklet में इस्तेमाल करेंगे, उसी में practice कीजिए। Lines इतनी simple रखें कि correction की ज़रूरत न पड़े।
Integrated, appended नहीं। Diagram को उसी body segment में रखिए जहाँ वह belong करता है और उससे पहले एक line में बताइए कि वह क्या दिखा रहा है। Answer के अंत में तैरता हुआ diagram afterthought लगता है।
छोटा title दीजिए। चार या पाँच words, ताकि उसका purpose साफ़ रहे।
India maps पर एक सावधानी
अगर India का outline बना रहे हैं, तो पूरी और सही external boundary बनाइए। यह महत्वपूर्ण है। जल्दी में northern boundary काट देना कुछ practice runs से पूरी तरह avoid किया जा सकने वाला error है।
ज़्यादातर Mains questions में national outline की ज़रूरत नहीं होती। Regional sketch, river का course या relative positions वाला schematic आम तौर पर काफ़ी और बहुत तेज़ होता है।
Practice करने लायक दस diagrams
एक छोटा repertoire बनाइए और तब तक drill कीजिए जब तक हर diagram 20 seconds से कम में न बन जाए:
- Cyclone cross-section
- Three-cell atmospheric circulation
- एक hemisphere का ocean current gyre
- Plate boundary types (तीन छोटे panels)
- Monsoon advance और retreat का schematic
- Tributaries वाला river system, schematic
- चार boxes वाला disaster management cycle
- पाँच boxes वाली policy transmission chain
- एक generic two-column comparison table
- तीन-level classification tree
ये दस diagrams उन Mains questions का बड़ा हिस्सा cover करते हैं जहाँ visual सच में मदद करता है। एक महीने में हर diagram को 20 बार बनाने से वह automatic हो जाता है। Speed पर इस्तेमाल करने की यही एक शर्त है। हमारा geography note-making guide बताता है कि इन्हें notes में कैसे शामिल करें, ताकि practice पढ़ाई के साथ अपने-आप होती रहे।
Practice कैसे करें
अपने daily answer-writing build-upके दौरान हर geography answer में एक diagram जोड़िए, भले ही उसका फायदा थोड़ा ही क्यों न हो। Practice का लक्ष्य judgment नहीं, fluency है। Drawing automatic हो जाए, तो चुनना शुरू कीजिए: सिर्फ़ वहीं diagram बनाइए जहाँ वह prose से सचमुच बेहतर हो।

amblitz A4 उत्तर-लेखन नोटबुक — 200 पेज
- A4 स्पाइरल नोटबुक, 200 पेज, 70 GSM काग़ज़
- मार्जिन पहले से छपे हैं, Mains की उत्तर-पुस्तिका जैसे
- 250 शब्दों का उत्तर, हेडिंग और एक डायग्राम आराम से आ जाता है
Time अलग से मापिए। अगर diagram बनाने में 25 seconds से ज़्यादा लग रहे हैं, तो hall के लिए वह बहुत elaborate है।
सामान्य प्रश्न
क्या UPSC Mains answers में diagrams बनाने चाहिए? जहाँ content spatial, comparative, procedural या classificatory हो, वहाँ हाँ। Labelled sketch writing के हर second में prose से ज़्यादा information देता है। Ethics और purely evaluative questions में नहीं।
क्या UPSC Mains में diagrams के extra marks मिलते हैं? अलग से कोई allocation नहीं है। Diagram marks इसलिए कमाता है क्योंकि वह content efficiently दिखाता है और evaluator के 90-second reading window में answer को readable बनाता है।
क्या diagrams और maps pen से बनाने चाहिए? हाँ। हर diagram, flowchart और map के लिए pen इस्तेमाल कीजिए। शुरुआत से इसी तरह practice करेंगे, तो speed और line control examination में साथ आएँगे।
Mains answer में diagram कितना बड़ा होना चाहिए? Page की width का करीब एक-तिहाई। Space ही असली word limit है और बहुत बड़ा diagram answer के body हिस्से को खा जाता है।
किन subjects को diagrams से सबसे ज़्यादा लाभ मिलता है? सबसे पहले GS-1 physical geography। उस paper में geography 31.9% है और उसका बड़ा हिस्सा स्वभाव से spatial है। किसी भी paper के comparisons और process questions में भी diagrams मदद करते हैं।
कितने diagrams की practice करनी चाहिए? करीब दस core diagrams। इन्हें तब तक drill कीजिए जब तक हर एक 20 seconds से कम में न बन जाए। यह repertoire उन ज़्यादातर Mains questions को cover करता है जहाँ visual सच में उपयोगी है।