
The middle income trap (MIT) is the phenomenon where countries that successfully transition from low income to lower-middle income then stall before reaching high-income status. The Late Converger Stall, a term highlighted by India's Economic Survey 2018-19, refers specifically to late-converging economies like India and others that began rapid catch-up after the 1990s and may face an even steeper version of the trap because the global growth environment turned hostile after the Global Financial Crisis of 2008. India crossed into lower-middle income in 2008 (per World Bank classification) and aims to reach upper-middle income status in the late 2020s, with the long-term goal of becoming a high-income economy by 2047 under Viksit Bharat. Whether India clears the trap depends on four challenges — globalisation backlash, thwarted structural transformation, human capital gaps, and climate stress — that the Economic Survey 2018-19 flagged. This article unpacks them with 2024-26 data for UPSC GS-III.
What Is the Middle Income Trap
The Concept
The term middle income trap, popularised by World Bank economists Gill and Kharas (2007) in An East Asian Renaissance, describes economies that:
- Successfully use factor accumulation, low wages, and labour-intensive manufacturing to escape low-income status.
- Then fail to make the transition to innovation-driven, higher-productivity growth required for high-income status.
- Stagnate at per-capita income roughly USD 4,000-12,000 for decades.
World Bank Income Classifications (2024-25)
| Category | GNI per capita (Atlas method, 2023) | Examples |
|---|---|---|
| Low income | <USD 1,145 | Madagascar, DRC |
| Lower-middle income | USD 1,146-4,515 | India (~$2,500), Bangladesh, Nigeria |
| Upper-middle income | USD 4,516-14,005 | China, Brazil, Mexico, South Africa |
| High income | >USD 14,005 | South Korea, Japan, USA, Singapore |
India sits firmly in the lower-middle income band, with clear ambitions to reach upper-middle income before 2030 and high-income before 2047.
Examples
- Successful escapes: South Korea, Singapore, Taiwan, Hong Kong, Israel, more recently Poland.
- Stuck: Brazil, Mexico, South Africa, Argentina, Malaysia, Thailand — countries that have hovered in upper-middle income for 30-50 years.
What Is the Late Converger Stall
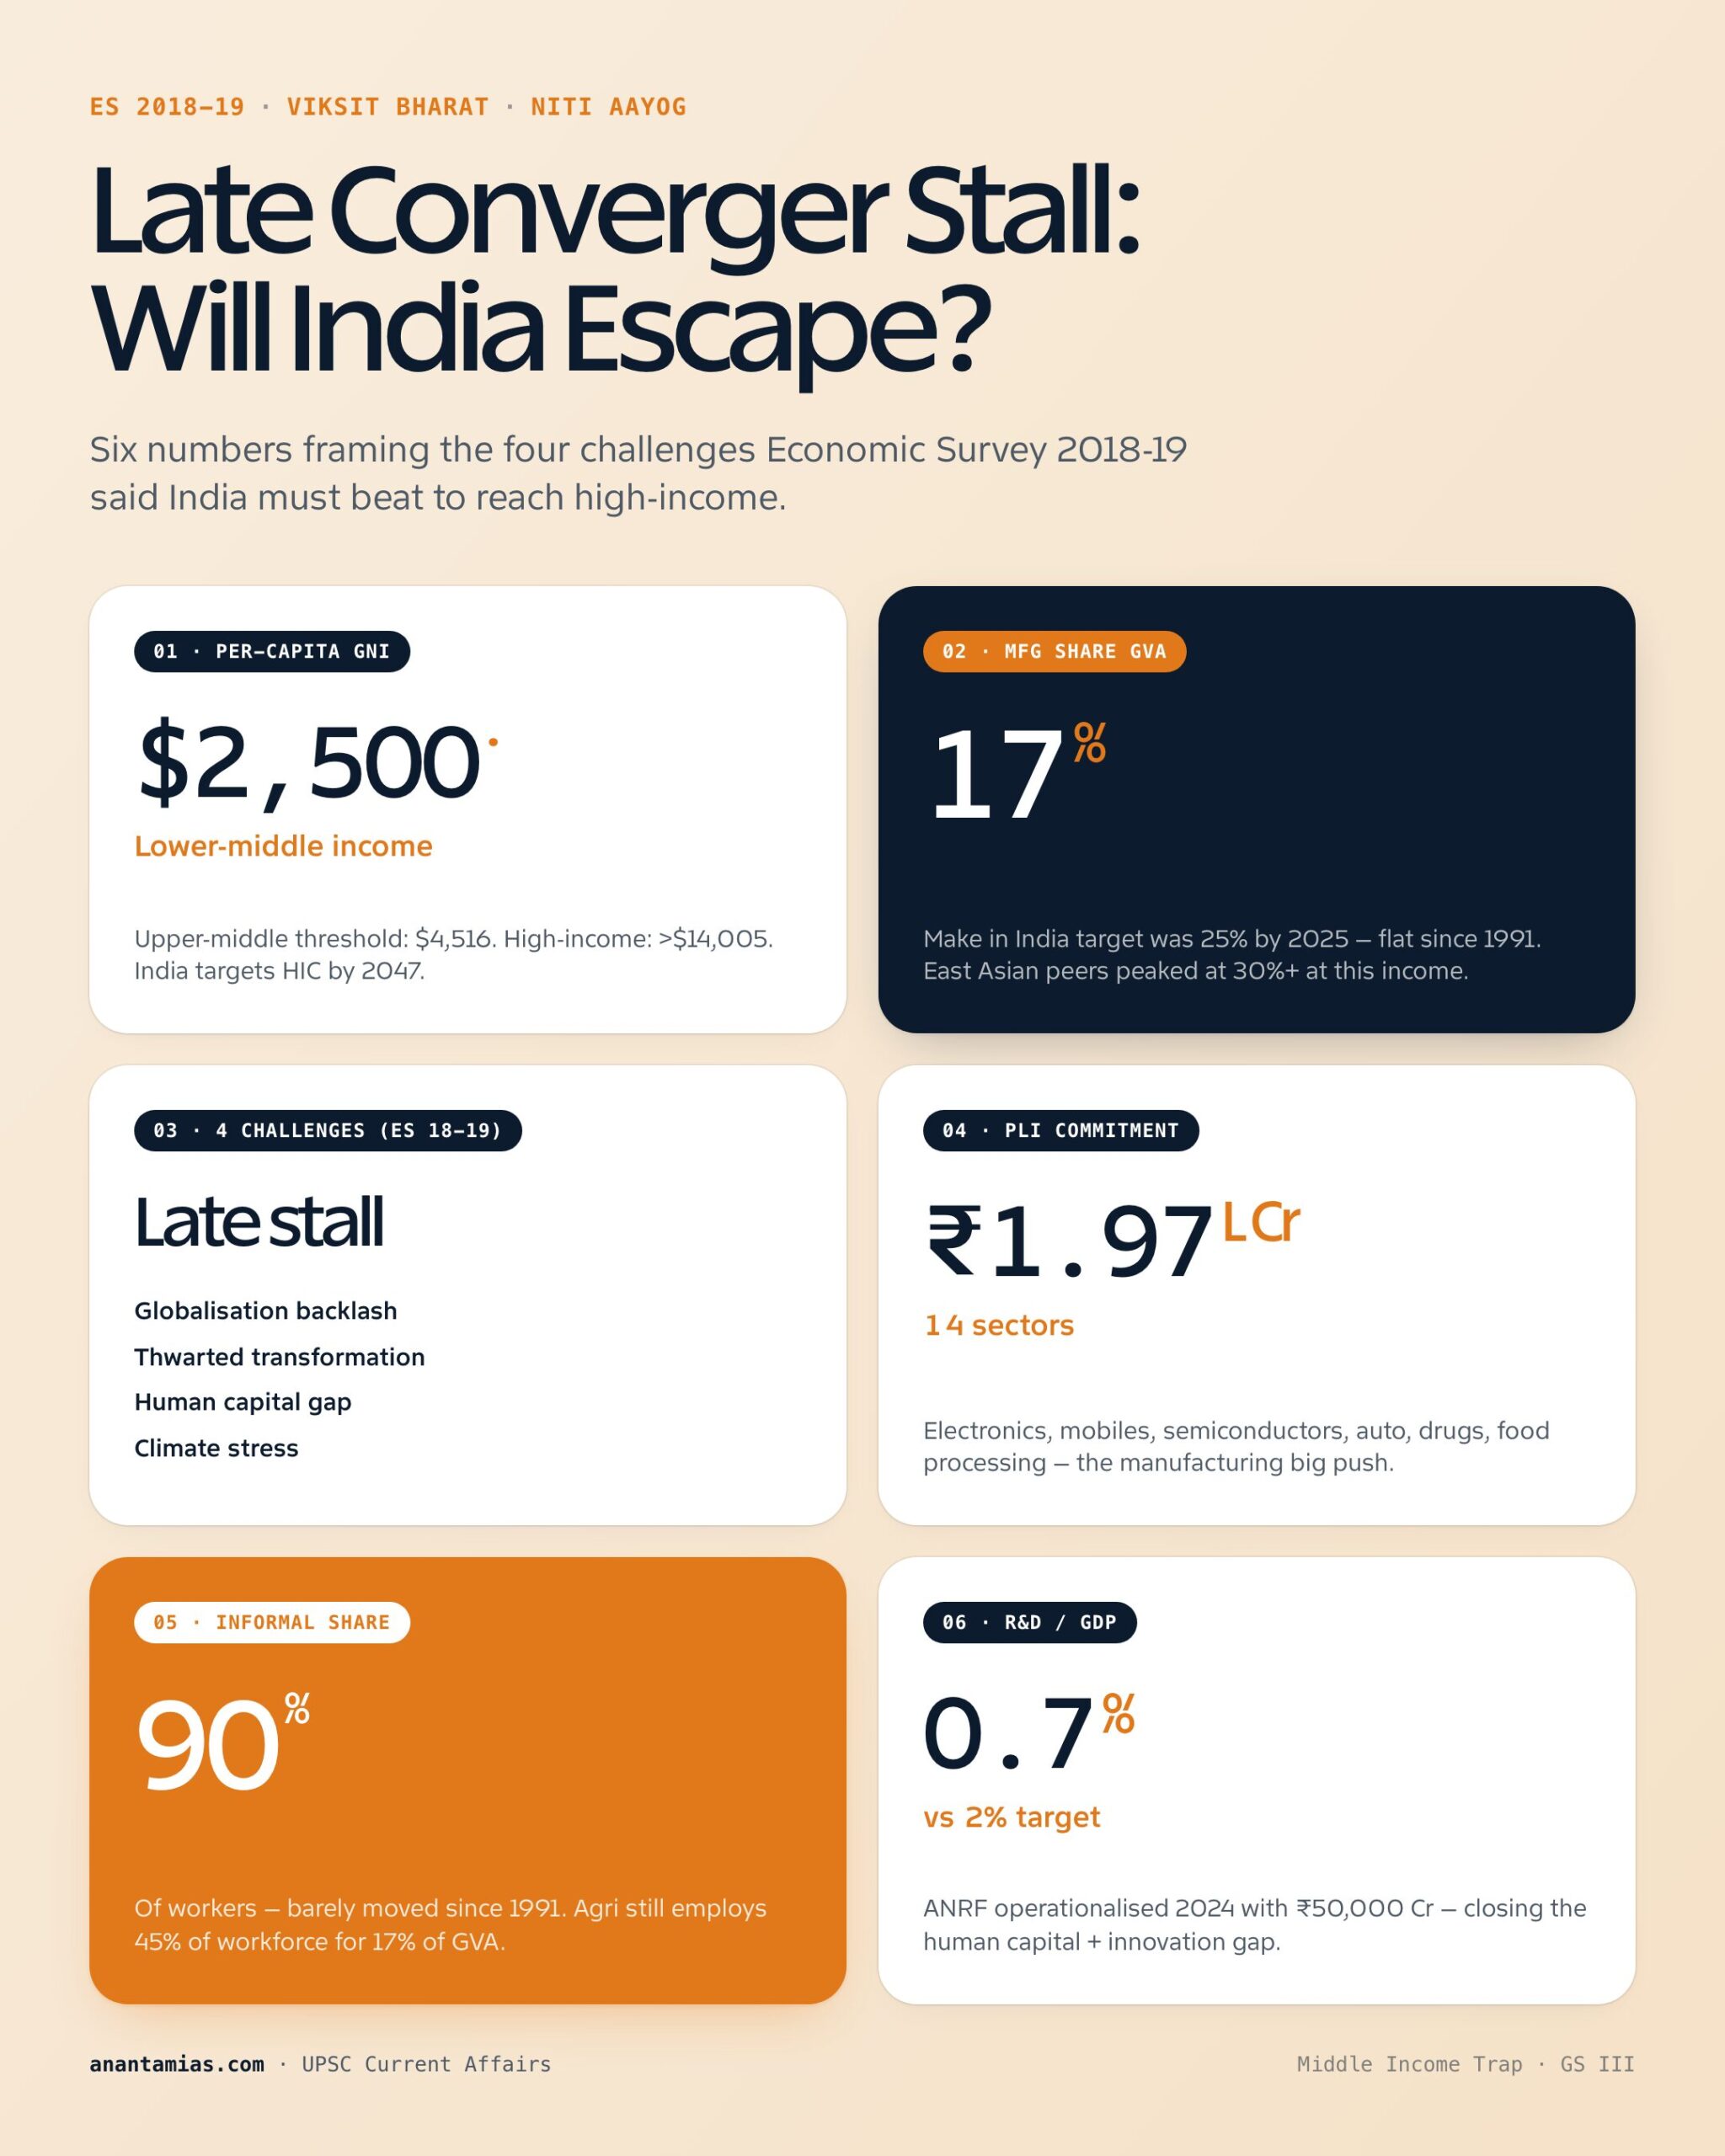
The Economic Survey 2018-19, Volume I, Chapter 4 ("From Late Converger Stall to Late Converger Leap") introduced this concept with a specific Indian framing:
- Early convergers (Japan, South Korea, Singapore, Taiwan, China) industrialised when global trade was expanding rapidly, the world was open to manufactured exports, and protectionism was muted.
- Late convergers (India, Indonesia, Vietnam) are trying to converge in a post-2008 global environment marked by slowing world trade, rising protectionism, climate-policy constraints, and digital disruption.
- Hence convergence may be slower, harder, or stall altogether.
The Survey argued India must act in time to avoid this fate.
The Four Challenges (Economic Survey 2018-19)
1. Backlash Against Globalisation
- Early convergers like Japan and South Korea posted growth rates of 8-10 percent for two decades during their convergence periods, almost entirely driven by export-led manufacturing.
- After 2008, the global trade-to-GDP ratio plateaued; WTO Doha Round stalled; US-China decoupling intensified post-2018.
- Tariffs are rising — average MFN tariffs in the US, EU, and China have climbed since 2018; new CBAM (Carbon Border Adjustment Mechanism) of the EU adds further frictions for emerging exporters.
- India must therefore secure export markets through bilateral FTAs (UAE, Australia, EFTA done; UK, EU under negotiation) rather than rely on the WTO.
2. Thwarted Structural Transformation
The classical development pathway moves labour from low-productivity agriculture to high-productivity manufacturing and then to modern services. India's case is troubling:
- Manufacturing share of GDP has remained around 15-17 percent since 1991, unchanged despite the Make in India push (target was 25 percent by 2025).
- Around 90 percent of workers remain in informal employment (PLFS, ILO).
- Agriculture still employs over 45 percent of workers but contributes only ~17 percent of GVA.
- India has experienced a services-led rather than manufacturing-led transition — unique among large economies.
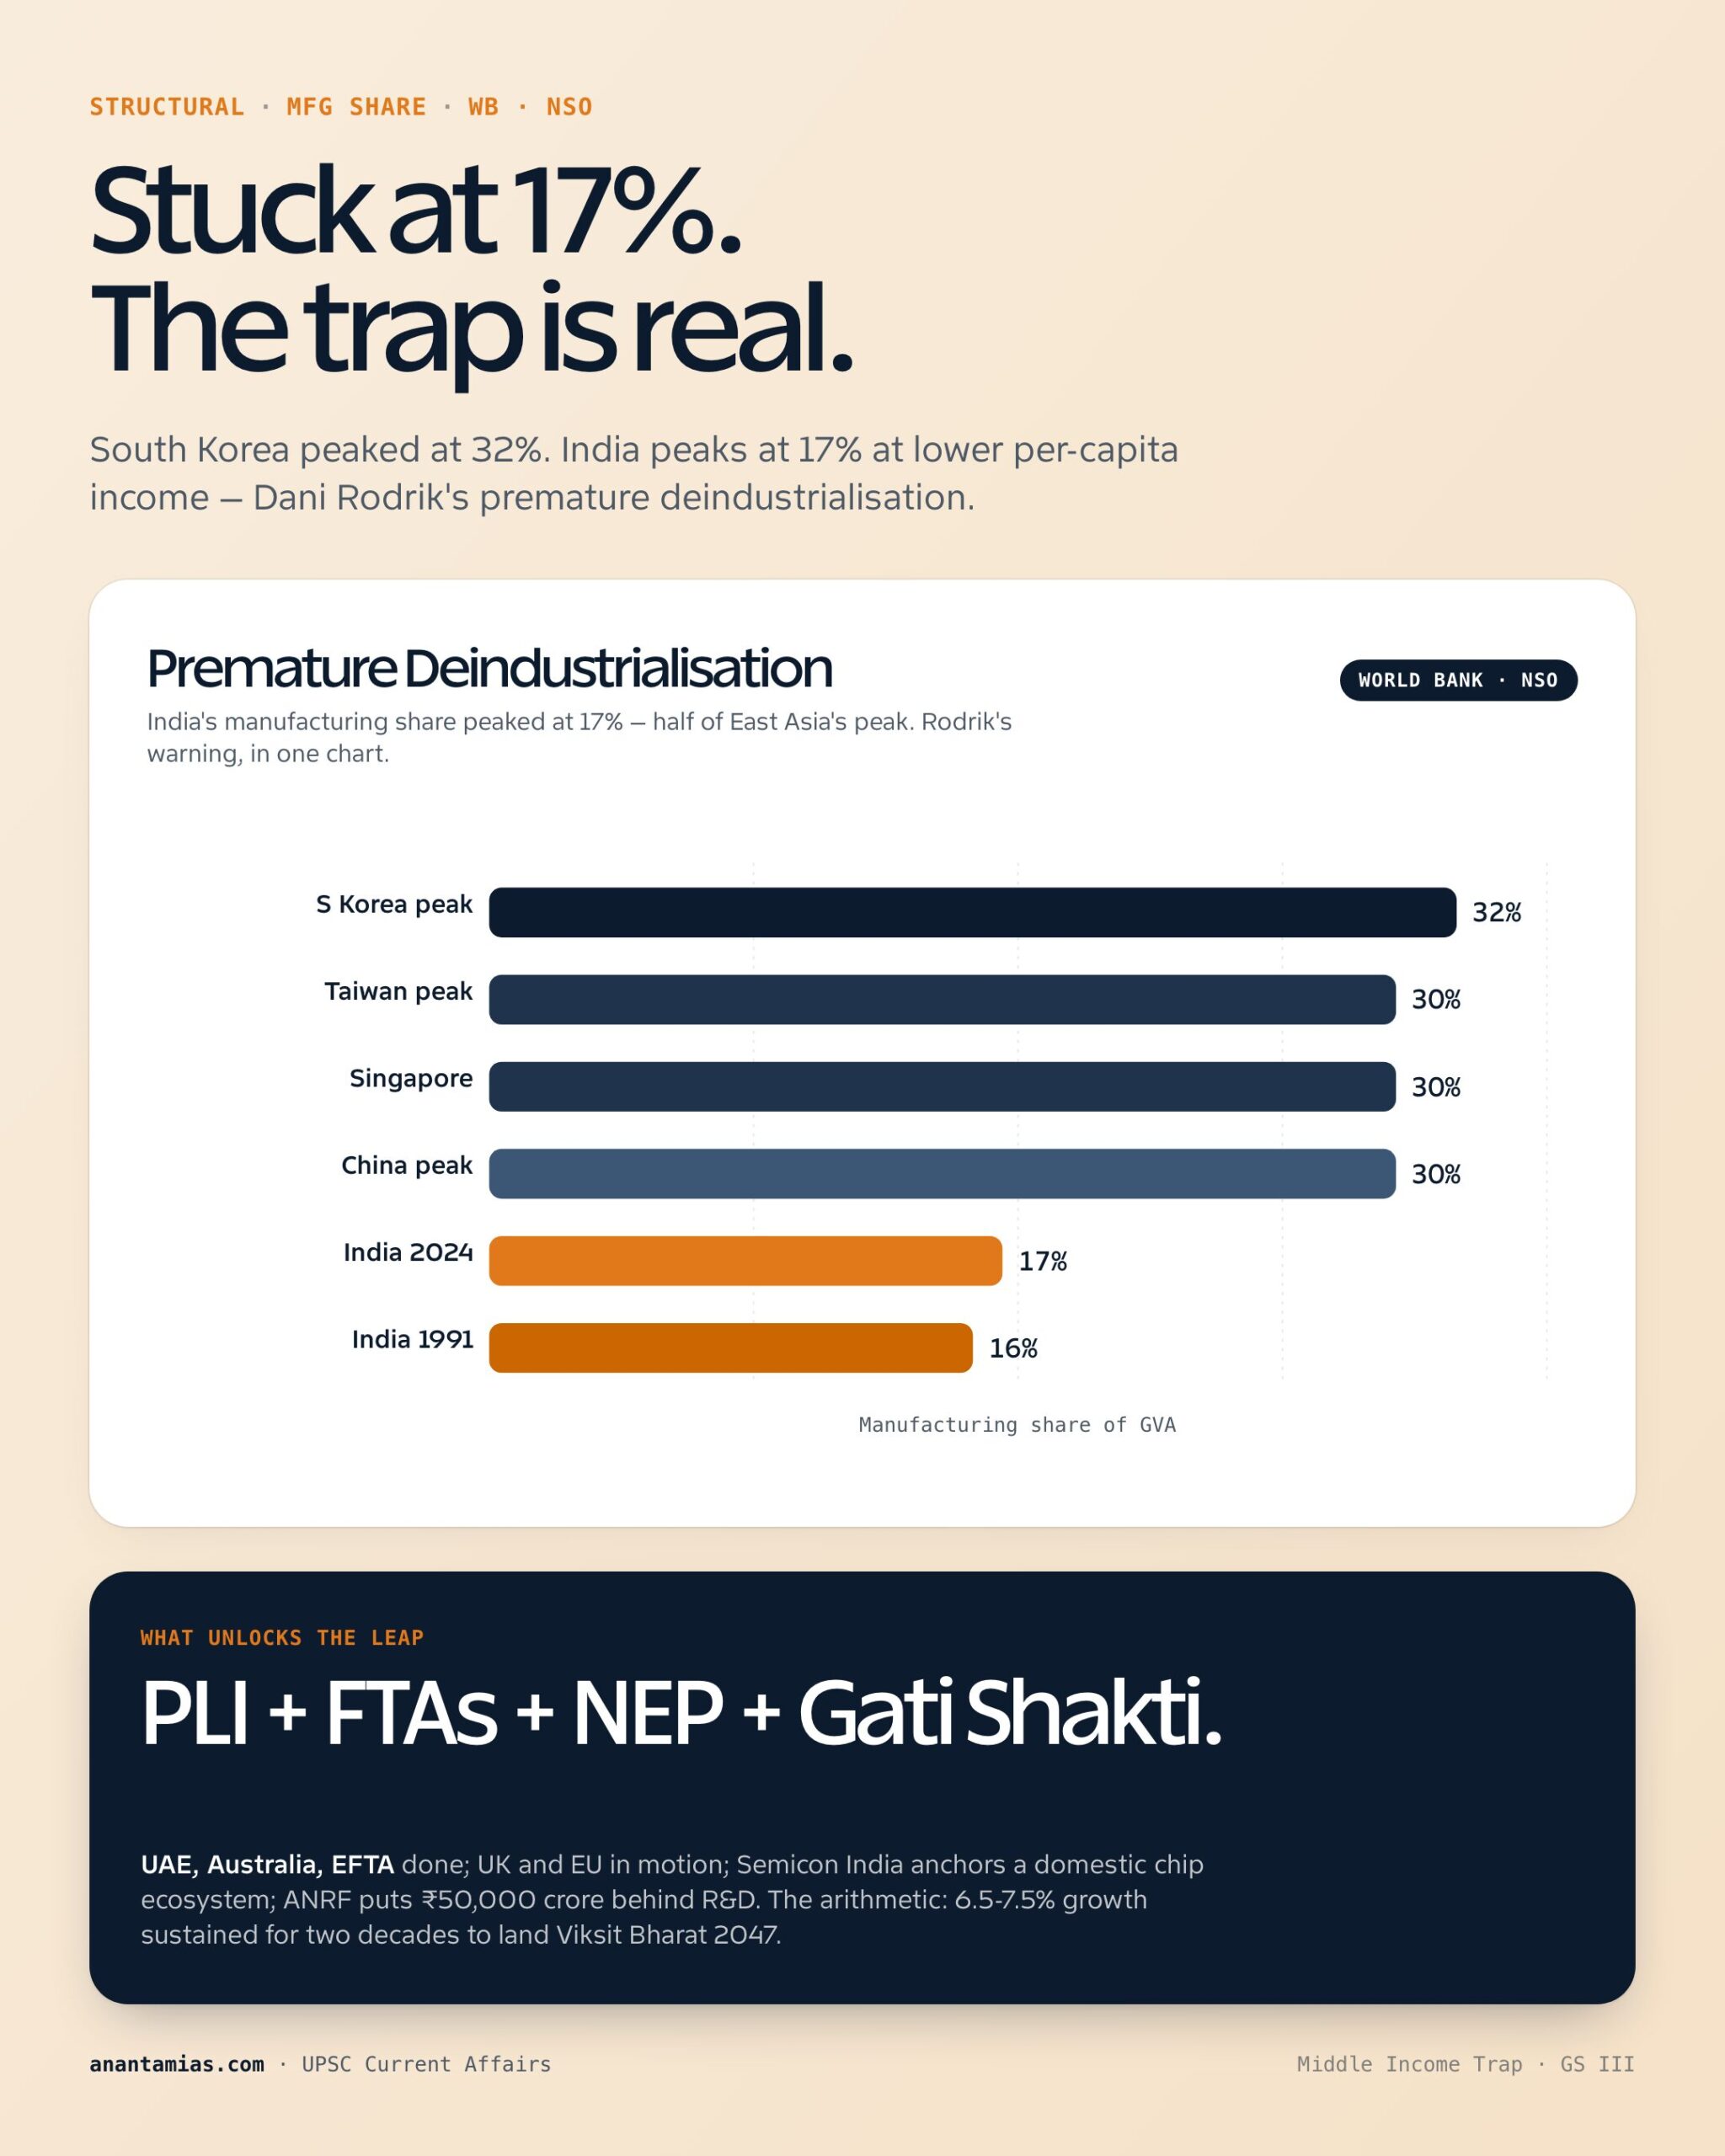
This is premature deindustrialisation: India's manufacturing share peaked at lower levels and earlier than in East Asian economies.
3. Human Capital Regression
- India under-spends on education (around 2.9 percent of GDP) and health (around 2.1 percent of GDP) versus the UN-recommended 6 and 5 percent respectively.
- PISA 2022 is the most recent comparable international test; India's last participation (2009) ranked among the bottom in mathematics and science.
- ASER 2024 shows that even after Class 5, only ~44 percent of rural children can read a Class 2 text fluently.
- India is at the cusp of Industry 4.0 — AI, robotics, biotech — but a workforce deficient in foundational literacy and numeracy cannot leverage these disruptions.
4. Climate-Induced Stress
- Successful structural transformation requires agricultural productivity to rise so that labour can move out of farming.
- But Indian agricultural yields lag global benchmarks: rice yield is ~4.0 t/ha (versus China 7.0); wheat ~3.5 t/ha (versus China 5.7).
- Climate change — heat waves, erratic monsoons, glacier melt, extreme rainfall — could push agricultural productivity backward, trapping workers in low-productivity farming.
- Mitigation policies (e.g., emission targets, fossil-fuel transition costs) may slow industrial growth itself in the convergence window.
How India's Growth Has Actually Played Out
| Indicator | 1991 | 2014 | 2024 |
|---|---|---|---|
| GDP growth (avg) | 1.1% (FY91) | 7.4% (FY14) | 8.2% (FY24) |
| Per capita GNI (Atlas, USD) | 360 | 1,560 | ~2,500 |
| Manufacturing share of GVA | 16% | 16% | 17% |
| Services share of GVA | 41% | 51% | 54% |
| Agriculture share of GVA | 30% | 18% | 17% |
| Agricultural employment share | 60% | 49% | 45% |
| Informal employment share | ~92% | ~92% | ~90% |
| Inflation (CPI) | 13.9% | 5.9% | 5.4% |
The pattern: growth rates have been respectable, but the structural transformation envisioned in 1991 is incomplete. India is in danger of stalling at upper-middle income unless it accelerates manufacturing absorption, formalisation, and human capital build-up.
Recent Developments (2024-26)
Growth Outlook
- IMF World Economic Outlook (April 2025) projected India's growth at 6.5 percent for FY26, fastest among G20.
- NITI Aayog Vision 2047 — Viksit Bharat roadmap targets per-capita income near USD 18,000 by 2047, requiring sustained 6.5-7.5 percent growth for two decades.
- World Bank's Country Economic Memorandum 2024 flagged the manufacturing-share gap as the binding constraint.
Production-Linked Incentive (PLI) Schemes
- 14 PLI sectors with cumulative outlay Rs 1.97 lakh crore announced over 2020-2026.
- Electronics, mobile phones, semiconductors, auto components, drugs, food processing lead in commitments and exports.
- Semicon India Programme (Rs 76,000 crore) seeks to anchor a domestic semiconductor ecosystem with Tata-PSMC, Micron Sanand, and Kaynes.
- Critical minerals mission (Budget 2024-25) supports the green transition.
Free Trade Agreements
- India-UAE CEPA (2022), India-Australia ECTA (2022), India-EFTA TEPA (2024) signed.
- India-UK FTA negotiations advanced through 2025.
- India-EU FTA negotiations ongoing with target of completion by 2025-26.
Manufacturing & Logistics Push
- Gati Shakti National Master Plan integrating 36 ministries to cut logistics costs from 14 percent to global average of 9 percent.
- National Logistics Policy 2022 with sectoral metrics.
- Bharatmala and Sagarmala programmes scaling road and port infrastructure.
Education and Skilling
- NEP 2020 rollout — 5+3+3+4 structure, vocational education from Class 6, mother-tongue instruction.
- National Curriculum Framework (NCF) 2023 operationalised in classrooms by 2024-25.
- PM-SHRI Schools — 14,500 model schools.
- Anusandhan National Research Foundation (ANRF) operationalised in 2024 with Rs 50,000 crore over five years.
- PM Internship Scheme — Budget 2024-25 announced 1 crore internships.
Climate-Industrial Pivot
- India's NDC updated 2022 — net zero by 2070; 50 percent non-fossil capacity by 2030.
- National Green Hydrogen Mission — Rs 19,744 crore.
- Carbon Credit Trading Scheme (CCTS) 2024 notified.
- Critical Minerals Mission (Budget 2024-25).
Will India Escape the Trap? Optimistic vs Pessimistic Scenarios
| Indicator | Optimistic | Pessimistic |
|---|---|---|
| Growth (next 20 yrs) | 7-7.5% | 5-6% |
| Manufacturing share | 25% by 2035 | Stuck at 16-18% |
| FLFPR | 50%+ | <40% |
| Education spending | 6% of GDP | <4% |
| FTA web | Comprehensive | Patchy |
| Climate transition | Smooth, financed | Costly disruption |
| Outcome | High-income by 2047 | Stuck at upper-middle |
Way Forward
- Manufacturing big push: Continue PLI, double down on electronics, EV, semiconductors, textiles, food processing, defence.
- Logistics and infrastructure: Sustain capex push (Rs 11.21 lakh crore in BE 2025-26), Gati Shakti rollout.
- Human capital: Scale up NEP 2020 implementation; expand health spending; rapid skilling pipeline.
- Trade openness: Conclude EU FTA, deepen RCEP-equivalent linkages without losing sensitive-sector protection.
- Climate-industrial alignment: Use green hydrogen, critical minerals, EVs as new engines, not constraints.
- Reforms in factor markets: Land, labour, capital flexibility, especially in states.
- Female labour participation: Care economy, formal services, MSME workforce expansion.
UPSC Relevance
GS-III Mapping
- Indian economy and issues relating to planning, mobilization of resources, growth, development and employment.
- Effects of liberalisation on the economy.
- Government budgeting — fiscal space for structural reforms.
Prelims Pointers
- Middle income trap — Gill & Kharas, World Bank (2007).
- Late Converger Stall — Economic Survey 2018-19.
- Income classification — World Bank Atlas method.
- PLI Schemes — 14 sectors, Rs 1.97 lakh crore.
- Make in India — launched 2014; manufacturing target 25 percent of GDP.
- Viksit Bharat 2047 — central government roadmap to high income.
Mains Hooks
- "India risks the Late Converger Stall unless it overhauls four constraints. Examine." (GS-III, ES 2018-19)
- "Why has India's manufacturing sector remained stuck at 16-17 percent of GDP despite three decades of reforms?" (GS-III)
- "Discuss how the post-2008 global environment has made the middle-income trap harder to escape for India."
- "Compare India's growth pathway with that of East Asian economies. What lessons emerge?"
India's escape from the middle income trap is not assured. The arithmetic is steep — sustained 6.5-7.5 percent growth for two decades with simultaneous transformation of manufacturing, human capital, and labour formalisation. The good news: policy intent is aligned (PLI, NEP, FTAs, Viksit Bharat) and the 2024-25 fiscal framework maintains capex push despite global headwinds. For UPSC, master the four challenges, the structural data, and Viksit Bharat targets — and write Mains answers that recognise both the risk and the opportunity.
The Premature Deindustrialisation Argument
Economist Dani Rodrik (2015) observed that emerging economies are now deindustrialising at lower per-capita income levels than the historical pioneers (Japan, Germany, USA). India's manufacturing share peaked around 17 percent of GDP at a per-capita income of roughly USD 1,500-2,000 — versus East Asian peaks at 30+ percent at similar income levels. The reasons:
- Automation and robotics reduce manufacturing employment globally.
- Global value chains (GVCs) are shorter and more concentrated post-2008.
- Services-led growth (especially IT-BPM in India's case) absorbed the talent that would have gone to manufacturing.
- Premature deindustrialisation locks countries into lower-productivity services, narrowing the path to high income.
How India Can Address Each Challenge
| Challenge | India's Policy Response | Gap to Address |
|---|---|---|
| Globalisation backlash | FTAs (UAE, Australia, EFTA, UK, EU); diversify to Africa, LatAm | EU FTA closure; CBAM mitigation |
| Thwarted structural transformation | PLI, Make in India, Gati Shakti | Labour codes implementation; MSME formalisation |
| Human capital regression | NEP 2020, ANRF, PMKVY 4.0, Ayushman Bharat | Health spending as percent of GDP; teacher quality |
| Climate stress | NDC 2022, Green Hydrogen Mission, Critical Minerals Mission | Adaptation finance; agricultural productivity |
Lessons from East Asian Tigers
| Element | South Korea | Taiwan | Singapore | India's Status |
|---|---|---|---|---|
| Land reform | Comprehensive (1949) | Comprehensive (1953) | NA (city-state) | Incomplete |
| Mass schooling | Universal by 1970 | Universal by 1970 | Universal by 1980 | Improving but quality variable |
| Manufacturing share peak | ~32% (1990s) | ~30% | ~30% | ~17% |
| Export orientation | Aggressive | Aggressive | Re-export hub | Mixed; rising |
| Sound macros | Tight, but supportive | Disciplined | Disciplined | Improving |
| FDI policy | Selective at first | Selective | Open | Open since 1991 |
| FTA web | Comprehensive | Limited | Comprehensive | Building |
The lesson: the gap is not in instruments but in execution and consistency. India has the playbooks — what is needed is sustained, two-decade execution.
Indicators to Watch on the Path to Escape
- GDP growth (6.5-7.5%) sustained.
- Manufacturing share rising past 18-20 percent.
- FLFPR reaching 50+ percent.
- R&D spending approaching 2 percent of GDP (currently ~0.7 percent).
- Education spending approaching 6 percent of GDP.
- Logistics cost falling to ~9 percent of GDP.
- Per-capita income crossing USD 4,500 (upper-middle income threshold) by 2028-29.
These KPIs together signal whether India is escaping the late converger stall — or stalling at upper-middle income.
Tell Google you want more of this.
Add Anantam IAS as a preferred sourceOne tap, and this site shows up more often in your own Top Stories, AI Overviews and AI Mode. Remove it any time.