Opens in a new tab
Join Anantam IAS Channel on Telegram

Daily Digest · Friday

3 October 2025 Current Affairs for UPSC

2 current affairs published on Friday, 3 October 2025

3 October 2025 Current Affairs for UPSC — every Why-in-News article AnantamIAS published on Friday, 3 October 2025, broken down with Why in News?, the exact GS paper it feeds, sub-topic mapping, MCQ-ready facts and a UPSC-style practice question. 2 articles in total, covering Polity, Economy, Environment, S&T, IR, Geography, History, Society and Internal Security — the same Why-in-News + GS-paper-mapping + practice-question format the Compass uses across every daily digest on the site.

Daily current affairs for UPSC is where new material enters your prep stream. Read this 3 October 2025 digest end-to-end in 25–35 minutes, attempt the practice question at the foot of each article (it's MCQ for some, 10/15-marker for others), then bookmark the entries that fall inside your active revision window. Everything stays cross-linked: tap any subject pill to jump to that subject's hub, or use the table of contents above to skip straight to a specific story.

Use this page three ways. Read sequentially for a one-sitting scan of everything that mattered on 3 October 2025. Download the 3 October 2025 PDF below for offline study or print revision. Or use the October 2025 Current Affairs compilation to see this day in the month's full context. For the previous day's reading, see 2 October 2025 Current Affairs; the next day's is 4 October 2025 Current Affairs.

Why we publish daily current affairs separately from the monthly compilation: daily is learning, monthly is revision. Use the daily page to add fresh material to your notes the day it breaks; come back to the October 2025 compilation 60 days before Prelims when the noise has settled and only the lasting takeaway is worth re-reading.

Gross Domestic Production(GDP)

Open article →Download PDF

image 3

WhatsApp Image 2025 10 03 at 10.19.40 ddf21a3e

Why in news:

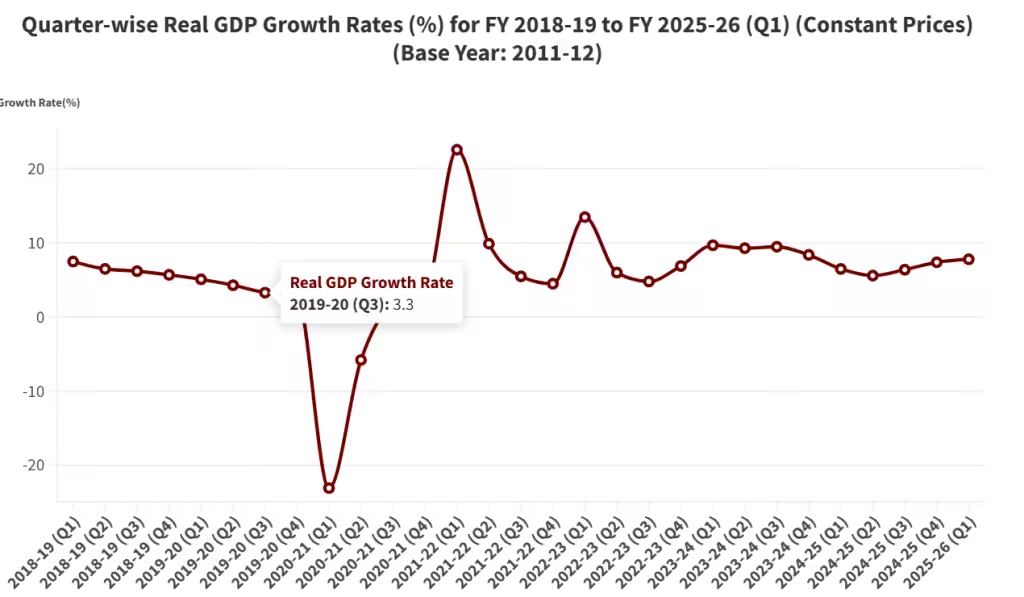
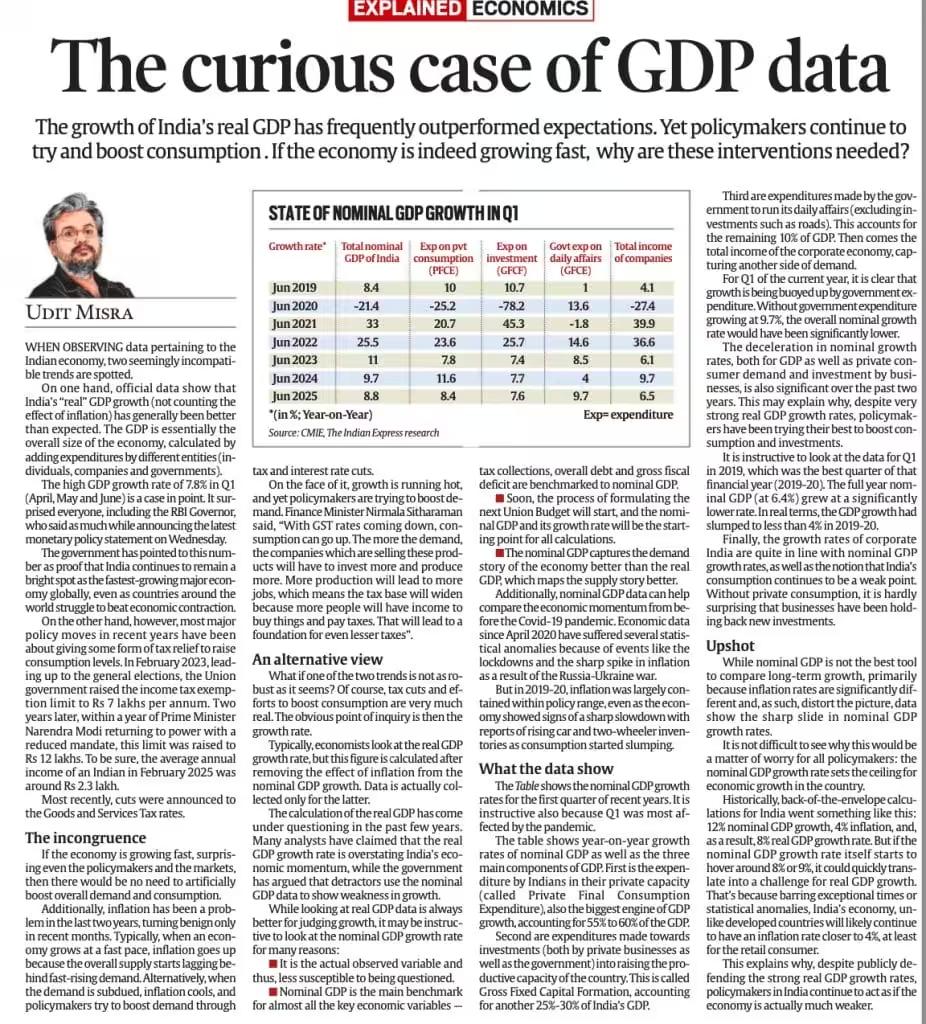
India’s GDP growth data has shown unusual trends — official data suggests that real GDP (after adjusting for inflation) has been growing faster than expected, yet private consumption and investment remain weak, raising questions on the true strength of the economy.
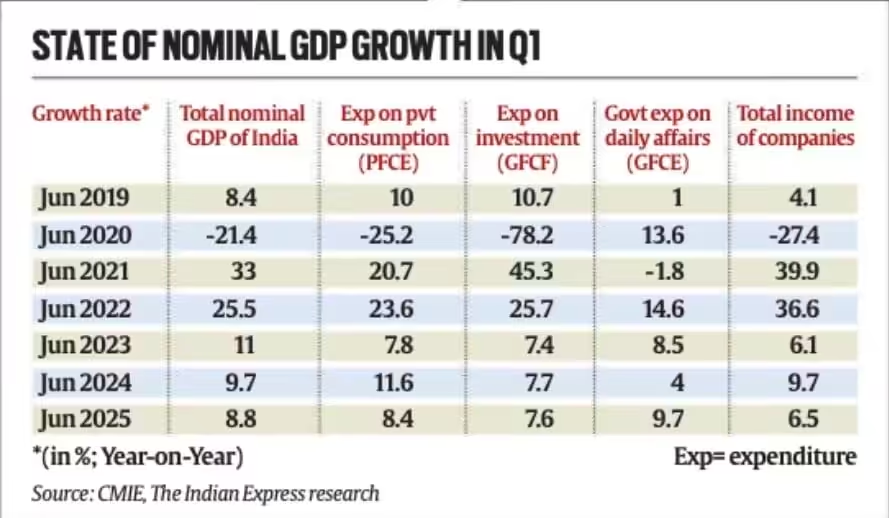
image 5

UPSC Relevance:

GDP, Calculation Methods of GDP, Key Terms of GDP etc.

UPSC PYQ

Q. A rapid increase in the rate of inflation is sometimes attributed to the “base effect”. What is “base effect”? (2011) 

(a) It is the impact of drastic deficiency in supply due to failure of crops  

(b) It is the impact of the surge in demand due to rapid economic growth  

(c) It is the impact of the price levels of previous years on the calculation of inflation rate  

(d) None of the statements (a), (b) and (c) given above is correct in this context 

Q. Explain the difference between computing methodology of India’s Gross Domestic Product (GDP) before the year 2015 and after the year 2015. (2021) 

About GDP:

image
  • According to IMF
    • GDP measures the monetary value of final goods and services—that is, those that are bought by the final user—produced in a country in a given period of time (say a quarter or a year).

Nominal V/s Real GDP

  • Nominal GDP: It refers to the GDP at the current market prices i.e., the GDP is calculated as per the market prices for the year for which the GDP is calculated.
  • Real GDP: It refers to the GDP at base year prices i.e., the GDP is calculated as per the market prices in the base year. Thus, the Real GDP negates the inflation in goods and services.

In case of high rate of inflation, the nominal GDP would be quite higher than the real GDP. However, in case of deflation, the real GDP would be higher than the nominal GDP.

Base Year:

  • Government has formed 26-member Advisory Committee on National Accounts Statistics (NAS) to update the GDP base year from existing 2011-12 to 2022-23.
  • A base year is the reference year whose prices are used to calculate the real growth (minus inflation) in national income. 

GDP can be viewed in three different ways:

  • The production approach sums the “value-added” at each stage of production, where value-added is defined as total sales less the value of intermediate inputs into the production process. For example, flour would be an intermediate input and bread the final product; or an architect’s services would be an intermediate input and the building the final product.
  • The expenditure approach adds up the value of purchases made by final users—for example, the consumption of food, televisions, and medical services by households; the investments in machinery by companies; and the purchases of goods and services by the government and foreigners.
  • The income approach sums the incomes generated by production—for example, the compensation employees receive and the operating surplus of companies (roughly sales less costs).
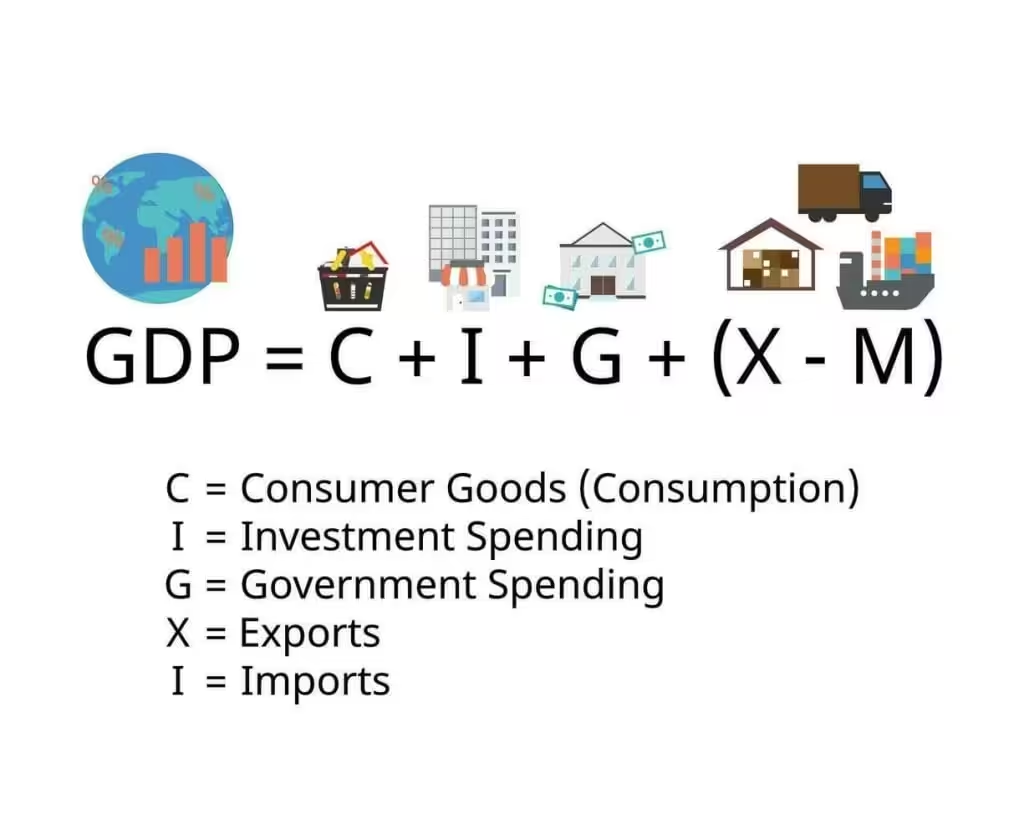
image 1 1

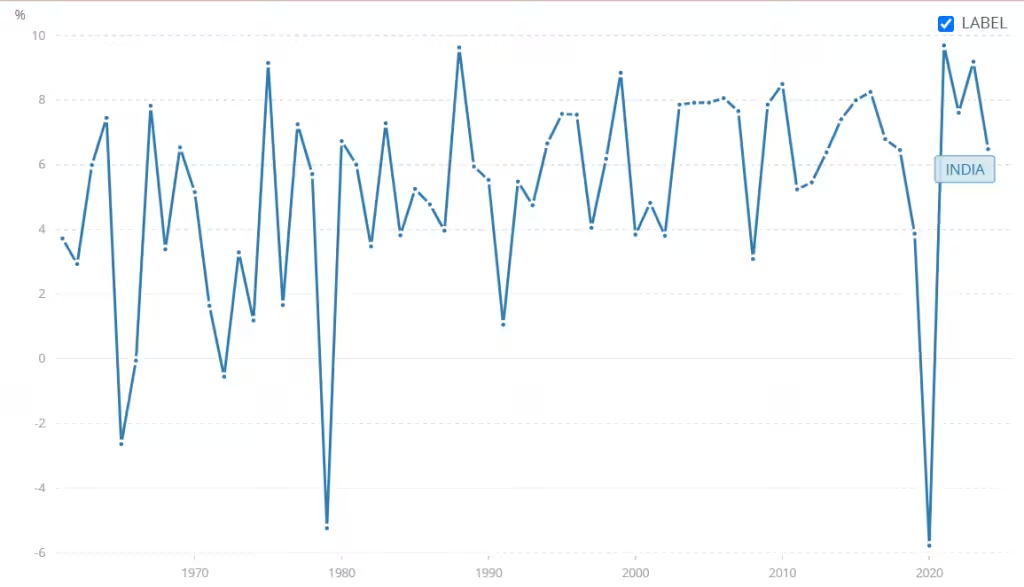
Trend of India’s GDP Growth rate:

image 1

India GDP Growth rate 5 time negative according to world bank:

  • 1965
  • 1966
  • 1972
  • 1979
  • 2020

image 4

E-waste

Open article →Download PDF

image 6

image 5 1

Context:

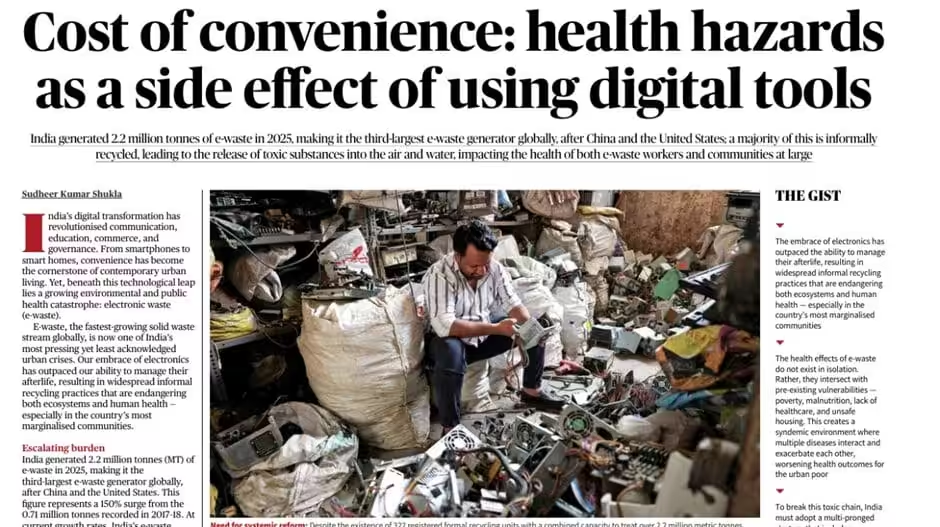
India has generated around 2.2 million tonnes (MT) of e-waste in 2025, making it the third-largest e-waste generator globally.

UPSC Relevance: Environment, hazardous waste.

PYQ:

Q. What are the impediments in disposing of the huge quantities of discarded solid waste which are continuously being generated? How do we safely remove the toxic wastes that have been accumulating in our habitable environment? (2018)

About e-waste:

Status of Electronic Waste in India:

  • As per Global E-waste Monitor , India is the 3rd largest electronic waste producer in the world, generating about 2 million tons of electronic waste annually, with its share increasing by 31%.
  • Around 95% of electronic waste in India is recycled informally by unorganized workers.

Issues with rising electronic waste:

  • Health Hazards: Toxic components like lead and mercury pose risks to human health.
  • Environmental Impact: Unmanaged toxic electronic materials contaminate soil, water and air.
  • Limited Recycling: Low efficiency in end-of-life electronics collection and recycling.
  • Lack of Awareness: Public ignorance about proper electronics disposal methods.

Need for e-waste management

  • Environmental conservation: Improper disposal of waste leads to the release of various harmful toxins like lead, mercury, cadmium, etc.
  • Resource conservation: Recycling obsolete devices reduces the need for new resource extraction as e-waste contains various valuable materials like gold, silver, etc.
  • Economic opportunities: Provide fillip to a circular economy, create employment opportunities and promote entrepreneurship.
  • Sustainable development: Aligns with the principles of environmental, social and economic aspects by promoting environmental stewardship.

Challenges in e-waste management:

  • Poor infrastructure: Shortage of authorised recycling facilities and collection centres leads to waste ending up in unregulated facilities exacerbating environmental degradation.  
  • Absence of a clear mechanism for collecting and transporting discarded electronic waste from consumers to recyclers.
  • Inadequate regulatory design and enforcement compounded by a lack of coordination and cooperation among various stakeholders and authorities involved in electronic waste management.
  • Fragmented supply chain: 95% of waste is recycled by the informal sector, which often operates in unsafe and unregulated working conditions.
  • Lack of reliable information on discarded electronics generation rates, its types making it difficult to plan and implement effective policies and strategies.
  • Lack of awareness: Many consumers and stakeholders are not aware of the environmental and health impacts of end-of-life electronics, or the benefits of proper disposal and recycling.

Government initiatives to tackle e-waste:

  • E-Waste (Management) Rules, 2016: Notified 21 EEE items for e-waste tracking; Promoted Extended Producer Responsibility (EPR) for collection and recycling.
  • E-Waste (Management) Rules, 2022: To protect health & environment by managing electronic waste impacts.
  • CPCB Guidelines: Established lifespan norms for different electronic items to improve e-waste forecasting and management.

Way Forward:

  • Provide market information about scrap electronics prices to create a transparent and competitive market for electronic waste collection and recycling.
  • Incentivizing formal electronic material recycling by providing financial support, tax benefits, subsidies, or recognition to formal electronic waste recyclers.
  • Recognize informal sector as the stakeholder in future discarded electric waste regime and integrating them into the formal system through certification, registration, or partnerships.
  • Strengthen Compliance: Enforcement of e-waste management rules & compliance mechanisms.
  • Enhanced Recycling Infrastructure: Build efficient electronic waste collection and recycling systems.
  • Public Awareness Campaigns: Promote responsible disposal practices among consumers.
  • Producer Accountability: Strengthen EPR compliance for manufacturers and importers.
  • Research and Innovation: Develop eco-friendly technologies for waste processing.
  • Collaboration: Engage local governments, private players and NGOs for comprehensive management.