
Why in News?
On 28 November 2025, the National Statistics Office (NSO) under the Ministry of Statistics and Programme Implementation (MoSPI) released the quarterly GDP estimates for Q2 of FY 2025-26 (July-September 2025). The print became the headline growth number anchoring India’s fiscal and monetary debate through December.
India’s real GDP grew 8.2% in Q2 FY26 against 5.6% in the same quarter a year earlier — a multi-quarter high that reinforced India’s standing as the world’s fastest-growing major economy, led by a buoyant manufacturing and services performance and resilient domestic demand.
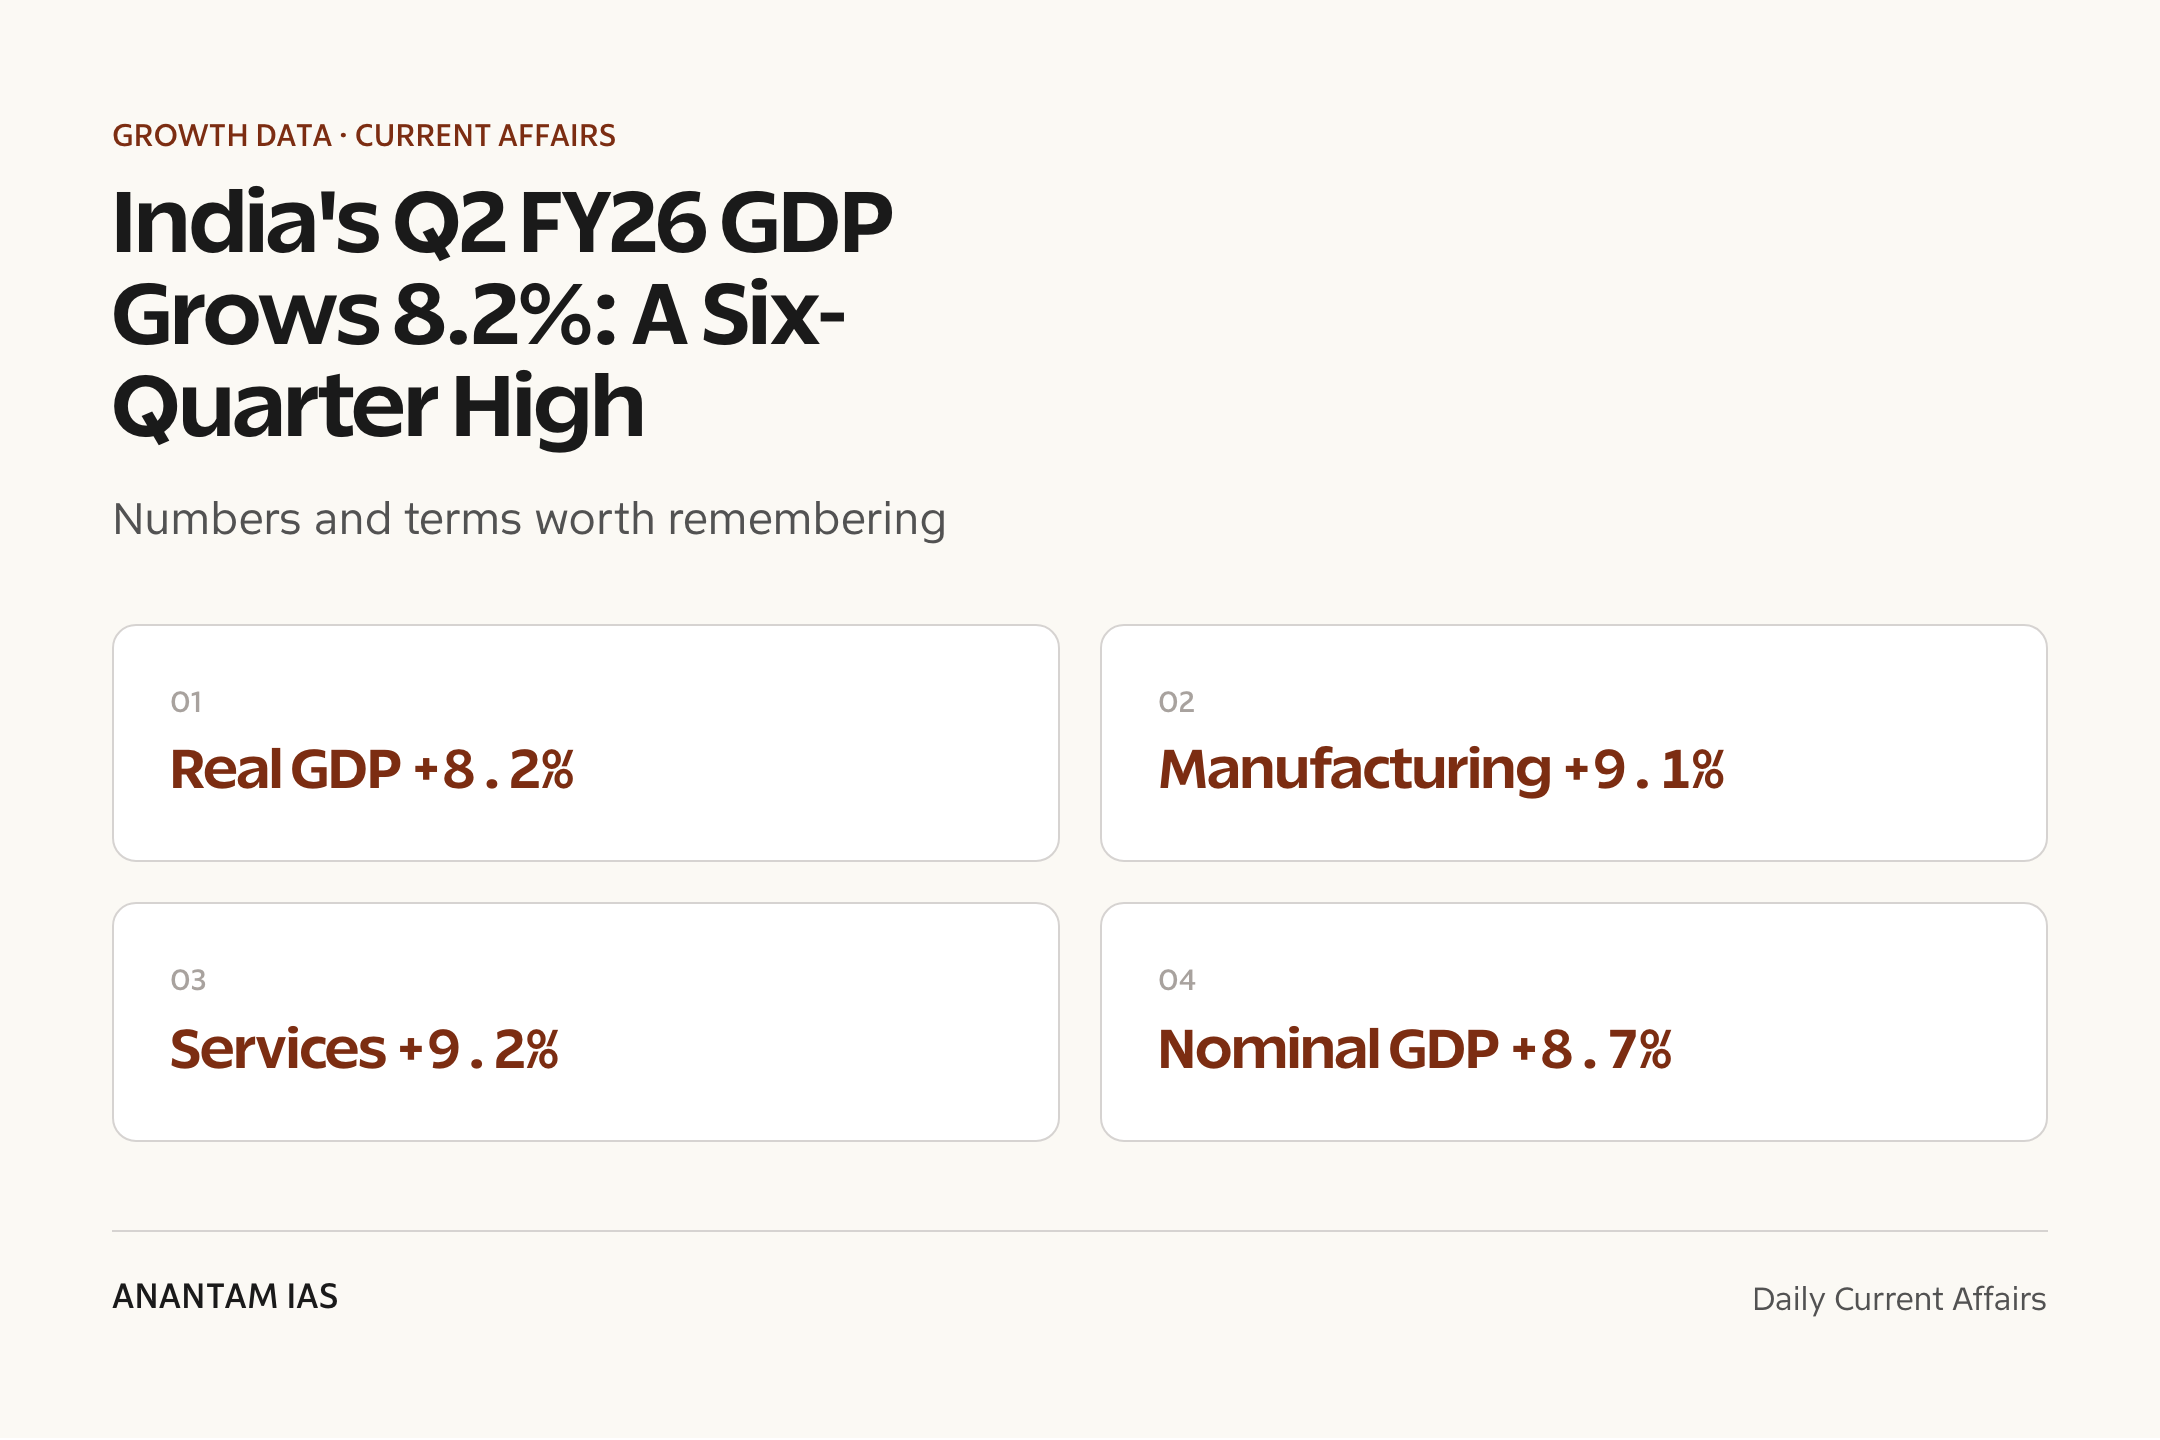
- Real GDP rose 8.2% in Q2 FY26, up sharply from 5.6% in Q2 FY25 (PIB).
- Real GDP at constant (2011-12) prices was ₹48.63 lakh crore, against ₹44.94 lakh crore a year earlier.
- Nominal GDP (current prices) grew 8.7% to ₹85.25 lakh crore.
- Real GVA grew 8.1%; the Secondary (8.1%) and Tertiary (9.2%) sectors led the surge.
- First-half (H1, April-September) real GDP growth stood at 8.0%, versus 6.1% in H1 FY25.
- Business Standard reported the 8.2% reading as a six-quarter high, the strongest since Q4 FY24.
The development matters in the context of:
- GDP data are the single most-watched signal for the RBI’s Monetary Policy Committee and the Union government’s fiscal stance ahead of the Budget cycle.
- Robust prints temper the case for aggressive rate cuts while validating capex front-loading and consumption-support measures such as GST rationalisation.
UPSC Relevance
Prelims Relevance
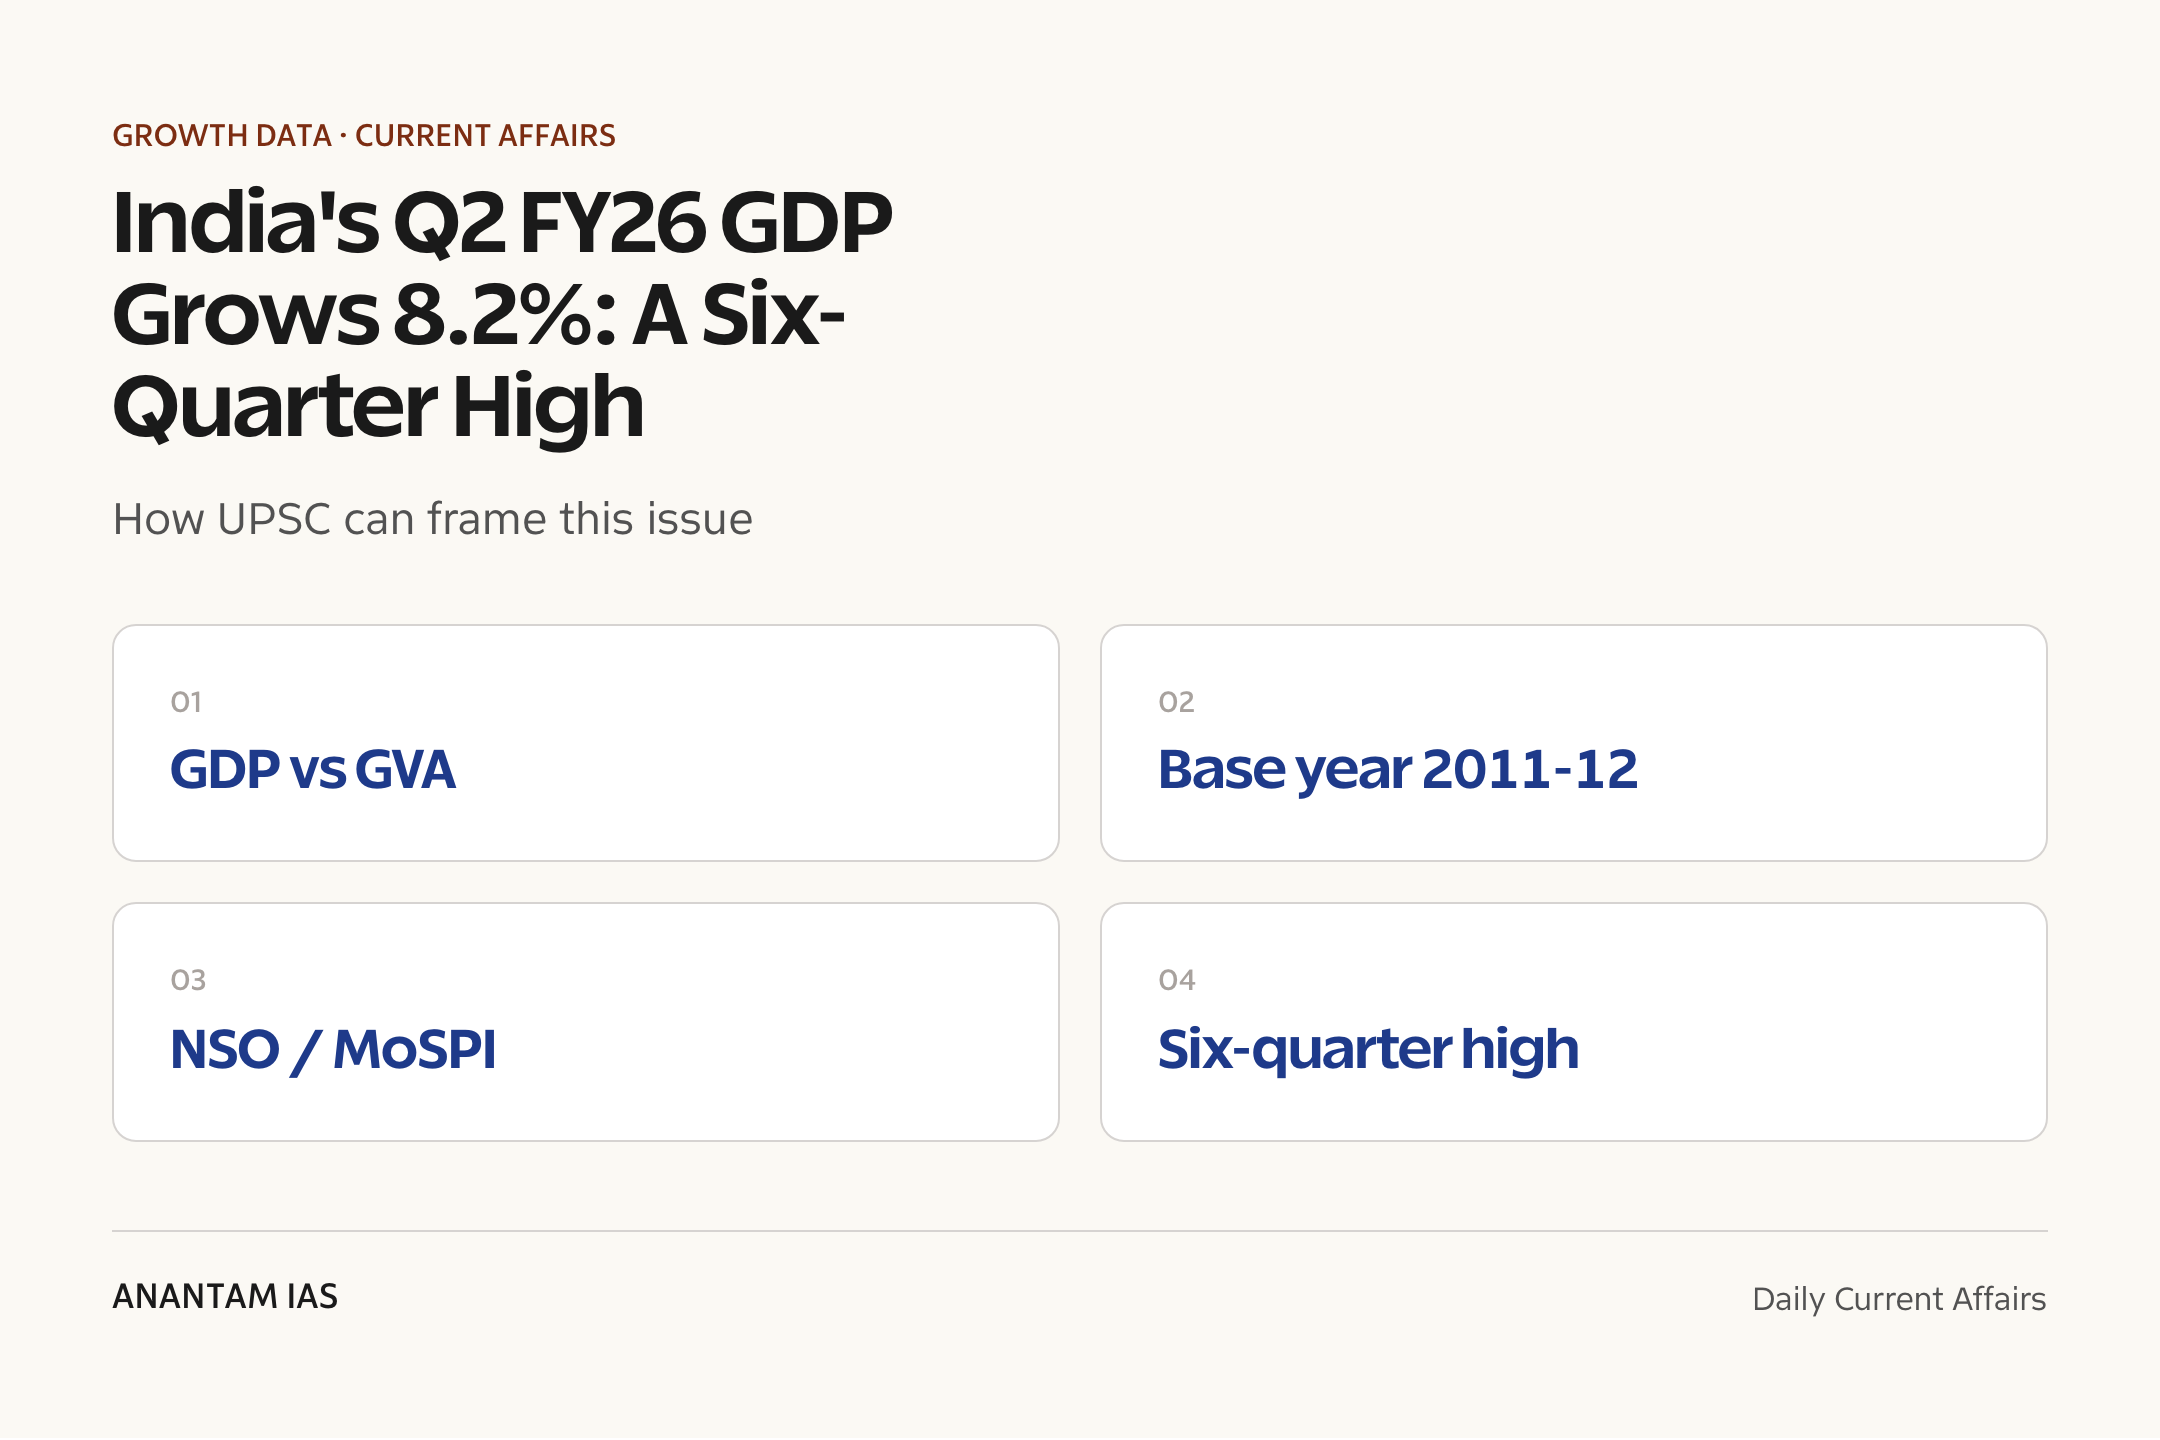
- GDP measured at market prices; GVA measured at basic prices; GDP = GVA + product taxes − product subsidies.
- Real (constant-price) vs nominal (current-price) GDP; current base year is 2011-12.
- GDP estimates compiled by the NSO under MoSPI, using the System of National Accounts framework.
- Benchmark-indicator method used for quarterly estimates.
- Three broad sectors: Primary (agriculture, mining), Secondary (manufacturing, construction, utilities), Tertiary (services).
- Expenditure-side components: PFCE, GFCE, GFCF, exports, imports, valuables, changes in stocks.
- Q2 FY26 manufacturing growth 9.1%; construction 7.2%; agriculture and allied 3.5%.
- MoSPI is revising the National Accounts base year from 2011-12 to 2022-23 (New Series).
Mains Relevance
GS Paper 3
- Growth drivers and the durability of an investment-plus-consumption-led recovery in the Indian economy.
- Role of national-income accounting and the choice of base year in measuring growth credibly.
GS Paper 2
- Statutory and institutional architecture of official statistics (NSO, MoSPI) and the credibility of data governance.
Essay
- Numbers tell only part of a nation’s growth story — measurement, distribution, and lived experience complete it.
Background and Context
What GDP and GVA actually measure
The headline number sits inside the System of National Accounts framework that India follows.
- Gross Domestic Product (GDP) is the money value of all final goods and services produced within a country in a given period, measured at market prices.
- Gross Value Added (GVA) measures output at basic prices — that is, value added before product taxes and after product subsidies.
- The identity linking them: GDP = GVA + (taxes on products − subsidies on products).
- Real GDP strips out price changes using a fixed base year (currently 2011-12), so it shows true volume growth; nominal GDP includes inflation.
- India’s national accounts are compiled by the NSO within MoSPI, broadly aligned with the UN-recommended System of National Accounts (SNA).
The Q2 FY26 headline numbers
PIB confirmed a broad-based acceleration across most aggregates.
- Real GDP grew 8.2% (₹48.63 lakh crore) versus 5.6% (₹44.94 lakh crore) a year earlier.
- Nominal GDP grew 8.7% to ₹85.25 lakh crore — the gap with real growth reflects the benign GDP deflator (low inflation).
- Real GVA grew 8.1% to ₹44.77 lakh crore; nominal GVA grew 8.7%.
- On the demand side, Private Final Consumption Expenditure (PFCE) grew 7.9%, up from 6.4% a year earlier — a sign of reviving household demand.
- For H1 FY26 (April-September), real GDP grew 8.0% against 6.1% in H1 FY25.
Where the growth came from — sectors
Industry and services did the heavy lifting; agriculture moderated.
- Secondary sector (manufacturing, construction, utilities) grew 8.1%, with Manufacturing at 9.1% and Construction at 7.2%.
- Tertiary (services) sector grew 9.2%, led by Financial, Real Estate and Professional Services at 10.2%.
- Agriculture and Allied activities grew a moderated 3.5%; Electricity, Gas and Water Supply utilities grew 4.4%.
- The data were compiled using indicators such as listed-company results, IIP, rail and port traffic, bank credit, and GSTN supply data.
What lifted the print
Commentators tied the surge to a mix of policy and macro tailwinds; treat these as analyst framing, not NSO causation.
- GST rationalisation — the rate restructuring rolled out in 2025 is widely credited with supporting consumption and the manufacturing-services momentum.
- Capex front-loading by the Centre and states early in the year supported construction and investment demand.
- Benign inflation kept the GDP deflator low, widening the gap between brisk real growth and nominal growth.
- A favourable base, resilient services exports, and steady credit growth rounded out the drivers.
Why the number matters for policy
The GDP release is a primary input into both monetary and fiscal decisions.
- It shapes the RBI Monetary Policy Committee’s read on the output gap and the room for rate action.
- It informs the Union government’s fiscal arithmetic and revenue projections in the run-up to the Budget.
- It is the denominator for headline ratios — the fiscal deficit, debt, and tax buoyancy are all expressed as a share of GDP.
- A strong print reinforced India’s position as the fastest-growing major economy in global comparisons.
Caveats and the base-year revision
Quarterly estimates are provisional and the entire series is being rebased.
- Quarterly GDP uses the benchmark-indicator method and is revised as fuller data arrive from source agencies.
- MoSPI is shifting the National Accounts base year from 2011-12 to 2022-23, so these numbers will be revised under the New Series.
- GDP captures market output but not distribution, informal-sector stress, or unpaid work — high aggregate growth need not mean broad-based gains.
- The discrepancy term — the gap between the production and expenditure approaches — should be watched in any single-quarter reading.
Way Forward
Sustain the investment cycle
- Keep public capex credible and crowd in private investment so growth does not lean only on government spending.
- Deepen manufacturing momentum through stable trade and input-cost policy.
Broaden the base
- Translate aggregate growth into jobs, rural demand, and MSME revival so gains are widely shared.
- Watch agriculture, which moderated, and protect rural consumption.
Strengthen the statistics
- Complete the base-year revision to 2022-23 transparently and improve informal-sector data coverage to keep estimates credible.
Conclusion
The 8.2% Q2 FY26 print is a genuinely strong reading — broad-based across manufacturing and services, backed by reviving private consumption, and consistent with India remaining the fastest-growing major economy.
For the UPSC aspirant the durable takeaway is not the single number but the machinery behind it: how GDP and GVA are defined, who compiles them, the base-year question, and why a headline figure must be read alongside distribution and the impending New Series revision.
UPSC Practice Questions
Prelims MCQ 1
With reference to the measurement of national income in India, consider the following statements:
- GDP at market prices equals GVA at basic prices plus product taxes minus product subsidies.
- Quarterly GDP estimates are released by the Reserve Bank of India.
- Real GDP is measured at constant prices of a chosen base year.
How many of the above statements are correct?
(a) Only one (b) Only two (c) All three (d) None
Answer: (b) Only two
Explanation:
Statements 1 and 3 are correct. Statement 2 is wrong — quarterly GDP estimates are released by the NSO under MoSPI, not the RBI.
Prelims MCQ 2
India’s real GDP growth in Q2 of FY 2025-26 (July-September 2025), as estimated by the NSO, was:
(a) 5.6% (b) 7.2% (c) 8.2% (d) 9.1%
Answer: (c) 8.2%
Explanation:
Real GDP grew 8.2% in Q2 FY26 against 5.6% in Q2 FY25. 9.1% was the manufacturing-sector growth rate; 7.2% was construction.
UPSC Mains Questions
- India’s Q2 FY26 GDP grew 8.2%, a multi-quarter high led by manufacturing and services. Examine the drivers of this acceleration and assess how durable an investment-and-consumption-led recovery is likely to be.
- A high aggregate GDP growth rate does not automatically translate into broad-based welfare. Critically discuss the limitations of GDP as a measure of economic progress and the reforms needed in India’s national-income accounting.
Sources: PIB, Ministry of Statistics and Programme Implementation and Business Standard.
Frequently Asked Questions
How much did India’s GDP grow in Q2 FY26?
India’s real GDP grew 8.2% in the second quarter of FY 2025-26 (July-September 2025), up from 5.6% a year earlier, according to NSO data released by PIB on 28 November 2025. In value terms, real GDP rose to ₹48.63 lakh crore at constant 2011-12 prices.
Who releases India’s GDP data?
GDP estimates are compiled and released by the National Statistics Office (NSO), part of the Ministry of Statistics and Programme Implementation (MoSPI). The estimates follow the UN-recommended System of National Accounts and are published quarterly, half-yearly, and annually.
What is the difference between GDP and GVA?
GVA (Gross Value Added) measures output at basic prices — the value added by producers before product taxes and after subsidies. GDP at market prices equals GVA plus product taxes minus product subsidies. GVA shows the supply-side or sectoral picture; GDP captures the whole economy at market value.
Which sectors drove the Q2 FY26 growth?
The surge was led by the secondary sector at 8.1% — with manufacturing at 9.1% and construction at 7.2% — and the tertiary (services) sector at 9.2%, paced by financial, real estate and professional services at 10.2%. Agriculture and allied activities grew a more moderate 3.5%.
Why is this GDP number called a six-quarter high?
Business Standard reported the 8.2% reading as the strongest growth in six quarters, meaning it exceeded every quarterly print since early 2024. The jump from 5.6% a year earlier reflected stronger industry and services output and reviving private consumption.
What is the base year used for India’s GDP?
India currently measures real GDP at constant 2011-12 prices. MoSPI is in the process of revising the National Accounts base year to 2022-23 (a New Series), so future estimates — and revisions of current figures — will be reported on the updated base.
Tell Google you want more of this.
Add Anantam IAS as a preferred sourceOne tap, and this site shows up more often in your own Top Stories, AI Overviews and AI Mode. Remove it any time.