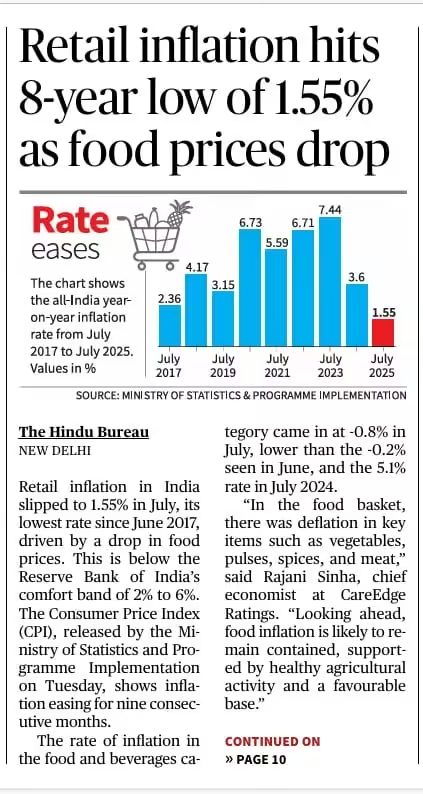
Retail inflation in India slipped to 1.55% in July, its lowest rate since June 2017, driven by a drop in food prices. This is below the Reserve Bank of India’s comfort band of 2% to 6%. The Consumer Price Index (CPI), released by the Ministry of Statistics and Programme Implementation.
UPSC Relevance:
UPSC CSE in prelims and mains examination has focused on inflation, causes of inflation and it’s impacts. UPSC had asked multiple questions related to inflation. A case in point is a following PYQ.
UPSC Prelims PYQ 2022:
In India, which one of the following is responsible for maintaining price stability by controlling inflation?
(a) Department of Consumer Affairs
(b) Expenditure Management Commission
(c) Financial Stability and Development Council
(d) Reserve Bank of India
UPSC Prelims PYQ 2022:
With reference to the Indian economy, consider the following statements:
1. If the inflation is too high, Reserve Bank of India (RBI) is likely to buy government securities.
2. If the rupee is rapidly depreciating, RBI is likely to sell dollars in the market.
3. If interest rates in the USA or European Union were to fall, that is likely to induce RBI to buy dollars.
Which of the statements given above are correct?
(a) 1 and 2 only
(b) 2 and 3 only
(c) 1 and 3 only
(d) 1, 2 and 3
About Inflation:
According to IMF: Inflation measures how much more expensive a set of goods and services has become over a certain period, usually a year
OR,
It refers to a sustained rise in general level of prices over a period of time in the economy.
Terminologies:
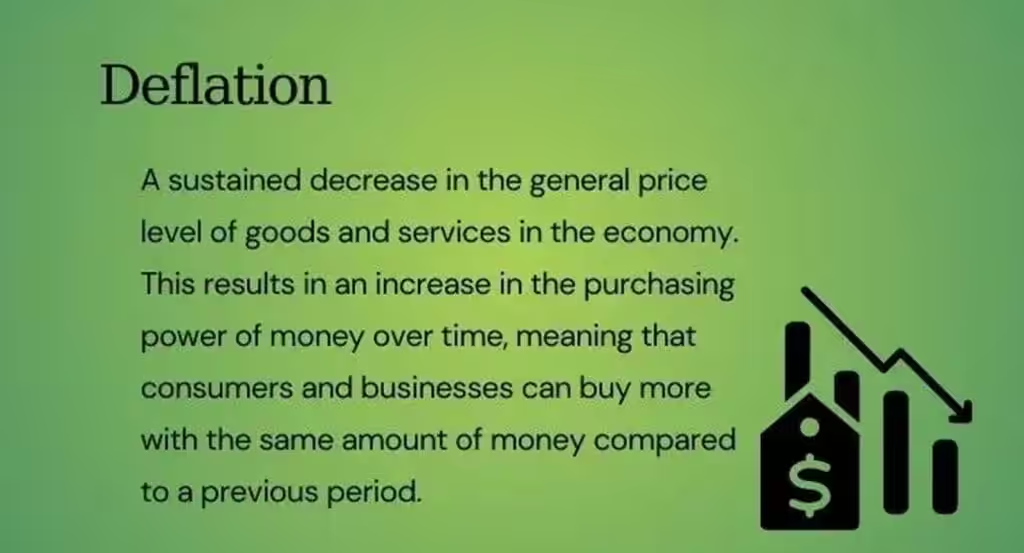
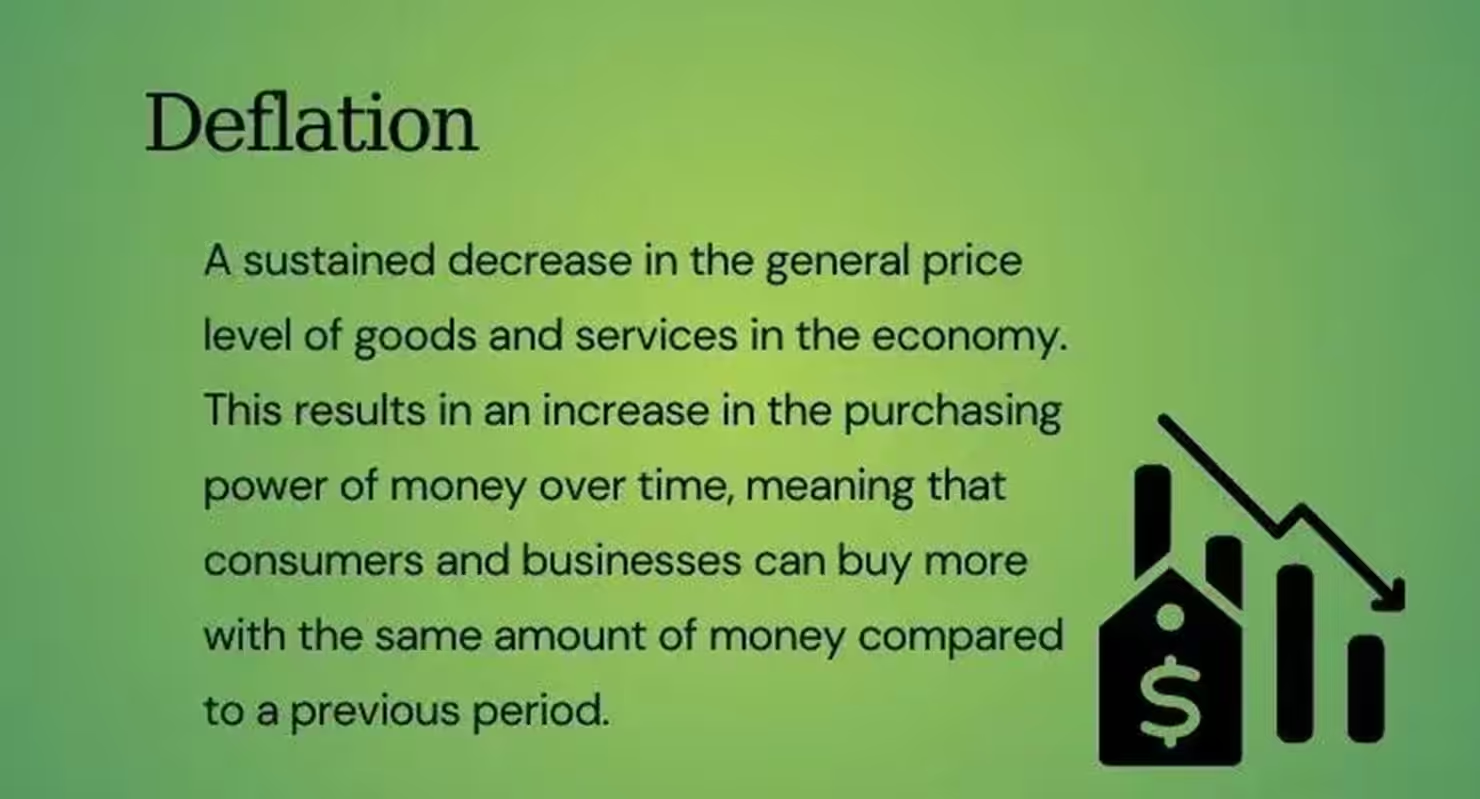
Deflation: Deflation in the context of India refers to a sustained decrease in the general price level of goods and services in the economy.
2. Disinflation: It means slowing down of rate of inflation
Whereas deflation is negative economic growth, such a -5%, disinflation is simply a reduction in the inflation rate. For instance, the inflation rate can fall from 9% in one year to 7% in the next year. It occurs when the rate at which prices are rising is diminishing.
Example:
3. Skewflation:
General price rise over a sustained period of time is skewed to one or a small group of commodities.
For example, in India, skewflation was witnessed in 2009 and 2010 when food prices showed inflation, and the prices of non-food items were majorly stable.
Factors:
Change in Monetary Policy
Fiscal Stimulus
supply chain issue etc.
4. Hyperinflation:
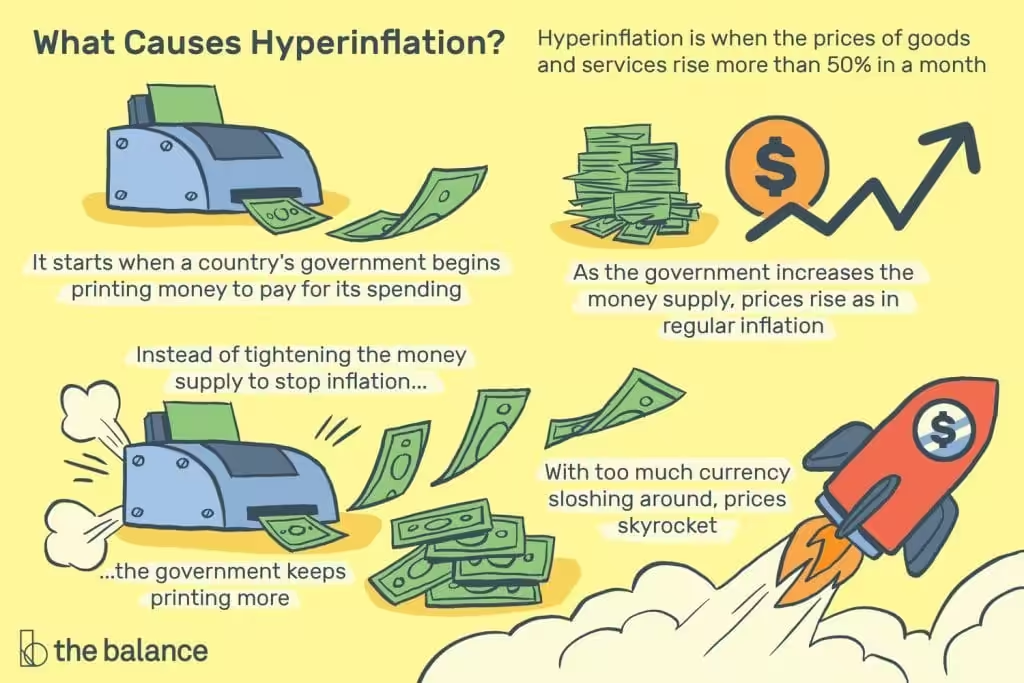
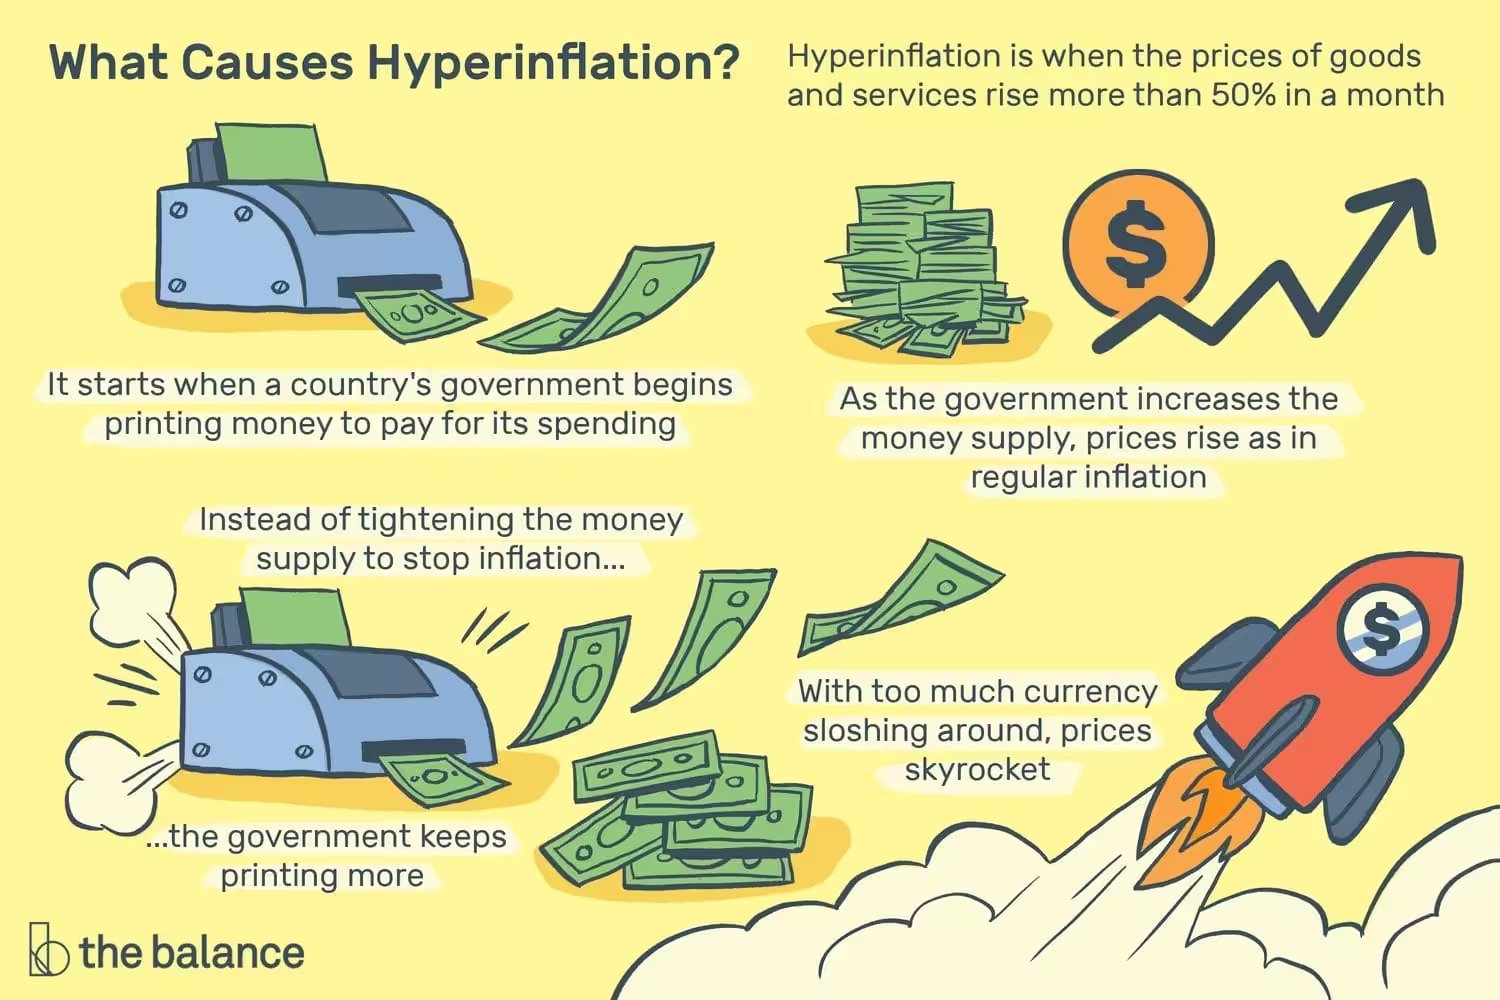
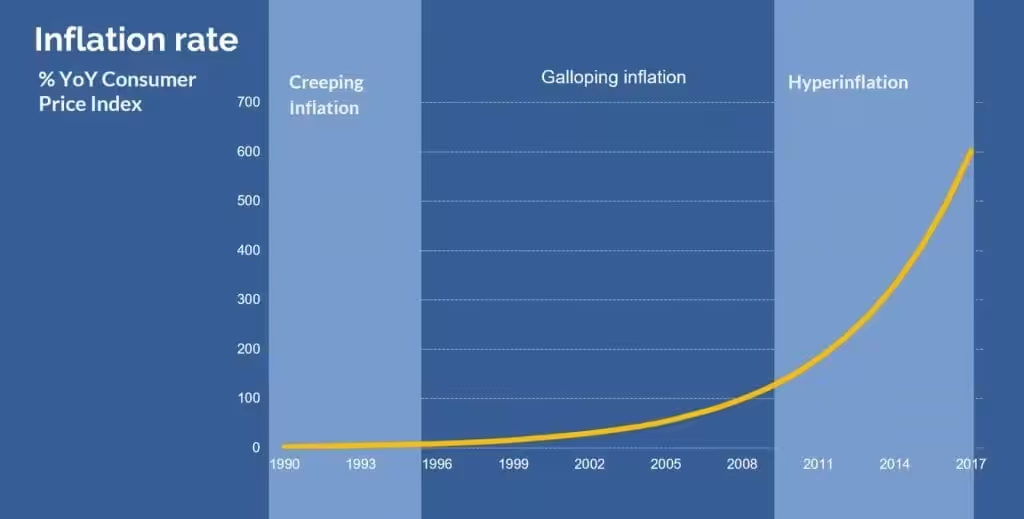
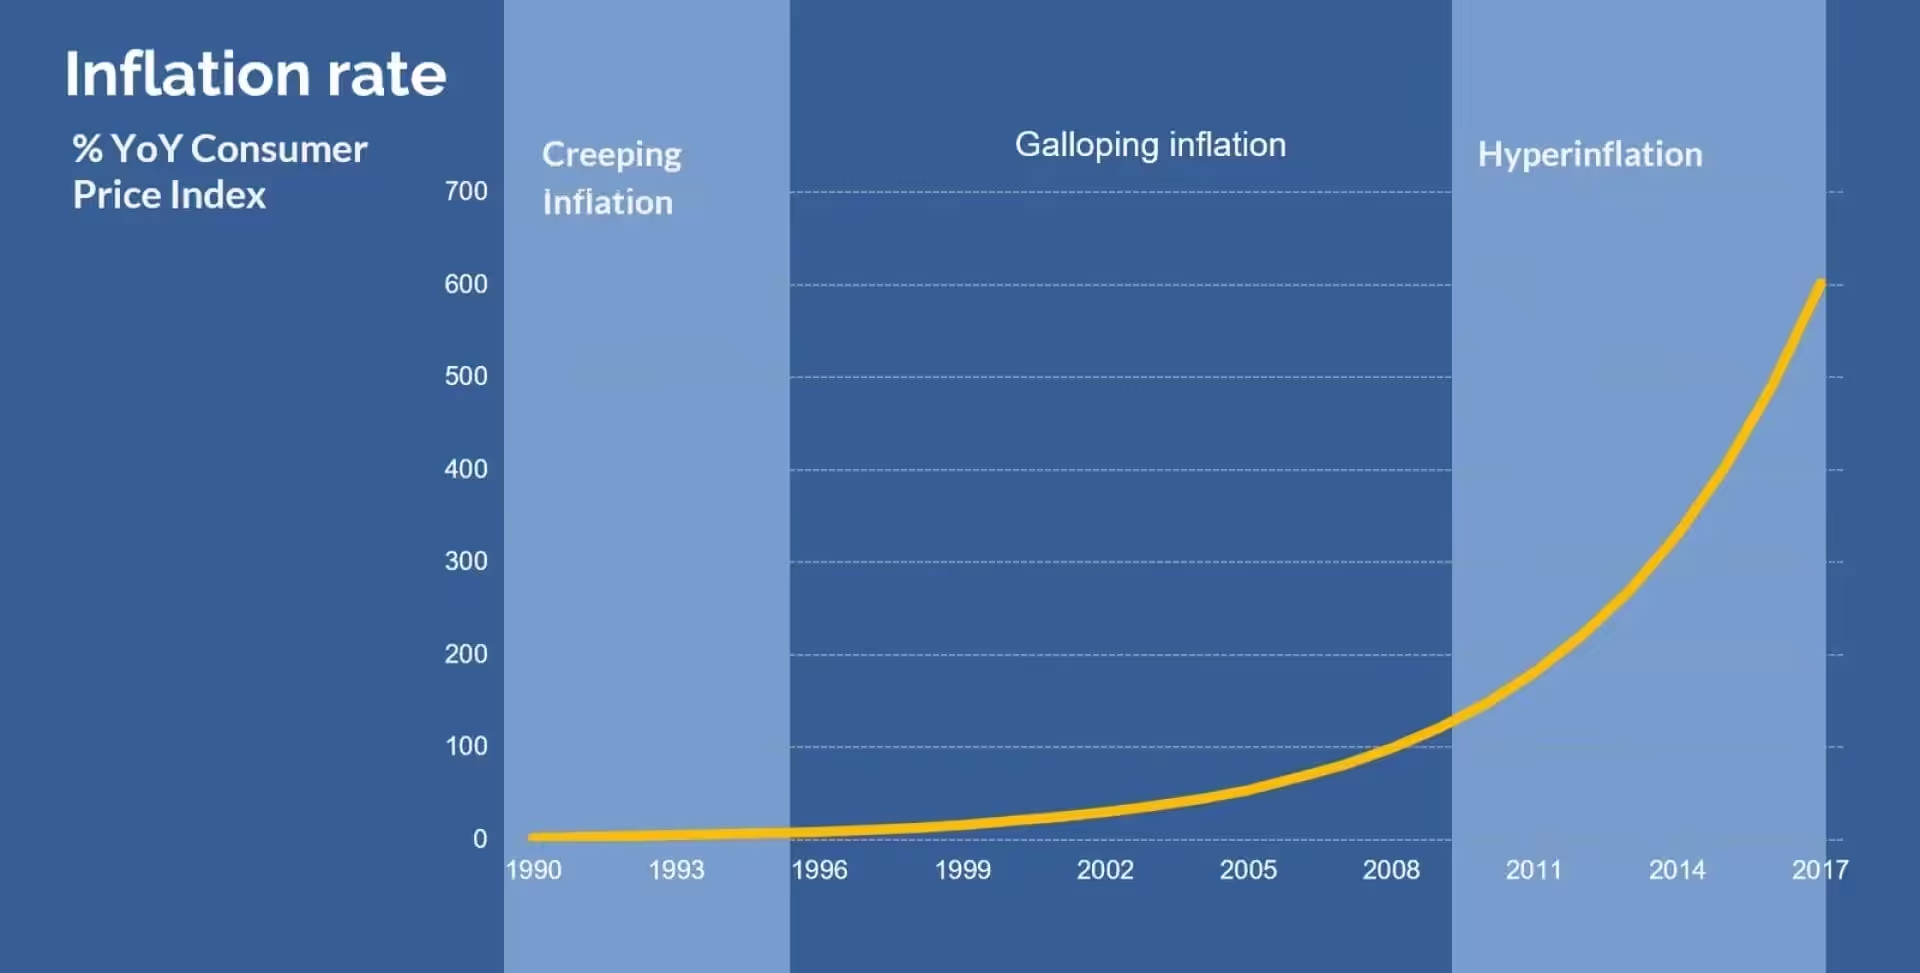
Hyperinflation is large and accelerating inflation, when prices rise by more than 50% a month. During hyperinflationary periods, the price level increases by about 500% to 1000% per year.
5. Creeping Inflation:
It refers to gradual rise in price levels along time. (good for the economy).
For example, the inflation rate rises from 2% to 3%, to 4% a year.
6. Bottleneck Inflation:
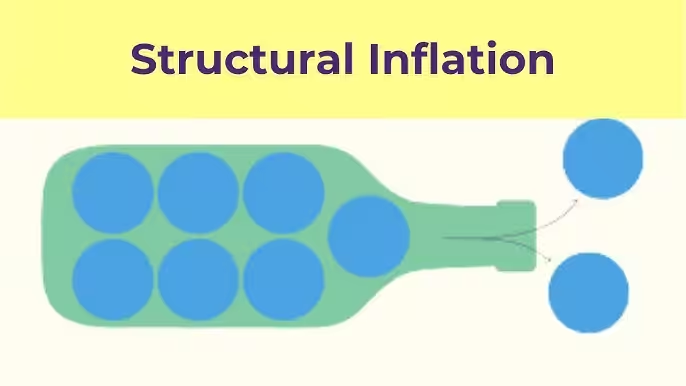
Also called as structural inflation it occurs when supply falls drastically and the demand remains at the same level.
7. Galloping inflation:
when prices increase more than creeping inflation but not as much as hyperinflation. For instance, if a country experiences an inflation rate of around 20%, this would be considered galloping inflation because it’s far more than creeping inflation but not as high as hyperinflation at more than 50%.
Common causes can include sudden increases in essential consumer products, such as oil, or significant bumps in employee wages, which result in higher prices.
8. Stagflation:
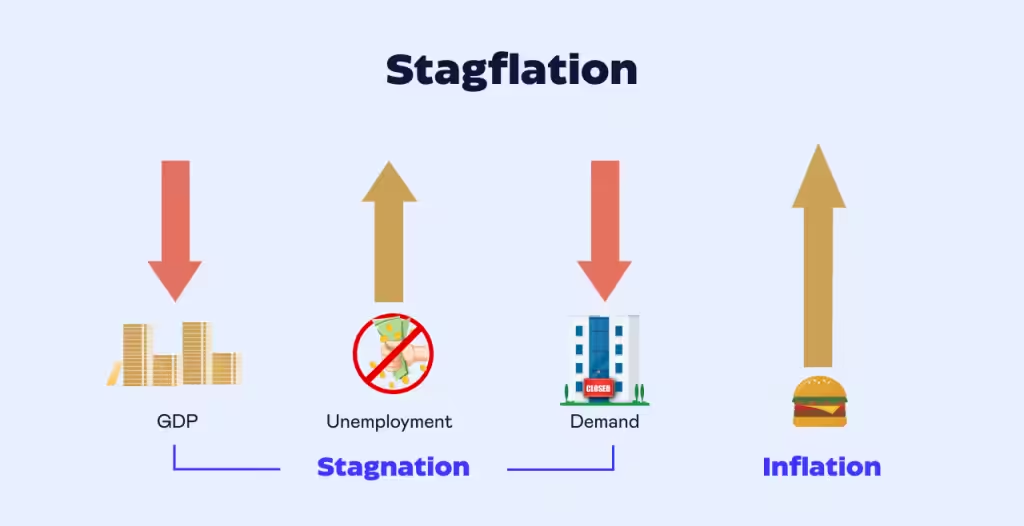
Stagflation is an economic event in which the inflation rate is high, economic growth rate slows, and unemployment remains steadily high. Such an unfavorable combination is feared and can be a dilemma for governments since most actions designed to lower inflation may raise unemployment levels, and policies designed to decrease unemployment may worsen inflation.
Phillip Curve:
Phillip Curve shows the inverse relation between inflation and unemployment. As levels of unemployment decrease, inflation increases.
Types of Inflation:
On the basis of Causes:
Demand-Pull Inflation: Demand-Pull Inflation also known as Excess Demand Inflation takes place when aggregate demand for a good or service outstrips aggregate supply. In other words, when aggregate demand for all purposes- consumption, investment and government expenditure-exceeds the supply of goods at current prices then it is called Demand-Pull Inflation. Demand-Pull inflation gives rise to a situation often economists describe as “Too much money chasing too few goods”.
Cost-Push Inflation: When prices rise due to growing cost of production of goods and services then it is known as Cost-Push Inflation. Cost-push inflation also came to known as “New Inflation” is determined by supply-side factors mainly caused by higher wage-push, Profit-Push and higher costs of raw materials.
Scarcity Inflation: Scarcity inflation occurs due to hoarding by unscrupulous traders and black marketers so as to create an artificial shortage of essential goods like food grains, kerosene, etc. with an intension to sell them only at higher prices to make huge profits.
How to Measure Inflation:
Inflation rate can be measured using either Wholesale Price Index (WPI) or Retail Price Index, which is generally known as Consumer Price (CPI). In many countries, Producers’ Price Index (PPI), in place of WPI, is used to measure Inflation rate. Inflation rate based on PPI or WPI indicate increase in cost of production whereas the rate based on CPI shows a sign of burden on consumers pocket also.
Consumer Price Index?
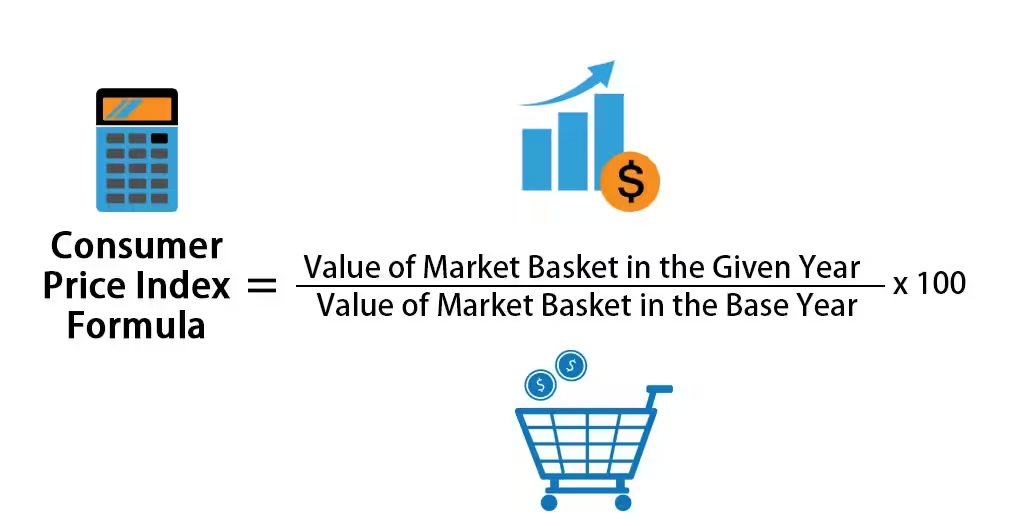
The Consumer price index or CPI is a measure of market changes in prices over time. It is calculated as the average price of a basket of goods and services.
The index is only a conditional cost-of-living measure and does not account for social or environmental factors.
CPI Urban:- The Index is a statistical estimate of how much an average urban household spends on goods and services each year.
CPI Rural:- It would provide the price changes for the entire rural population of the country, a total of 1181 villages have been selected at all India level.
CPI is used to monitor the cost of living and determine economic conditions.
We can measure the rate of inflation and deflation using CPI.
The CPI reflects changes in prices on an individual level during inflation and measures overall inflation.
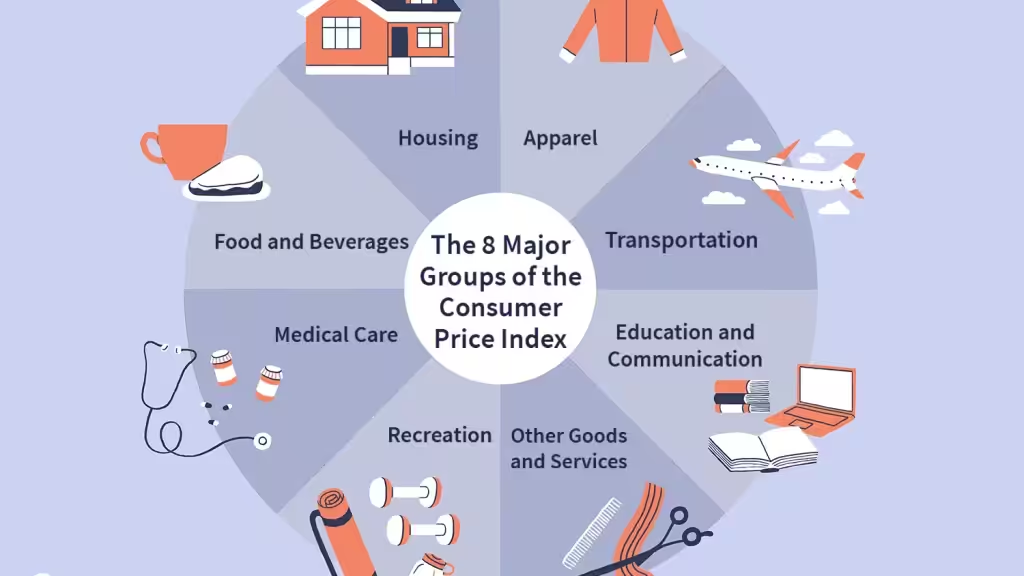
The CPI is based on the weighted average retail prices of eight categories of goods and services. Education, garments, communication, transportation, and medical care.
Calculated by- National Statistical Office, Ministry of Statistics and programme Implementation
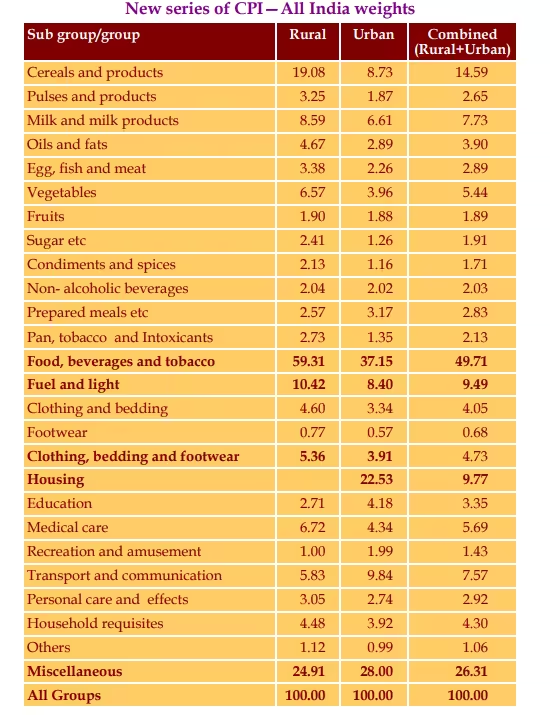
Weightage:- Food and beverages (45.86%)Pan, Tobacco and Intoxicants (2.38%) Clothing and Footwear (6.53%)Housing (10%)Fuel and Light (6.84%): Electricity, LPG, Kerosene etc. (Does not include Petrol and Diesel)Miscellaneous- Education, Healthcare, Transportation and Communication etc. (28.32%)
How to Calculate?
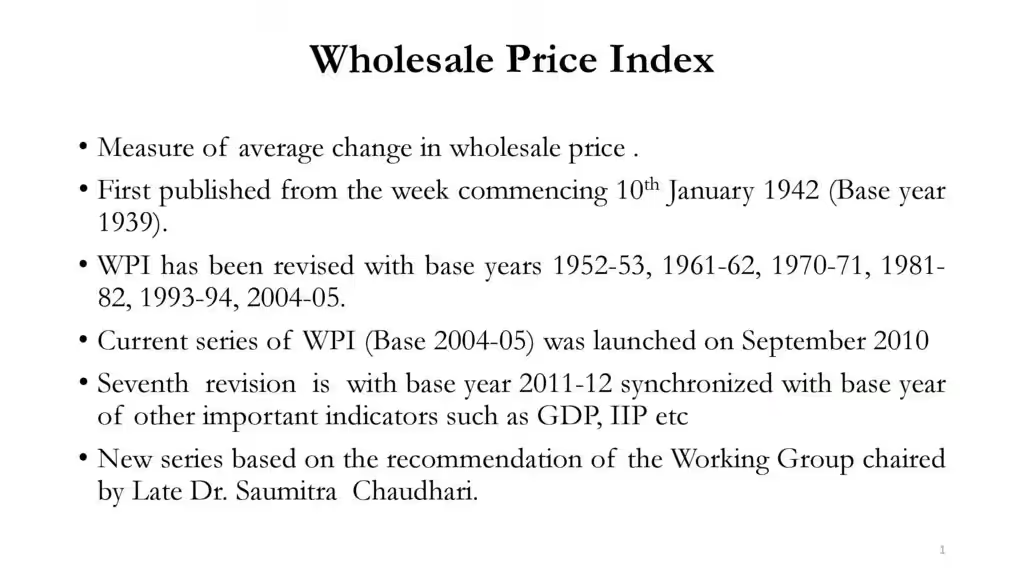
Wholesale Price Index?
The Wholesale Price Index is the central measure of inflation in some countries, including the United States. The WPI measures changes in the wholesale prices of a representative basket of goods.
The WPI is very important in helping the government take necessary action against inflation.
It is important to understand that the wholesale price index is not the same as the retail prices of these goods, so excessive wholesale price inflation can negatively impact the economy and household finances.
The wholesale price index is used in monetary and fiscal policies.
It measures the price increases and decreases of goods in the primary market before reaching the retail sector.
The WPI covers a much larger scale than the CPI, more targeted toward the retail market.
Calculated By- Office of Economic Advisor, Ministry of Commerce and Industry.
Weightage:- Primary Articles: (22.6%)Manufactured products (64.2%)Fuel and Power (13.2%)
How to Calculate?
Generally, the WPI consists of industrial and agricultural goods.
The WPI uses the total costs of goods in a base year, 100. Then, it compares the prices from another year to the base-year total, and the difference is written down as a percentage.
Difference:
Comparison
WPI
CPI
Measurement
Measures the average change in prices received by domestic producers for their output
Measures average change in prices of goods and services consumed by households
Indicator of Inflation
The leading indicator of inflation
Lagging indicator of inflation
Coverage and Sample Size
Covers a smaller sample of goods and services
Covers a broader range of goods and services used by households
Purpose
Mainly used to track inflation in the wholesale market
Primarily used for tracking inflation in the consumer market
Components
Includes prices of primary articles and fuel
Includes prices of food, housing, clothing, transport, medical care, etc.
Weightage
It gives a higher weightage to primary articles and fuel
It provides a higher weightage to food and housing
Base Year
2011-12
2012
Impact on Monetary Policy
Direct impact on monetary policy
Indirect impact on monetary policy
Note: WPI is used as a Price Deflator while CPI is used as a measure of inflation by the RBI.
Food Inflation:
Significance:
For urban households, the share of food expenditure is 39.2%.
Food comprises 45.86 % weightage in consumer price index.
Major cause of headline inflation
Food purchases made 46.5% of the total expenditures rural households made in 2022-23.
Factors contributing to recent trends:
Favourable monsoon with more than average rainfall leading to bumper harvests.
Early onset of monsoon leading to higher sown area under kharif crops.
Reduced or zero import duties on pulses and vegetable oils ensures abundant supply of the same in the domestic market. [ Pulses are imported despite India being the largest producer of pulses, due to high demand for pulses. ]
Causes of concern:
Weakening or stalling of monsoon in coming weeks may affect the crop growth and yield.
Lower stocks of fertilisers despite rising demand due to fall in imports of fertilisers mainly from China owing to China’s export restrictions on phosphatic fertilisers.
Factors affecting food inflation:
Upstreams:
Monsoon pattern
Extreme weather events like flash floods, hailstorms, cloud bursts etc.
Price and supply of fertilisers and other inputs like electricity.
Rural labour wages working in farms.
Cropping patterns biased towards wheat and rice and dependent on MSP announcement often causing Cob web phenomenon.
Downstreams:
Demand of protein-rich items due to rising income and nutritional intelligence and subsequent mismatch in supply.
Availability of food processing and storage infrastructure to preserve perishables.
Supply chain linkages and bottlenecks like transportation, marketing and distribution of agricultural produce.
Black Marketing and Hoarding creating artificial scarcity causing prices to increase.
Measures:
Developing cold storage, food processing and warehousing infrastructure at local levels to reduce post harvest losses under schemes like Pradhan Mantri Kisan Sampada Yojana.
Fork to farm strategy – Increasing production of crops like pulses as per customer preferences.
Promoting Farmers Producer Organisation to increase farmer’s bargaining power and ensure proper value of crops to farmers enabling them to diversify from wheat and rice.
Promoting Research in climate resilient high yielding varieties of fruits, vegetables, oilseeds and pulses under Prime Minister Dhan-Dhaanya Krishi Yojana (PMDDKY) and Clean Plant Programme (CPP) for horticulture, which focuses on providing high-quality, virus-free planting material to increase yields
Developing extension services like weather forecast to prevent loss due to variable climate.
Amend Essential Commodities Act 1955 allowing for development of private storage infrastructure and ensuring government intervention only during exceptional price rise.
Providing farmers options to sell their produce outside Agricultural Produce Market Committees. Promoting e-NAM portal to sell their produce throughout India.
Diversifying sources of fertilisers and promote domestic fertiliser industries to reduce dependence on countries like China.
Promoting organised Food retail via stores like Safal, Big bazaar and via e commerce like Grofers.
Practice Question: (UPSC PYQ)
Consider the following statements:
The weightage of food in Consumer Price Index (CPI) is higher than that in Wholesale Price Index (WPI).
The WPI does not capture changes in the prices of services, which CPI does.
Reserve Bank of India has now adopted WPI as its key measure of inflation and to decide on changing the key policy rates.
Which of the statements given above is/are correct?
UPSC Content Team Head · Web Developer & Designer · AnantamIAS
Recognized as one of India’s best content marketers, Gaurav Tiwari is an SEO strategist, WordPress developer, and founder of Gatilab. He builds websites that load in under a second, creates content that ranks on Google’s first page, and develops WordPress plugins and tools used on thousands of live sites.
Specialises in · Writing, web development, design — UPSC prep toolingExperience · 16+ yearsVisit website ↗