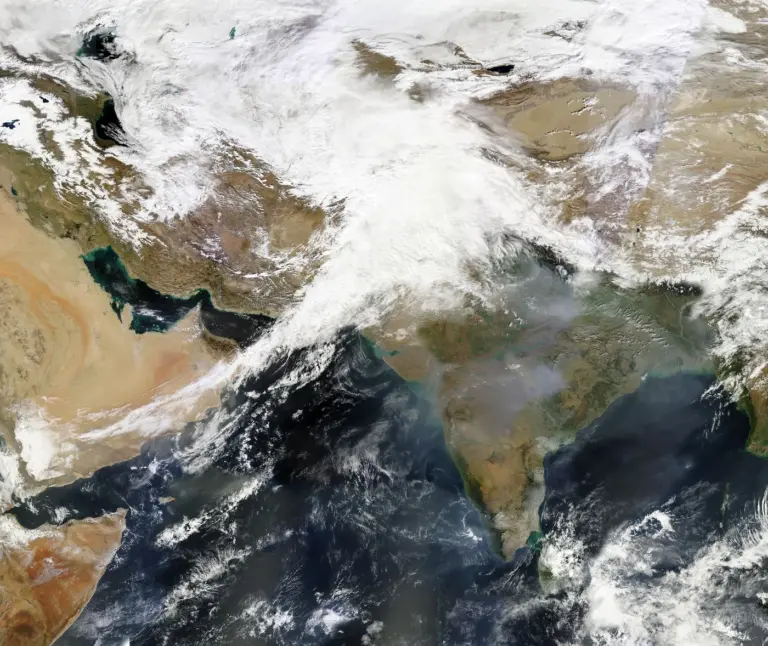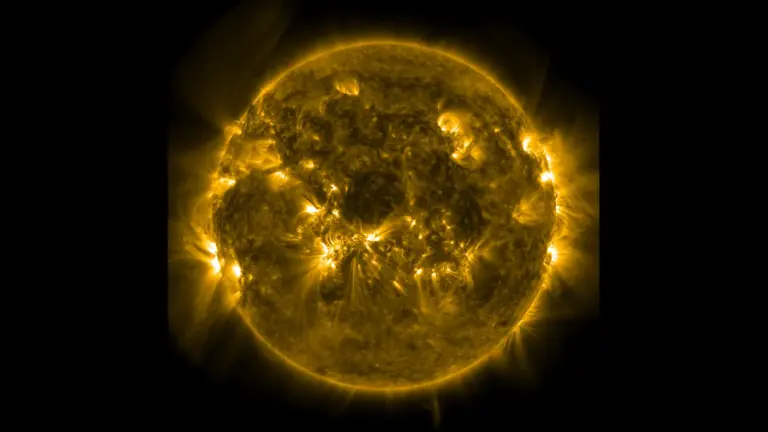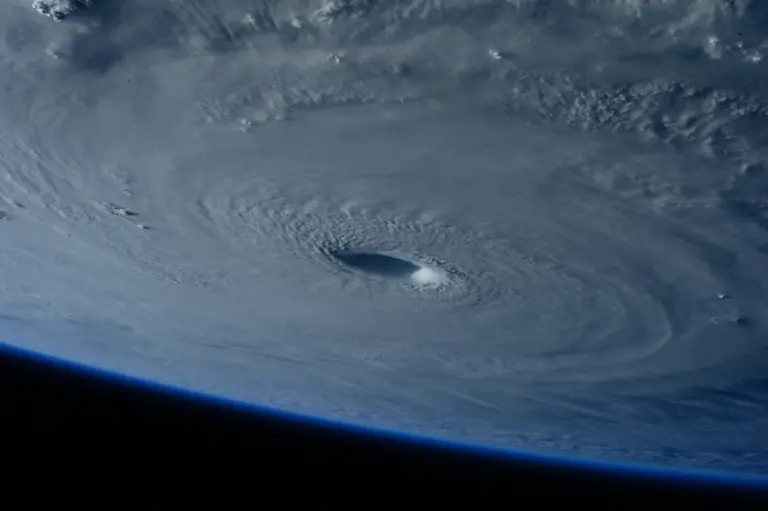
Almost everything you can name in physical geography — the trade winds, the monsoon, ocean currents, deserts, glaciers, even the difference between a January morning in Delhi and one in Chennai — traces back to a single, lopsided fact: the Sun does not heat the Earth evenly. The energy arriving from the Sun is called insolation, short for incoming solar radiation, and it is the master switch behind temperature, pressure, wind and rain. Get insolation right, and the rest of climatology stops being a list of disconnected facts and becomes a chain of consequences.
So this is where any serious study of the atmosphere has to begin. We will follow the energy from the top of the atmosphere down to the ground and watch how it is shared out in the heat budget; then look at the seven controls that decide why one place is warmer than another; then see how temperature changes as you climb into the air and as you travel across a map; and finally fold in humidity, because heat and moisture are two sides of the same coin and the exam loves the relationship between them.
What Insolation Is and How the Heat Budget Balances
Insolation is the solar energy received per unit area at the Earth’s surface, and the Sun delivers it as short-wave radiation — visible light and ultraviolet, the high-energy end of the spectrum. The amount arriving at the top of the atmosphere on a surface held at right angles to the Sun’s rays is remarkably steady, around 1.94 calories per square centimetre per minute, a figure called the solar constant. But “constant at the top” is not the same as “constant at the ground.” By the time those rays have fought through the atmosphere and struck a curved, tilted, spinning planet, the energy that actually warms any given patch of land varies enormously — and that variation is the whole subject.
The first thing the atmosphere does is reflect a large slice straight back to space. If we treat the incoming insolation as 100 units, about 35 units never get absorbed at all: roughly 27 bounce off the tops of clouds, about 6 are scattered by dust and gas molecules in the air, and around 2 are reflected from bright snow and ice. This reflected fraction is the planet’s albedo — its reflectivity — and it is why a fresh snowfield or a deck of cloud stays cool while it dazzles. That leaves 65 units to be absorbed: about 14 are soaked up by the atmosphere itself, and the remaining 51 reach and warm the Earth’s surface.
Here is the elegant part, and the part examiners reach for. The Earth does not keep that heat — it would cook if it did. The surface radiates its 51 units back upward, but now as long-wave terrestrial radiation, the low-energy infrared that gases like water vapour and carbon dioxide are very good at trapping. Of those 51 units, about 17 escape directly to space and 34 are absorbed by the atmosphere. Add that to the 14 the atmosphere grabbed on the way in, and the air is holding 48 units, all of which it eventually radiates out too. So the books balance: 17 from the ground plus 48 from the air equals 65 units leaving the planet, exactly matching the 65 that were absorbed. This in-and-out equilibrium is the heat budget of the atmosphere, and it is the reason the Earth, taken as a whole, neither warms up endlessly nor cools toward space — despite the vast quantity of energy flowing through it every second. The balance holds for the planet as a single body; it does not hold place by place, and that imbalance between regions is precisely what drives winds and currents.


The Seven Factors That Control Temperature Distribution
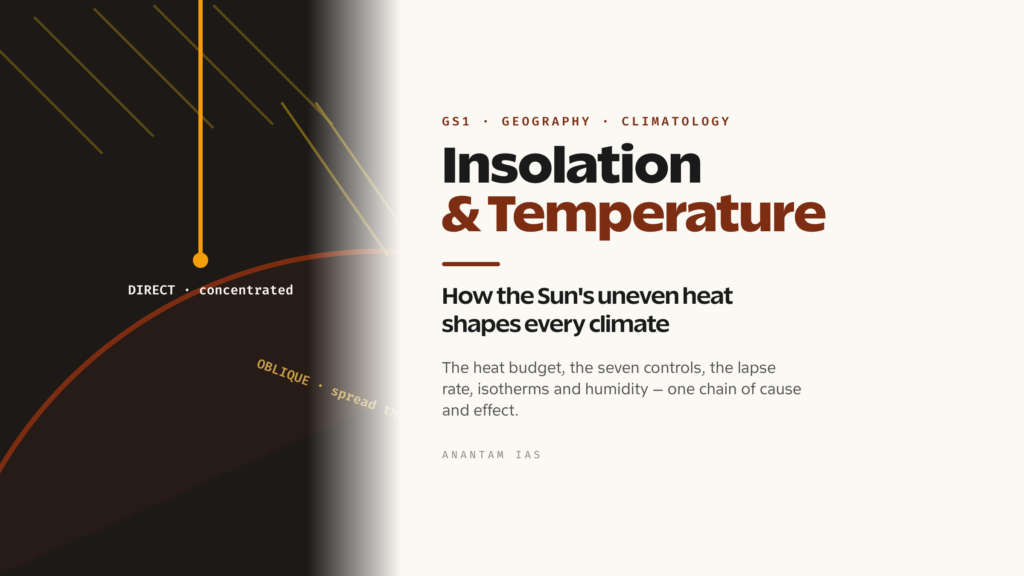
If insolation arrived evenly, the Earth would warm in neat bands and there would be little more to say. It does not, and a handful of controls explain almost every anomaly on a temperature map. The first and most powerful is latitude, which really means the angle of incidence — the angle at which the Sun’s rays strike the ground. Near the equator the noon Sun is nearly overhead, so its rays hit almost vertically, concentrating their energy on a small area and passing through the least depth of atmosphere. Toward the poles the same beam strikes at a slant, spreading the same energy over a much larger, more oblique surface and travelling through more air that absorbs and scatters it on the way. That is why the tropics are hot and the poles are cold — not because they are nearer or farther from the Sun, but because of the geometry of the angle.
Altitude is the second control, and it explains why a hill station can be cool while the plain below it swelters at the same latitude. The atmosphere is heated mainly from below — the ground absorbs insolation and warms the air in contact with it — so temperature falls as you rise away from that heated surface. This is why Shimla is cooler than Chandigarh though both sit at roughly the same latitude. The third control, and one the exam returns to again and again, is distance from the sea, or continentality. Land heats and cools quickly; water heats and cools slowly, because it is transparent, it mixes by currents, and it spends heat on evaporation. So a coastal place has a small, moderated annual range of temperature — mild winters and gentle summers — while a place deep in a continental interior swings between scorching summers and bitter winters. Continentality is the single idea that explains the largest temperature ranges on Earth.
The remaining four work as modifiers on top of these. Ocean currents redistribute heat across the globe: a warm current like the Gulf Stream or the North Atlantic Drift carries tropical warmth poleward and keeps north-western Europe far milder than its latitude deserves, while a cold current like the Labrador or Benguela chills the coast it washes. Prevailing winds carry the temperature of the region they come from — an onshore wind off a warm current is warming, a wind off a cold interior or a cold current is cooling. Cloud cover acts like a blanket and a parasol at once: by day clouds reflect insolation and keep the surface cooler, and by night they trap outgoing terrestrial radiation and keep it warmer, so cloudy places have a smaller daily range than clear deserts, where days blaze and nights turn cold. Finally aspect — the direction a slope faces — matters in mountains: in the Northern Hemisphere, south-facing slopes catch more direct Sun and grow warmer, which is why settlements and orchards cluster on them, while shaded north-facing slopes stay cool and forested.
How Temperature Changes With Height: Lapse Rate and Inversion
Travel straight up, and temperature normally falls in a predictable way. Because the air is warmed from the ground rather than directly by the Sun passing through it, the lowest layer is the warmest and each step upward is cooler. The average rate of this decline is about 6.5 degrees Celsius for every kilometre you climb, and it is called the normal lapse rate, or the environmental lapse rate. It is an average of the real atmosphere on an ordinary day, and it is the reason mountaintops carry snow while their valleys are green. Keep this number — roughly 6.5°C per kilometre, or about 1°C for every 165 metres — and you can estimate the temperature at altitude from a sea-level reading, a calculation the exam sometimes asks for directly.
But the atmosphere does not always behave so tidily, and the most important exception is temperature inversion — when the normal pattern reverses and the air actually gets warmer with height instead of cooler. The textbook case happens on a long, calm, clear winter night. With no clouds to trap it, the ground radiates its heat rapidly to space and cools sharply; the layer of air touching the cold ground cools too, until it is colder than the air just above it. Now temperature increases upward through that shallow layer — the inversion. It needs the right ingredients: long nights, clear skies, dry and still air, and ideally a valley where the cold dense air can pool. Inversions matter beyond the textbook because that cold, stable lower layer behaves like a lid — it stops vertical mixing, so smoke, fog and pollutants get trapped near the ground, which is exactly why north Indian cities choke on the worst smog on still winter mornings.
This vertical behaviour also closes the loop with humidity, and it is worth stating plainly because it is a favourite trap. Warm air can hold more water vapour than cold air. So as the morning sun heats the surface, temperature rises and the air’s capacity for moisture rises with it, which pushes relative humidity down. By the coldest hour — just before dawn — the air holds the least moisture it can, capacity is at its lowest, and relative humidity is at its highest, often reaching saturation and forming dew or fog. The plain rule to carry away: early in the morning, temperature is low and relative humidity is high, and the two move in opposite directions through the day.
Reading the Horizontal Pattern: Isotherms and the Hemispheres
Spread temperature across a map instead of up a column, and geographers join all the places with the same temperature using lines called isotherms — iso meaning equal, therm meaning heat. A temperature map is a field of these lines, and reading them is a skill in itself. Broadly, isotherms run roughly parallel to the lines of latitude, because latitude is the dominant control — temperature falls steadily from equator to pole, so the lines stack up east-to-west in bands. But they are never perfectly straight, and every bend tells a story. Where an isotherm swings sharply, look for one of the seven controls at work: a warm current pushing a band of warmth poleward, a cold current dragging it back, a mountain range, or — most often — the boundary between land and sea.
That land-sea contrast produces the clearest seasonal signature on any isotherm map. Because land heats and cools faster than the ocean, isotherms bend poleward over warm summer continents and equatorward over the same cold winter continents, while over the oceans they stay comparatively straight and stable. The general fall of temperature from equator to pole also is not symmetrical, and the reason matters for the exam. The Northern Hemisphere is dominated by land and the Southern by ocean — the south is overwhelmingly water. Because land swings through wide temperature extremes while the vast southern oceans moderate everything they touch, the Northern Hemisphere shows a much larger annual range of temperature than the Southern Hemisphere at the same latitudes. Two places sitting at, say, 45 degrees north and 45 degrees south are not climatic mirror images: the northern one, sitting amid continents, has hotter summers and colder winters, while the southern one, ringed by water, stays mild year-round. The cause is exactly continentality — more land in the north means more intense differential heating and cooling. It is one of the cleanest illustrations of why land-sea distribution, not latitude alone, governs the real pattern of temperature.
The two distributions are not separate topics, either. The horizontal map is just the vertical column laid on its side: both are driven by the same insolation, both are bent by the same controls, and an isotherm kink over a coastline is the map-scale fingerprint of the continentality that also widens the Northern Hemisphere’s annual range.
Folding In Humidity: Absolute, Relative and Specific
Temperature and moisture travel together, so a study of one is incomplete without the other, and humidity is simply the amount of water vapour in the air. The catch is that “amount” can be measured in three different ways, and the exam likes to test whether you can keep them apart. Absolute humidity is the actual mass of water vapour present in a given volume of air, usually expressed in grams per cubic metre. It is a straight quantity. But it has a quiet problem: as air expands or contracts with temperature and pressure, the same vapour gets spread through more or less volume, so the figure changes even when no water has been added or removed.
Specific humidity sidesteps that. It measures the mass of water vapour per unit mass of air — grams of vapour per kilogram of air — and because it is tied to mass rather than volume, it stays constant as a parcel of air expands or is compressed. That makes specific humidity the meteorologist’s preferred measure for tracking a body of air as it rises, cools and moves. The third and most familiar measure is relative humidity, and it is the one the daily forecast quotes. Relative humidity is the ratio, as a percentage, of the water vapour the air actually holds to the maximum it could hold at that temperature — its capacity. The crucial idea is that the capacity depends on temperature: warm air can hold far more vapour than cold air. So relative humidity can change without any vapour entering or leaving the air at all — simply warm the air and its capacity rises, so the same vapour now fills a smaller share of it and relative humidity falls; cool the air and the reverse happens. When relative humidity reaches 100 per cent the air is saturated, and any further cooling forces vapour to condense into dew, fog or cloud. That single relationship — capacity rising with temperature — is why the coolest hour of the day carries the highest relative humidity, and why heat and moisture can never really be studied apart.
For Your Mains Answer
This is core GS Paper 1 physical geography — the syllabus line on “important Geophysical phenomena” and salient features of the world’s physical geography sits squarely on insolation, the heat budget and temperature. It also feeds GS1 climatology questions on the monsoon and pressure-and-wind belts, because every one of those depends on the uneven heating this topic explains. The skill examiners reward is the ability to move in a chain — from insolation, to the budget, to the controls, to the observed pattern — rather than reciting definitions in isolation.
How to Build the Answer
Open with insolation as the driver and the heat budget as the proof that the planet stays in balance globally while heating unevenly locally. Then run the seven controls in order of power — latitude (angle of incidence) first, then altitude and continentality, then the four modifiers (currents, winds, clouds, aspect). Use the vertical view (lapse rate and inversion) and the horizontal view (isotherms, hemispheric asymmetry) as two demonstrations of the same controls at work, and close by linking temperature to humidity. That arc — drive, balance, controls, patterns, moisture — fits almost any question in this area.
Common Mistakes to Avoid
Don’t say the tropics are hot because they are “closer to the Sun” — the cause is the angle of incidence, not distance. Don’t confuse the three humidity measures: absolute is mass per volume, specific is mass per mass (and stays constant as air expands), relative is a percentage of capacity that changes with temperature. Don’t reverse the temperature-humidity rule — in the cool early morning, relative humidity is high, not low. And don’t attribute the Northern Hemisphere’s larger annual temperature range to latitude; it is continentality — more land in the north.
A Compact Answer Spine
Insolation (short-wave, solar constant ≈ 1.94 cal/cm²/min) → heat budget balances: 100 in = 35 reflected (albedo) + 65 absorbed (14 atmosphere + 51 surface), and 65 radiated back (17 + 48) → seven controls: latitude/angle of incidence, altitude, continentality, ocean currents, winds, cloud cover, aspect → vertical: normal lapse rate ≈ 6.5°C/km, reversed in an inversion (calm, clear, dry winter night) → horizontal: isotherms bend over land-sea boundaries; Northern Hemisphere has the larger annual range due to continentality → humidity: absolute (g/m³) vs specific (g/kg, conserved) vs relative (% of capacity, rises as temperature falls).
Diagram or Flowchart Idea
Sketch the heat budget as a simple energy-flow diagram: 100 units arriving at the top, an arrow of 35 reflected back, 14 caught by the atmosphere and 51 reaching the ground, then return arrows of 17 and 48 leaving — labelled so the 65-in-65-out balance is visible at a glance. A clean budget diagram earns marks fast and anchors the whole answer.
A Balanced-Conclusion Line
A line that lands: “The Earth’s temperature is the visible result of an invisible accountancy — insolation received, reflected, absorbed and re-radiated in near-perfect global balance, yet shared so unevenly across latitude, land and sea that it sets every wind and current on the planet in motion.”
How to Use Data Without Cramming
You need only a few anchors: the solar constant (≈ 1.94 cal/cm²/min), the budget split (35 reflected, 51 to the surface, 14 to the atmosphere), and the normal lapse rate (≈ 6.5°C/km). Drop those three into the right sentences, attribute the budget plainly to the standard heat-balance model, and the answer reads as authoritative without a wall of figures.
FAQ
What is the difference between insolation and the solar constant? Insolation is incoming solar radiation — the short-wave solar energy actually received per unit area at a place, which varies with latitude, season, time of day and atmospheric conditions. The solar constant is the fixed amount of that energy, about 1.94 calories per square centimetre per minute, arriving at the top of the atmosphere on a surface held at right angles to the Sun’s rays. The constant is the supply at the top; insolation is what reaches the ground after the atmosphere has reflected, scattered and absorbed part of it.
Why does temperature fall as you go higher, and what is the normal lapse rate? Because the atmosphere is heated mainly from the ground up — the surface absorbs insolation and warms the air touching it — so the air gets cooler the farther you climb from that heated surface. The average rate of this decline is the normal (environmental) lapse rate, about 6.5°C per kilometre. This is why hill stations are cooler than the plains at the same latitude, and why high peaks stay snow-capped.
What is a temperature inversion? It is a reversal of the normal pattern, where temperature rises with height instead of falling, usually in a shallow layer near the ground. It forms on long, clear, calm, dry winter nights: the ground radiates heat away rapidly and cools, chilling the air immediately above it until that layer is colder than the air higher up. The resulting cold, stable lid traps fog and pollutants near the surface, which is why winter smog settles in valleys and plains.
Why is the relative humidity highest in the early morning? Because warm air can hold more water vapour than cold air. Through the day, rising temperature increases the air’s moisture capacity, so the same vapour fills a smaller share of it and relative humidity falls. By the coldest hour, just before dawn, capacity is at its lowest, so the air is closest to saturation and relative humidity is at its highest — often producing dew or fog. Temperature and relative humidity move in opposite directions through the day.
Practice Questions
Prelims MCQs
- With reference to the heat budget of the atmosphere, if incoming insolation is taken as 100 units, how is the absorbed energy distributed?
(a) 51 units by the atmosphere and 14 by the surface
(b) 14 units by the atmosphere and 51 by the surface
(c) 35 units by the surface and 30 by the atmosphere
(d) 65 units by the surface and none by the atmosphere
Answer: (b) Of 100 units, 35 are reflected (albedo) and 65 absorbed — 14 by the atmosphere and 51 by the Earth’s surface. - The tropics are warmer than the polar regions primarily because of which factor?
(a) The tropics are physically closer to the Sun
(b) The angle of incidence of the Sun’s rays is more vertical at the equator
(c) The polar atmosphere contains no water vapour
(d) The Sun emits more energy toward the equator
Answer: (b) Near the equator the rays strike almost vertically, concentrating energy on a small area and passing through less atmosphere; toward the poles they strike obliquely and spread over a larger area. - Consider the normal lapse rate. Which statement is correct?
(a) Temperature rises about 6.5°C for every kilometre of ascent
(b) Temperature falls about 6.5°C for every kilometre of ascent
(c) Temperature stays constant with height in the troposphere
(d) Temperature falls about 1°C for every kilometre of ascent
Answer: (b) The normal (environmental) lapse rate is a fall of roughly 6.5°C per kilometre, because the atmosphere is heated from the surface upward. - The annual range of temperature is greater in the Northern Hemisphere than in the Southern Hemisphere at the same latitudes mainly because:
(a) the Northern Hemisphere receives more insolation
(b) the Northern Hemisphere has a far larger proportion of land, causing intense differential heating and cooling
(c) ocean currents are absent in the Northern Hemisphere
(d) the Southern Hemisphere is tilted away from the Sun
Answer: (b) Land heats and cools faster than water; the land-dominated Northern Hemisphere swings through a wider annual range than the ocean-dominated Southern Hemisphere — this is continentality. - Which of the following correctly describes specific humidity?
(a) The mass of water vapour per unit volume of air
(b) The mass of water vapour per unit mass of air
(c) The percentage of moisture relative to the air’s capacity
(d) The temperature at which air becomes saturated
Answer: (b) Specific humidity is the mass of water vapour per unit mass of air (g/kg); because it is tied to mass, it stays constant as a parcel of air expands or is compressed.
Mains Practice Questions
- Explain the heat budget of the atmosphere and show how the Earth maintains an overall thermal balance despite the uneven heating of its surface. (15 marks, 250 words)
- “Latitude sets the broad pattern of temperature, but the controls that bend it tell the real story.” Examine the factors that govern the horizontal distribution of temperature on the Earth’s surface. (15 marks, 250 words)
- Distinguish between the normal lapse rate and temperature inversion. Under what conditions does an inversion form, and why does it worsen winter air pollution in northern India? (10 marks, 150 words)
- Account for the larger annual range of temperature in the Northern Hemisphere compared with the Southern Hemisphere at equivalent latitudes. (10 marks, 150 words)
- Differentiate between absolute, specific and relative humidity, and explain why relative humidity is highest in the early hours of the morning. (15 marks, 250 words)
Tell Google you want more of this.
Add Anantam IAS as a preferred sourceOne tap, and this site shows up more often in your own Top Stories, AI Overviews and AI Mode. Remove it any time.