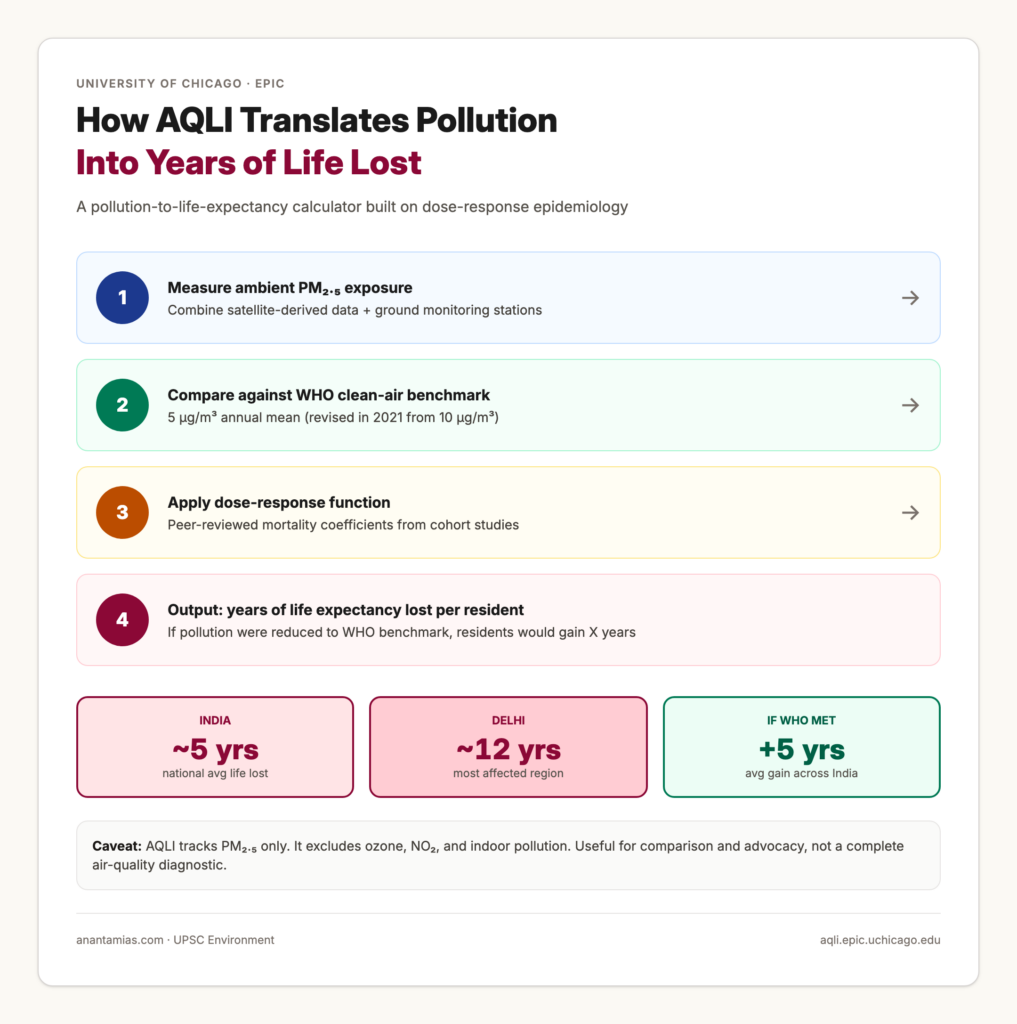
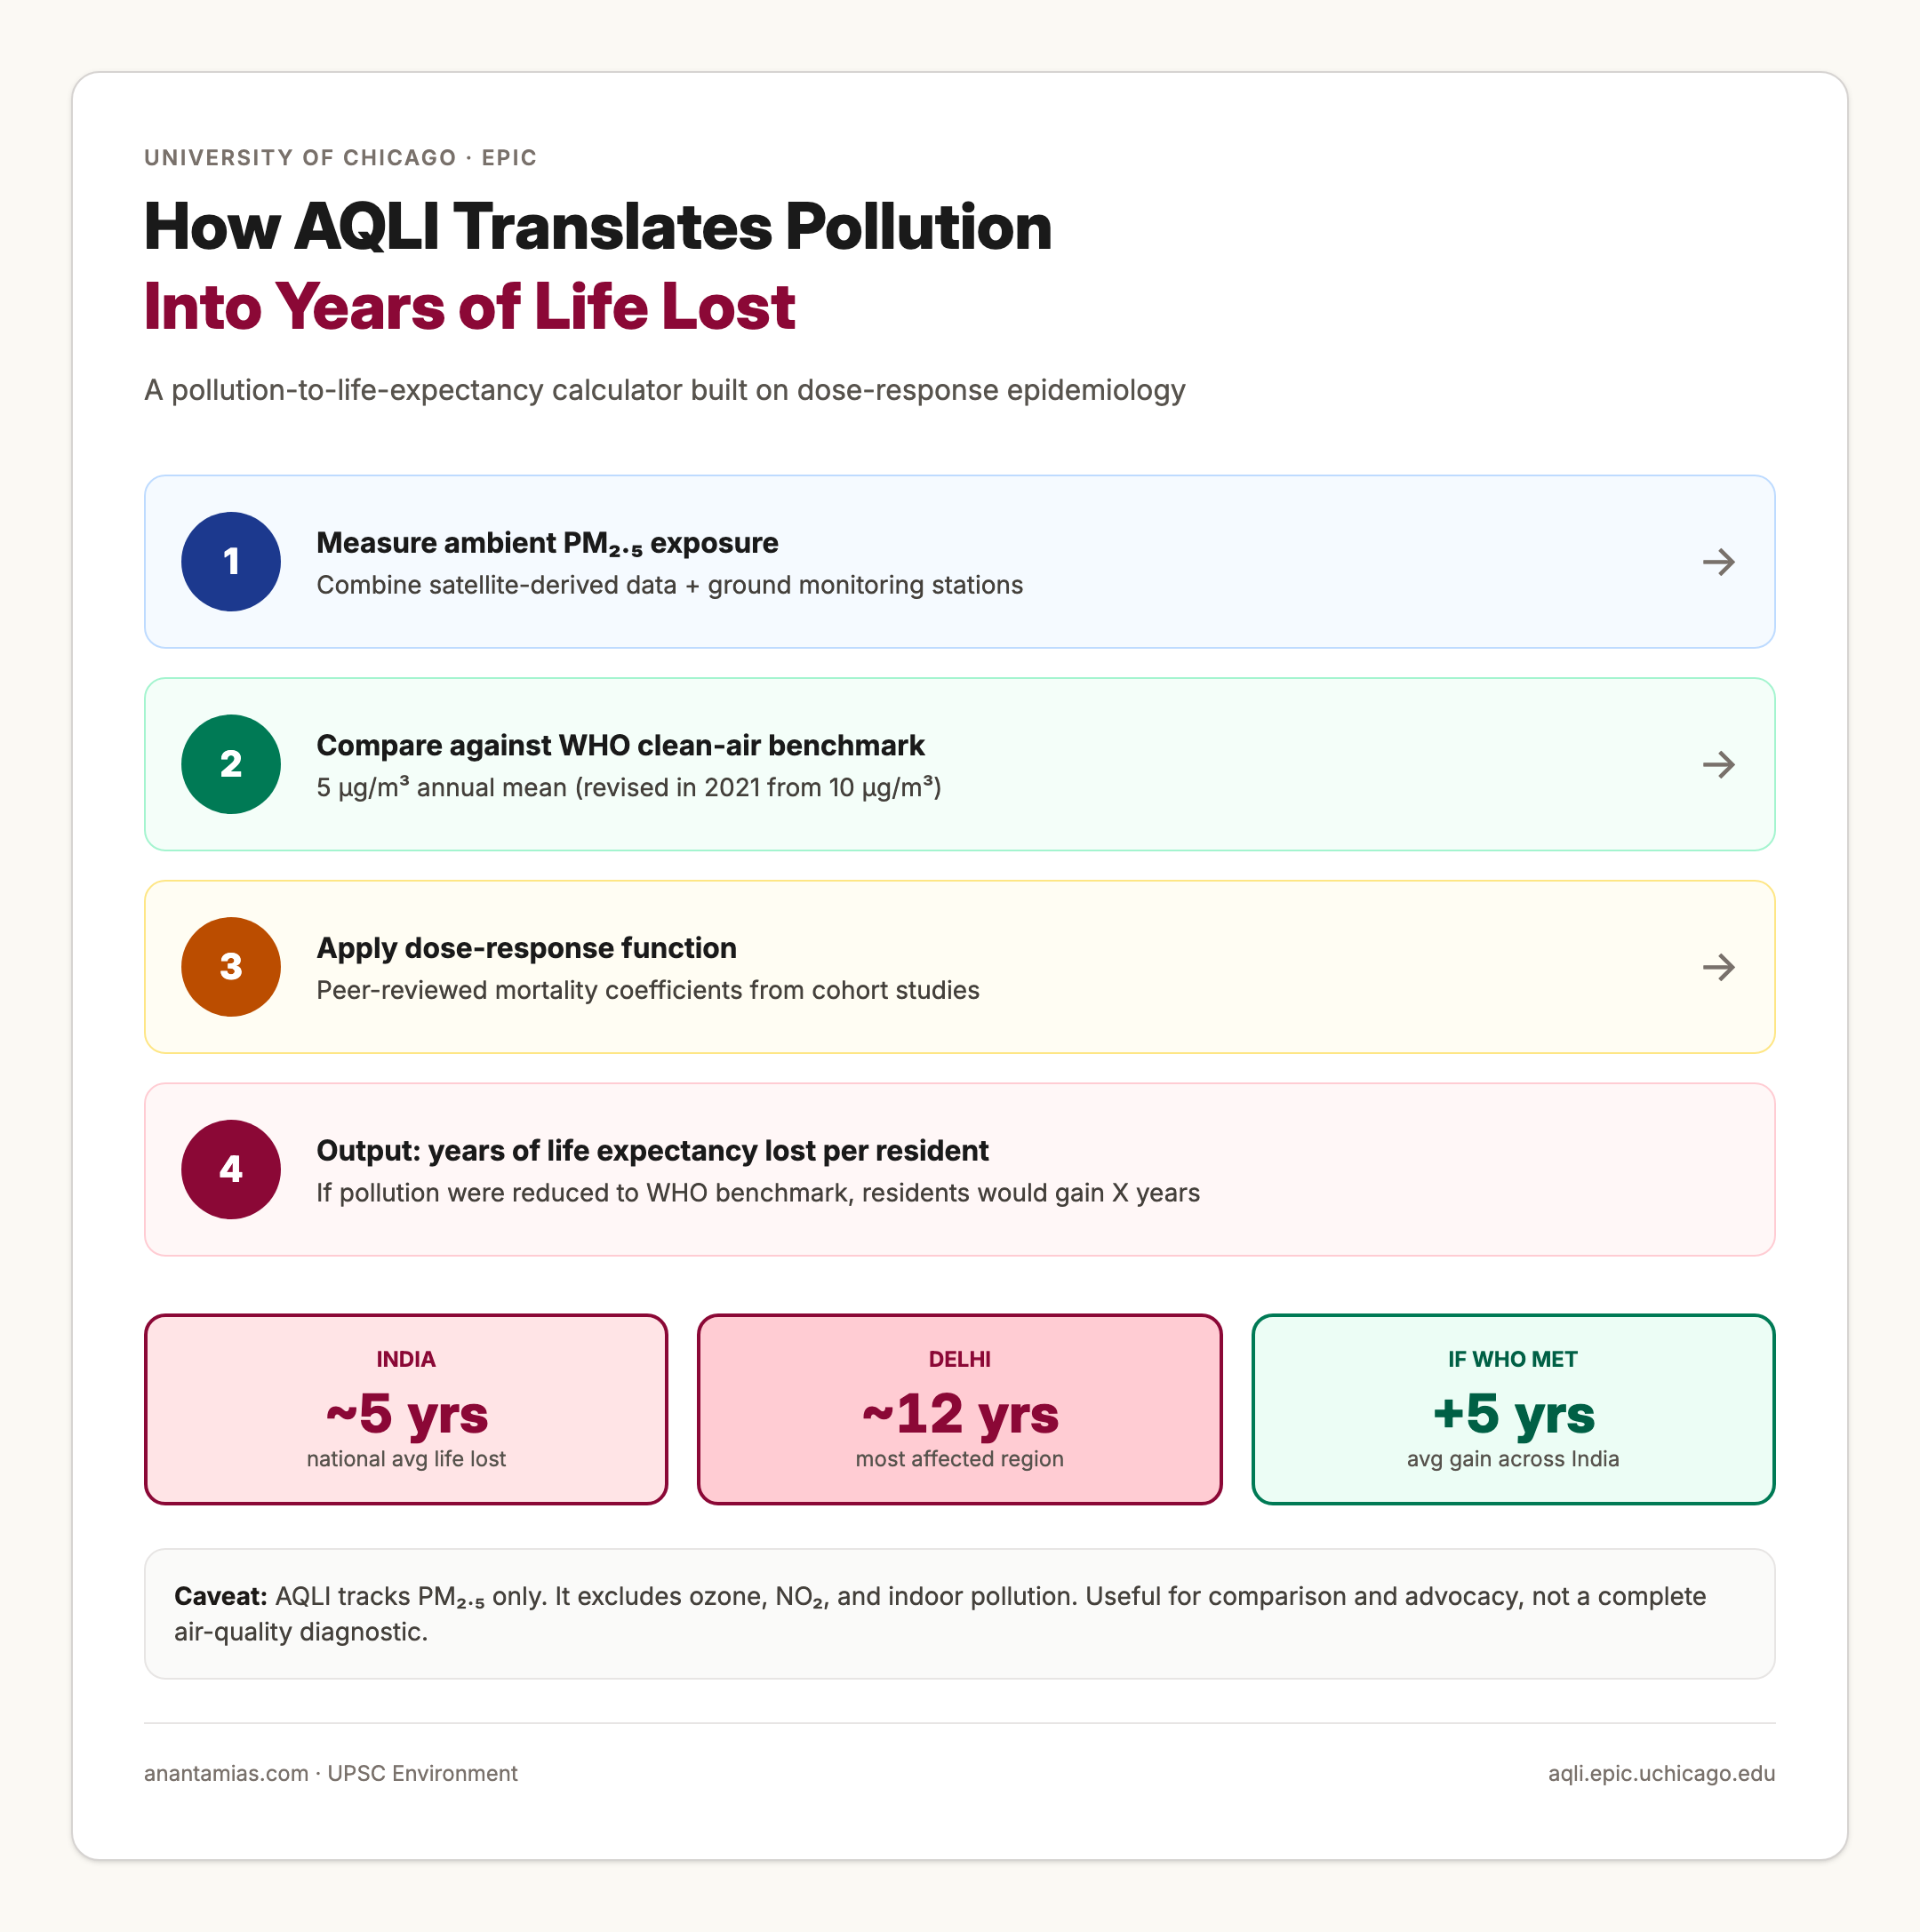
The Air Quality Life Index, abbreviated AQLI, has become one of the most arresting ways to communicate the human cost of air pollution. Developed by researchers at the Energy Policy Institute at the University of Chicago, it converts PM2.5 concentration data into a single intuitive number: the years of life expectancy that residents of a region lose because of polluted air. AQLI does not measure pollution in micrograms per cubic metre, although it uses such data as input. It measures pollution in lost years of life, a unit that resonates with policymakers, journalists, and citizens in a way that exposure metrics rarely do.
For UPSC aspirants, the AQLI sits inside a broader ecosystem of air-quality tools that aspirants must learn together. India operates the National Air Quality Index, launched in 2014, which serves a different purpose: real-time public communication of ambient pollution levels. SAFAR, the System of Air Quality and Weather Forecasting And Research, run by IITM Pune, provides forecasts that inform short-term decisions. The Graded Response Action Plan, applicable to Delhi-NCR, triggers automatic emergency measures when air quality deteriorates beyond defined thresholds, supervised by the Commission for Air Quality Management. Knowing how each instrument differs in objective, methodology, agency, and geographical scope is essential for prelims, while mains questions often probe the policy implications of pollution-driven life expectancy loss.
This guide explains AQLI in depth, distinguishes it from the National AQI and the European CAQI, walks through SAFAR and GRAP, and frames why India consistently emerges as the most polluted country in PM2.5 exposure terms.
Quick Facts at a Glance
The Air Quality Life Index was developed at the Energy Policy Institute at the University of Chicago. It uses peer-reviewed dose-response research to estimate years of life expectancy lost from sustained exposure to fine particulate matter. AQLI consistently identifies India as the most polluted country in PM2.5 exposure terms, with the Indo-Gangetic Plain bearing the heaviest losses. Within India, Delhi, Uttar Pradesh, and Haryana typically record the largest life expectancy losses. The World Health Organization revised its PM2.5 guideline in 2021 from 10 to 5 micrograms per cubic metre annual average, a benchmark used in AQLI calculations. India’s National Ambient Air Quality Standard for annual PM2.5 is 40 micrograms per cubic metre, eight times the WHO guideline. The National AQI, launched on 6 April 2015 by the Central Pollution Control Board, monitors eight pollutants and uses six categories from Good to Severe.
What the Air Quality Life Index Is
AQLI is a pollution-to-life-expectancy calculator. It rests on the premise that the relationship between sustained PM2.5 exposure and mortality is now well documented in epidemiological research, including studies that exploit natural experiments like China’s Huai River heating policy that produced sharply different exposure regimes between northern and southern populations. By applying these dose-response relationships to satellite-derived and ground-monitored PM2.5 data, AQLI estimates how many years of life the average resident of a region would gain if pollution were reduced to a clean-air benchmark, typically the WHO guideline.
The output is intuitive. If a region’s average PM2.5 is 80 micrograms per cubic metre against a WHO benchmark of 5, AQLI translates that gap into an estimated number of years of life lost per resident. The metric makes air pollution comparable across regions and across time. It also frames pollution as a public health emergency rather than an aesthetic or environmental nuisance.
A key methodological caveat is that AQLI measures PM2.5 only. Air pollution involves multiple pollutants, and the human exposure burden is shaped by indoor air quality, occupational exposures, and household behaviour, not only ambient PM2.5. AQLI is a useful comparative metric, not a comprehensive air pollution diagnostic.
Background: Why a Life-Expectancy Metric Matters
Traditional pollution communication uses concentration units, like micrograms per cubic metre, that mean little to non-specialists. AQLI was developed in part to fix this communication gap. The shift from concentration to life-expectancy is more than rhetorical. It reframes air quality regulation as a public health intervention, comparable in importance to tobacco control or road safety. It also helps quantify the equity dimension: rural and low-income populations often bear higher exposure but command less political attention, and AQLI surfaces the geographical mismatch between exposure and policy focus.
The underlying epidemiology has matured rapidly. Long-term cohort studies in the United States, Europe, and China have established robust links between sustained PM2.5 exposure and excess mortality from cardiovascular and respiratory disease. While most early studies focused on relatively low concentration ranges, more recent work from heavily polluted regions has filled in the dose-response curve for the high concentrations characteristic of the Indo-Gangetic Plain. AQLI uses this expanded evidence base to extrapolate health impacts at the high exposures typical in South Asia.
India’s National Air Quality Index
The National AQI was launched in India in 2014 as a public communication tool. It is operated by the Central Pollution Control Board, under the Ministry of Environment, Forest and Climate Change, and pulls real-time data from monitoring stations across the country.
The AQI monitors eight pollutants: particulate matter PM10 and PM2.5, nitrogen dioxide, sulphur dioxide, carbon monoxide, ground-level ozone, ammonia, and lead. Carbon dioxide is not included because it is a climate concern rather than a direct air quality toxicant. The AQI is calculated using the dominating pollutant principle: each pollutant is converted to a sub-index based on its concentration, and the highest sub-index becomes the overall AQI value for that location and time. This approach ensures that no single pollutant exceeding health limits is masked by others being relatively low.
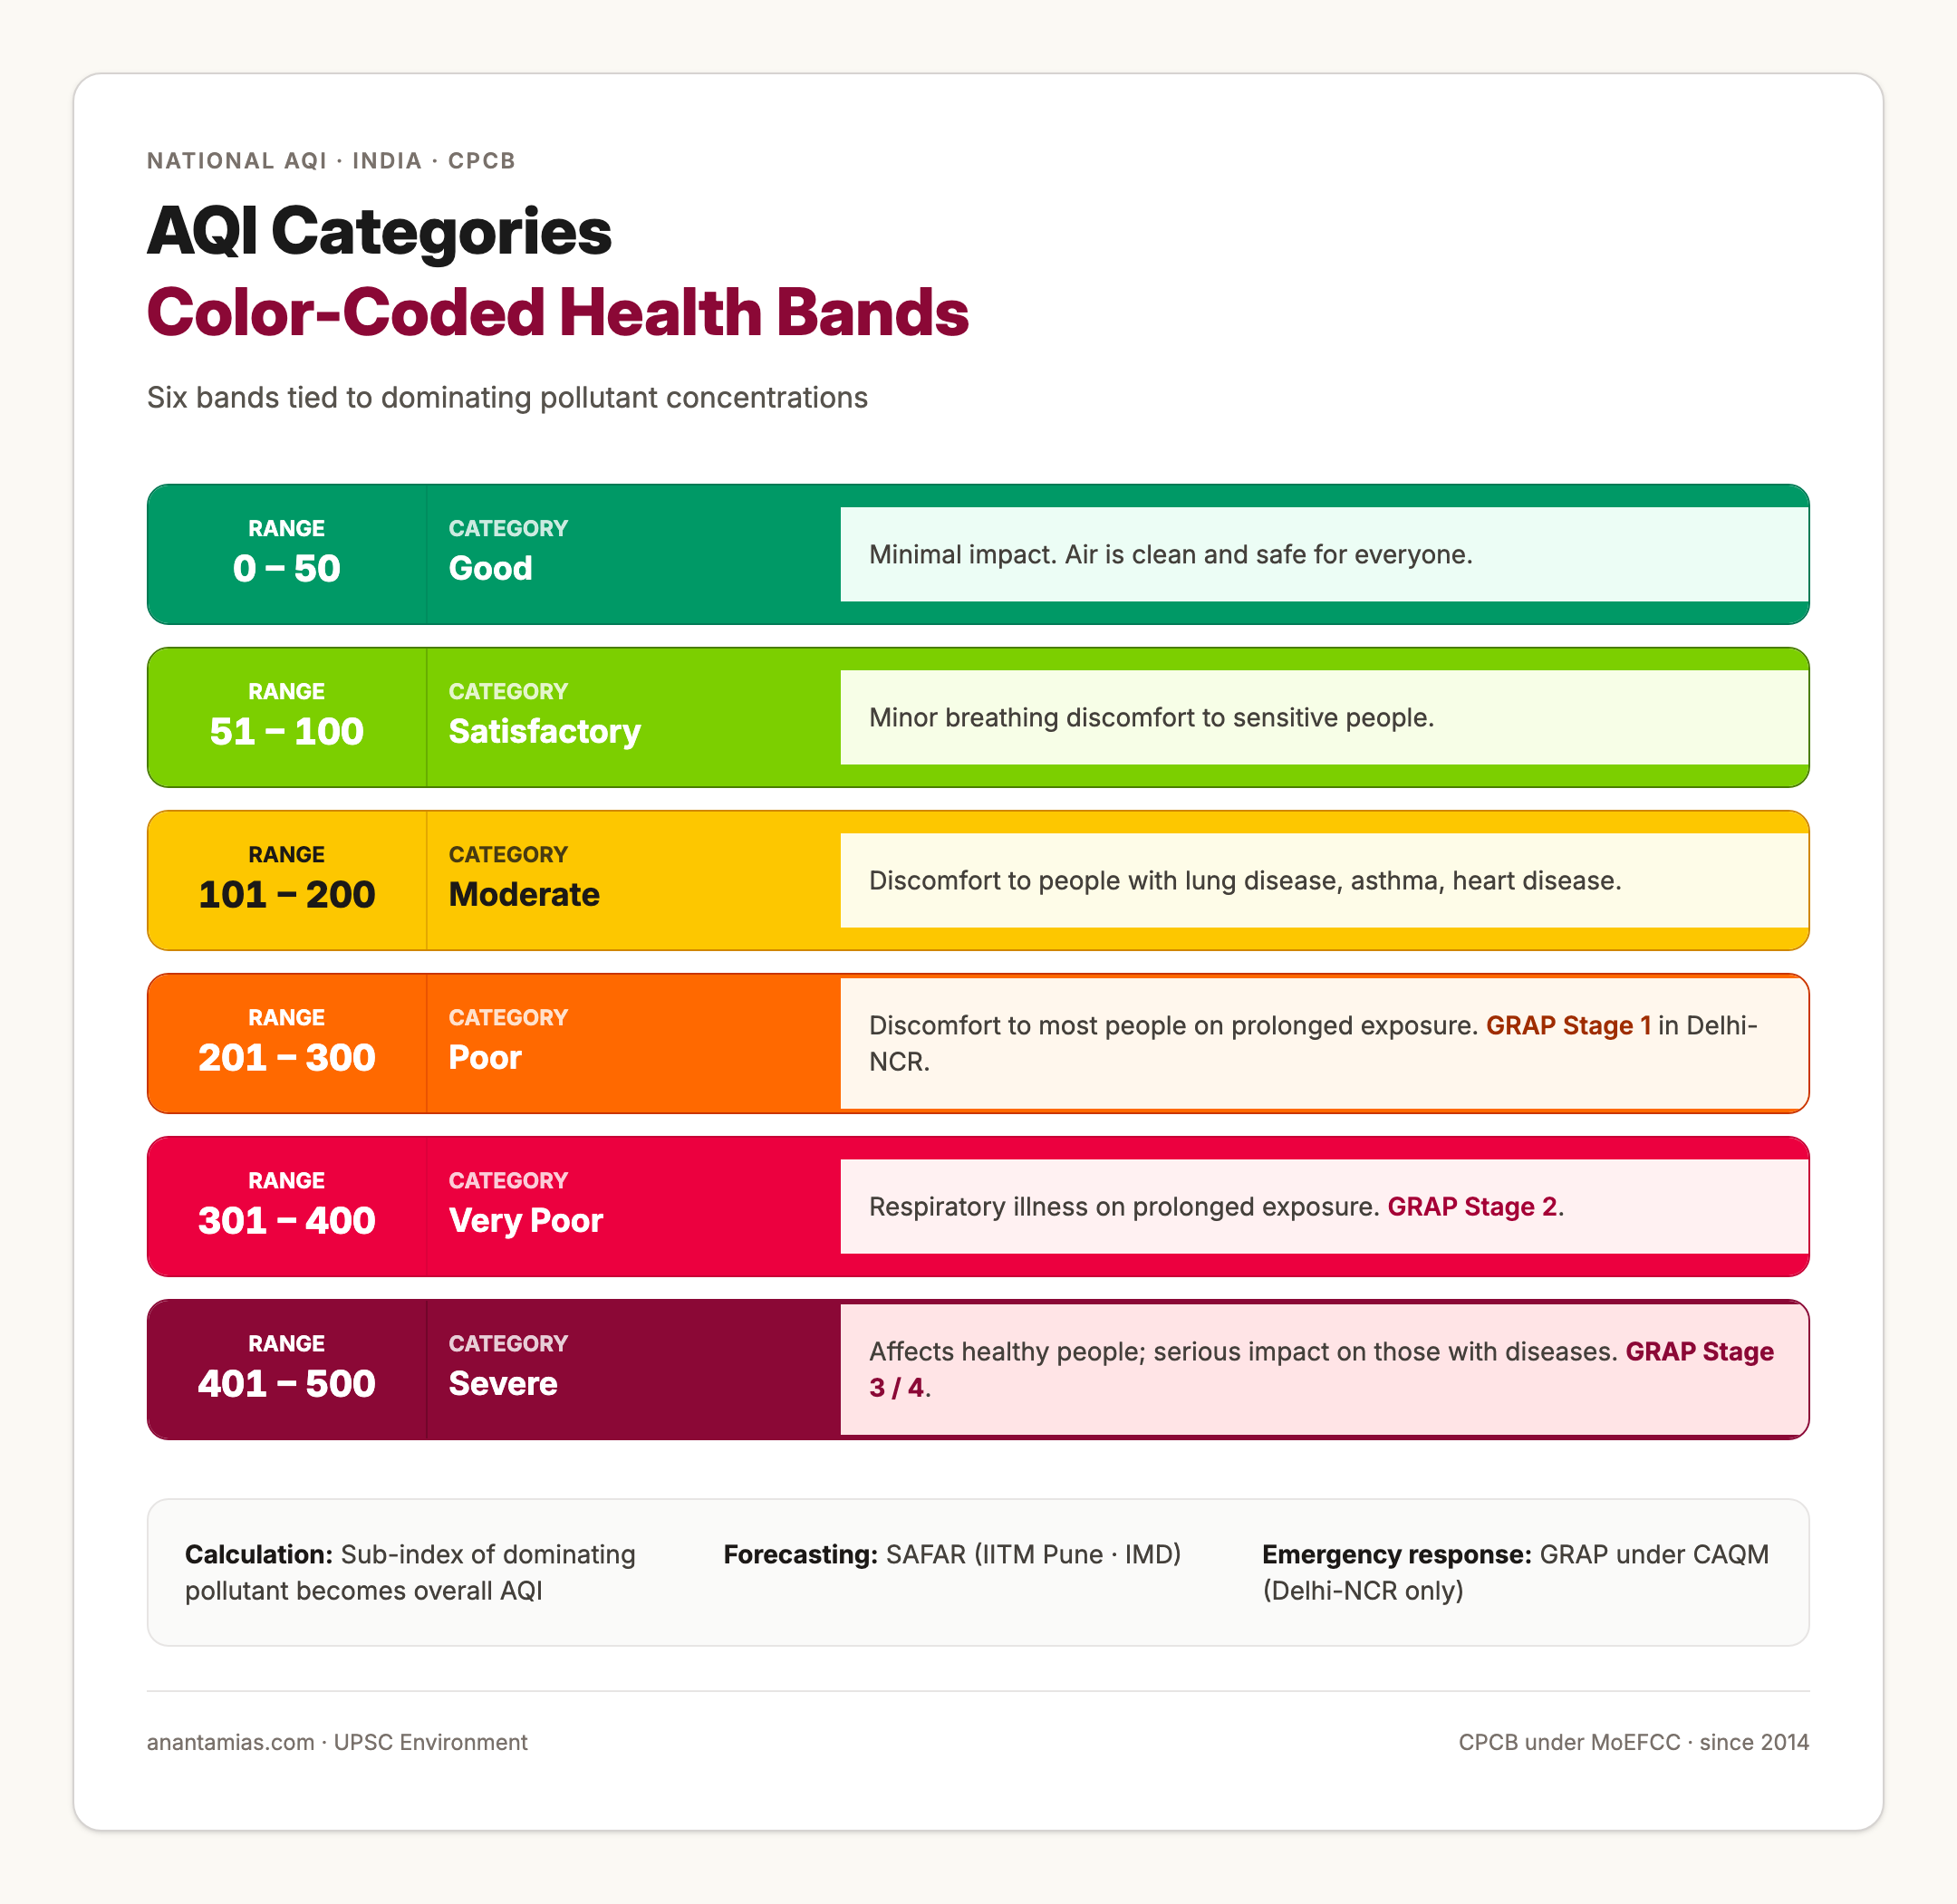
The AQI scale runs from 0 to 500, divided into six categories with colour codes. Good is 0 to 50, shown in green, with minimal health impact. Satisfactory is 51 to 100, in light green, with minor breathing discomfort for sensitive people. Moderate is 101 to 200, in yellow, with breathing discomfort for people with lung disease, asthma, or heart disease. Poor is 201 to 300, in orange, with breathing discomfort to most people on prolonged exposure. Very Poor is 301 to 400, in red, with respiratory illness on prolonged exposure. Severe is 401 to 500, in dark red, affecting healthy people and seriously impacting those with existing diseases.
For more on Delhi air quality and the seasonal pollution cycle, see our coverage of smog and pollution, smog, microplastics, and thermal.
SAFAR: Forecasting Pollution Before It Happens
SAFAR, which stands for the System of Air Quality and Weather Forecasting And Research, was developed by the Indian Institute of Tropical Meteorology in Pune and is operated by the India Meteorological Department under the Ministry of Earth Sciences. SAFAR provides air quality forecasts one to three days in advance, enabling preemptive action by individuals and authorities. Its monitoring is more granular than the standard AQI because it tracks parameters like UV radiation, mercury, benzene, toluene, and xylene that are not in the AQI but are relevant for occupational and chronic health concerns.
SAFAR currently operates dense monitoring networks in Delhi, Mumbai, Pune, and Ahmedabad, with plans for expansion. Its forecasts feed into government decision-making and into public advisories. Forecasts are particularly valuable in cities with sharp seasonal pollution swings, allowing schools, sports events, and outdoor activities to plan around predicted bad-air days.
How AQI and CAQI Differ
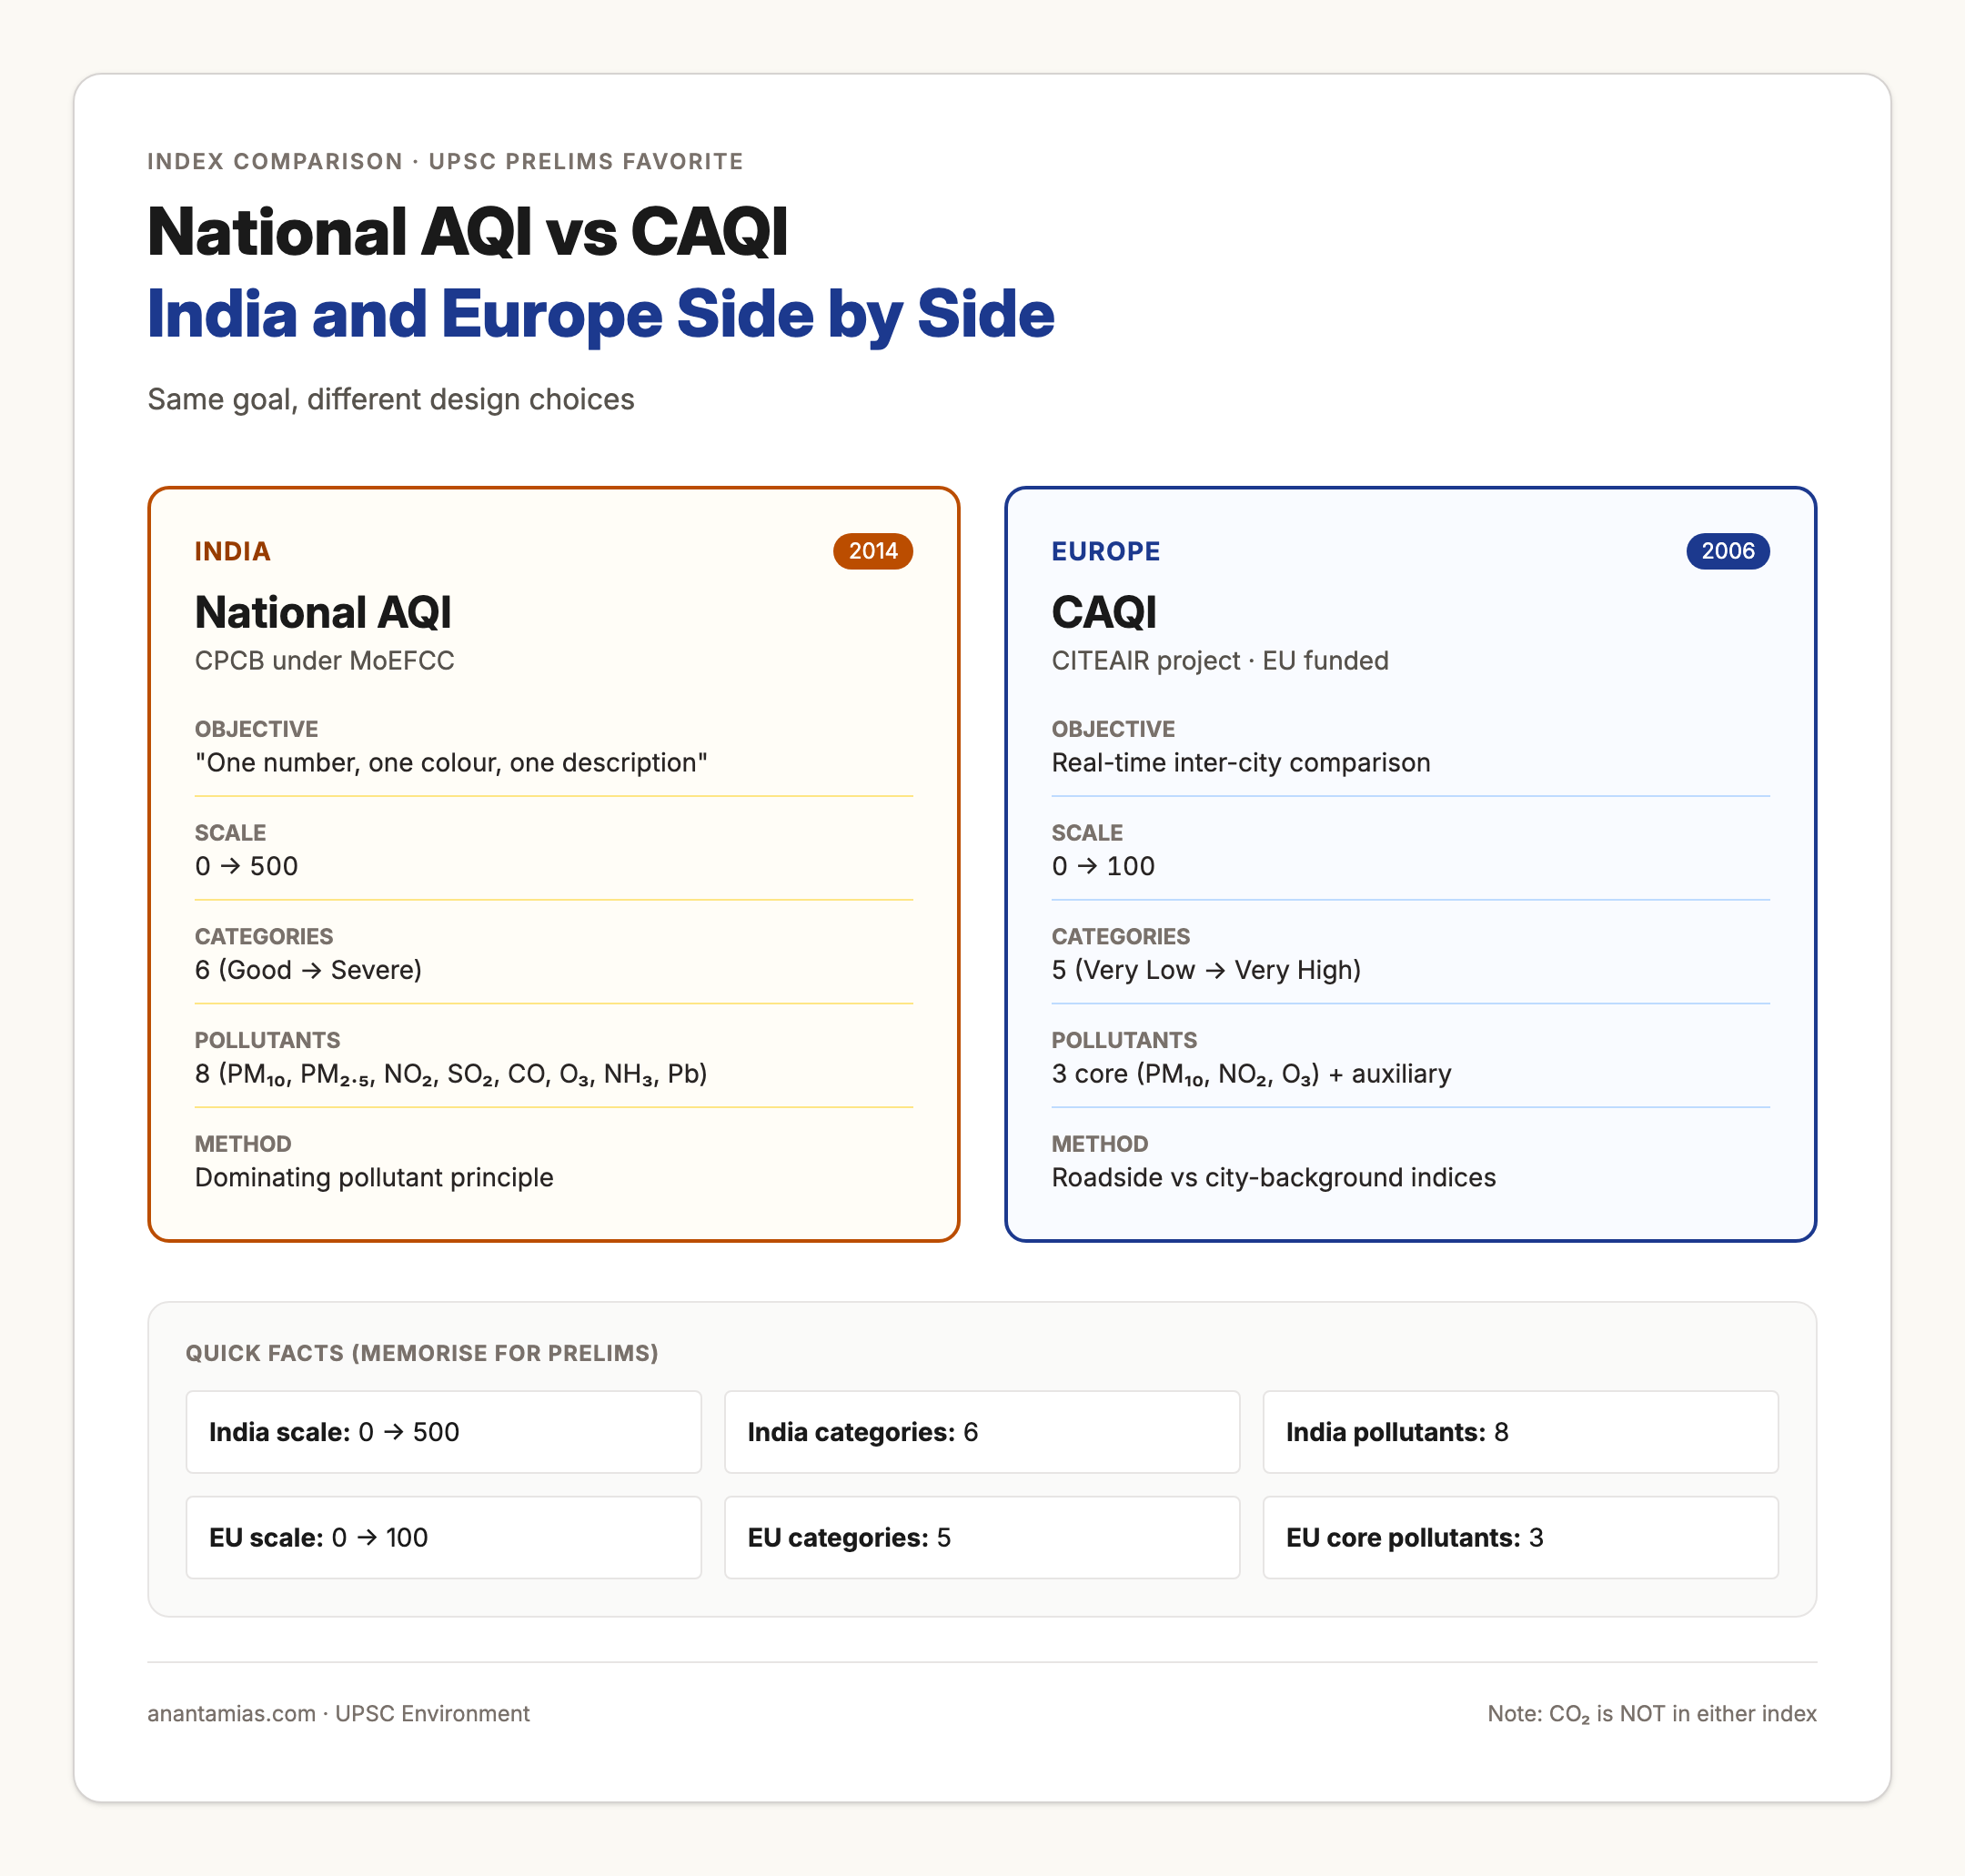
The European Common Air Quality Index, or CAQI, is a parallel framework developed by the CITEAIR project funded by the European Union and launched in 2006. It illustrates how different jurisdictions design air quality indices to suit local conditions and policy goals.
The objectives differ. India’s AQI is built around the principle of one number, one colour, one description for the common citizen, prioritising clarity for a large and linguistically diverse population. CAQI is designed to compare air quality in real-time across European cities, with a focus on transparent inter-city benchmarking. The agencies differ: India’s AQI is run by the CPCB under MoEFCC, while CAQI was developed by an EU-funded research project. The scale ranges differ: India’s AQI runs 0 to 500, while CAQI runs 0 to 100. India uses six categories from Good to Severe; CAQI uses five from Very Low to Very High. India tracks eight pollutants; CAQI tracks three core pollutants of PM10, NO2, and O3, with PM2.5, CO, and SO2 as auxiliary. The calculation method differs: India uses the dominating pollutant principle, while CAQI distinguishes between roadside (traffic) and city background indices to capture differential exposure.
For UPSC purposes, the key differences to remember are scale range, number of categories, number of pollutants, and the dominating pollutant versus traffic-background distinction.
Graded Response Action Plan: Emergency Air Pollution Management
The Graded Response Action Plan, or GRAP, is not an index but an emergency response mechanism. It applies only to Delhi-NCR and is overseen by the Commission for Air Quality Management for the National Capital Region and Adjoining Areas. GRAP triggers progressively stricter measures as the AQI worsens.
The current GRAP framework defines four stages aligned with AQI categories. Stage 1 corresponds to Poor air quality (AQI 201 to 300) and includes measures like dust suppression at construction sites and enforcement of vehicular emission norms. Stage 2 corresponds to Very Poor (301 to 400) and adds restrictions on diesel generators, mechanised road sweeping, and increased parking fees to discourage private vehicles. Stage 3 corresponds to Severe (401 to 450) and includes a ban on construction and demolition in NCR, restrictions on BS III petrol and BS IV diesel vehicles, and online schooling for younger classes. Stage 4 corresponds to Severe Plus (above 450) and includes bans on entry of trucks not carrying essential commodities, halts on industrial activities using polluting fuels, and possible closure of physical schools for all students.
GRAP measures are automatic in principle, although enforcement gaps and political contestation have produced episodes of selective implementation. The Commission for Air Quality Management was established in 2021 with statutory backing through the Commission for Air Quality Management in National Capital Region and Adjoining Areas Act, 2021. It supersedes earlier coordination bodies and has authority over Delhi, Haryana, Punjab, Rajasthan, and Uttar Pradesh in matters affecting NCR air quality. See our coverage of GRAP and AQI and why northern India suffers more pollution than southern western India.
Why It Matters: Health Burden and Policy Implications
The health burden of PM2.5 in India is among the highest in the world. AQLI estimates suggest that residents of the most polluted districts could live several years longer with cleaner air. Children growing up in heavily polluted regions show measurable lung function deficits and increased rates of respiratory infections. Older adults face elevated risks of cardiovascular events, stroke, and chronic obstructive pulmonary disease. The economic costs include lost productivity, healthcare expenditures, and reduced human capital formation.
AQLI also has a strong communication value. By translating pollution into years of life lost, it reframes air quality as a public health emergency rather than an aesthetic or environmental concern. This reframing has been influential in policy debates and budget priorities at both central and state levels.
Comparative Perspective: India and the World
China’s experience with the AQLI is instructive. Two decades ago, China was among the most polluted countries by PM2.5 exposure. After 2013, China launched its Air Pollution Action Plan, deploying coal controls, vehicle restrictions, and industrial relocation. By the mid-2020s, ambient PM2.5 levels had fallen substantially in major Chinese cities, and AQLI estimates of life expectancy gains from these improvements ran into multiple years. The Chinese trajectory shows that rapid PM2.5 reductions are feasible with sustained political commitment, although the social and economic costs are non-trivial. India’s National Clean Air Programme, launched in 2019 and updated since, sets PM2.5 reduction targets across non-attainment cities, but progress has been uneven. See our analysis of how China dealt with air pollution: lessons for India and lesson from China on tackling pollution.
Challenges and Critiques
AQLI as a metric faces several critiques. It focuses solely on PM2.5 and may understate impacts of other pollutants like ozone and nitrogen dioxide. The dose-response functions, while empirically robust, have most data from concentration ranges below those typical in heavily polluted Indian cities, and extrapolation introduces uncertainty. Granularity below the district level is limited. AQLI also does not distinguish indoor from outdoor exposure, which matters in rural Indian settings where biomass cooking is a dominant source.
India’s National AQI faces its own critiques. Monitoring stations are concentrated in metros and large cities, leaving rural areas and Tier 3 towns underserved. The dominating pollutant principle is straightforward but does not capture mixture effects. Real-time data quality and station maintenance are uneven. SAFAR currently operates in only a handful of cities. GRAP is reactive, kicking in when air quality is already poor, and does not address the structural sources of emissions.
UPSC Prelims Pointers
- AQLI was developed by the University of Chicago (Energy Policy Institute) and converts PM2.5 exposure into life expectancy loss.
- India is consistently the most polluted country in the world in PM2.5 exposure terms per AQLI.
- Delhi, Uttar Pradesh, and Haryana typically lead in AQLI life expectancy loss.
- India’s National AQI was launched in 2014 by CPCB under MoEFCC.
- AQI Big 8: PM10, PM2.5, NO2, SO2, CO, O3, NH3, Pb. CO2 is not included.
- AQI scale: 0 to 500, six categories, calculated by dominating pollutant.
- Categories: Good (0-50, green), Satisfactory (51-100, light green), Moderate (101-200, yellow), Poor (201-300, orange), Very Poor (301-400, red), Severe (401-500, dark red).
- CAQI (Europe) range: 0 to 100, five categories, three core pollutants.
- SAFAR developed by IITM Pune; operated by IMD under Ministry of Earth Sciences.
- SAFAR provides 1-3 day air quality forecasts and tracks UV, mercury, benzene, toluene, xylene.
- GRAP applies only to Delhi-NCR; overseen by Commission for Air Quality Management.
- CAQM established under the Commission for Air Quality Management Act, 2021.
- Stages of GRAP align with AQI categories from Poor to Severe Plus.
Mains Practice Questions
- The Air Quality Life Index reframes air pollution as a public health emergency. Discuss its methodology, value, and limitations as a policy tool. (GS-III, 250 words)
- Compare and contrast India’s National AQI with the European CAQI. To what extent do design choices in air quality indices reflect the policy priorities of the issuing jurisdiction? (GS-III, 200 words)
- The Graded Response Action Plan in Delhi-NCR is reactive by design. Critically evaluate its effectiveness and propose reforms for sustained, proactive air quality management. (GS-II/III, 250 words)
- Lessons from China’s air pollution reduction experience are often invoked in Indian policy debates. Examine what is transferable and what is not. (GS-III, 250 words)
Way Forward
A long-term air quality strategy for India must move on multiple fronts. First, expand monitoring beyond metros to small cities and rural areas, with continuous emissions monitoring at major industrial sources. Second, scale source-specific interventions: flue gas desulphurisation at thermal plants, electrification of public transport, full transition away from biomass cooking, ammonia management in agriculture, and dust control in construction. Third, strengthen the National Clean Air Programme with sharper targets, financial incentives for state action, and accountability for non-compliance. Fourth, integrate climate and air quality strategies, since black carbon, methane, and ozone precursors offer co-benefits. Fifth, use AQLI and similar metrics to keep public attention focused on the health stakes, especially in regions where political incentives for clean-air action are still building. The goal should not be merely to meet the current Indian standard of 40 micrograms per cubic metre but to converge towards the WHO guideline of 5, even if the timeline is multi-decadal.
Frequently Asked Questions
What is the Air Quality Life Index and who developed it?
AQLI is a pollution-to-life-expectancy calculator developed by the Energy Policy Institute at the University of Chicago. It uses peer-reviewed epidemiological research to estimate the years of life expectancy that residents lose from sustained exposure to fine particulate matter PM2.5. Outputs are presented as expected life-expectancy gains if pollution were reduced to a clean-air benchmark, typically the WHO guideline.
How is AQLI different from the National AQI?
AQLI estimates long-term health impact in years of life lost; the National AQI reports current ambient pollution levels for daily public communication. AQLI is published by an external research institute; the National AQI is run by India’s Central Pollution Control Board. AQLI uses PM2.5 only, while the National AQI uses eight pollutants. AQLI has a research and advocacy purpose; the National AQI has a regulatory and communication purpose.
Which Indian regions show the largest life-expectancy loss in AQLI?
The Indo-Gangetic Plain consistently records the largest life-expectancy loss in AQLI estimates, with Delhi, Uttar Pradesh, Haryana, Bihar, West Bengal, and Punjab typically near the top. Districts in the north-central plains often show life-expectancy losses of several years per resident compared to a WHO clean-air baseline.
Which pollutants are part of India’s National Air Quality Index?
Eight pollutants: particulate matter PM10 and PM2.5, sulphur dioxide, nitrogen dioxide, carbon monoxide, ground-level ozone, ammonia, and lead. Carbon dioxide is not included because it is a climate concern rather than a direct air toxicant.
What are the categories of the National AQI?
Six categories: Good (0-50, green), Satisfactory (51-100, light green), Moderate (101-200, yellow), Poor (201-300, orange), Very Poor (301-400, red), and Severe (401-500, dark red). Each category corresponds to defined health implications for the general population and sensitive groups.
What is SAFAR and what does it do?
SAFAR, the System of Air Quality and Weather Forecasting And Research, was developed by the Indian Institute of Tropical Meteorology, Pune, and is operated by the India Meteorological Department under the Ministry of Earth Sciences. It provides air-quality forecasts one to three days in advance and monitors additional parameters like UV radiation, mercury, benzene, toluene, and xylene that are not in the standard AQI.
What is the Graded Response Action Plan?
GRAP is an emergency response framework that triggers progressively stricter measures in Delhi-NCR as air quality deteriorates. It is overseen by the Commission for Air Quality Management. Stages range from Poor to Severe Plus, with measures including construction halts, vehicular restrictions, school closures, and industrial activity bans at higher stages.
What is the Commission for Air Quality Management?
The Commission for Air Quality Management for the National Capital Region and Adjoining Areas was established under a 2021 Act to coordinate air quality action across Delhi, Haryana, Punjab, Rajasthan, and Uttar Pradesh in matters affecting NCR. It oversees GRAP, conducts source attribution, and issues binding directions to state pollution control boards and other agencies.
How does India’s AQI compare with the European CAQI?
India’s AQI runs 0 to 500 with six categories and tracks eight pollutants using the dominating pollutant principle. Europe’s CAQI runs 0 to 100 with five categories and tracks three core pollutants of PM10, NO2, and O3, with PM2.5, CO, and SO2 as auxiliary. CAQI also distinguishes between roadside and city background indices, while India’s AQI does not.
Why is benzene a concern for air quality?
Benzene is a volatile organic compound emitted from automobile exhaust, tobacco smoke, wood burning, and certain industrial processes. It is a known human carcinogen, linked to leukaemia and other haematological cancers. Although benzene is not part of the National AQI, SAFAR includes it in its monitoring suite because of its chronic exposure risks in urban and occupational settings.
Tell Google you want more of this.
Add Anantam IAS as a preferred sourceOne tap, and this site shows up more often in your own Top Stories, AI Overviews and AI Mode. Remove it any time.