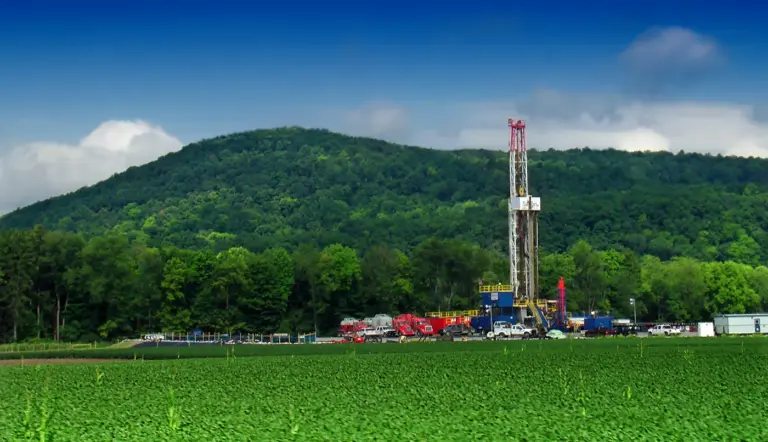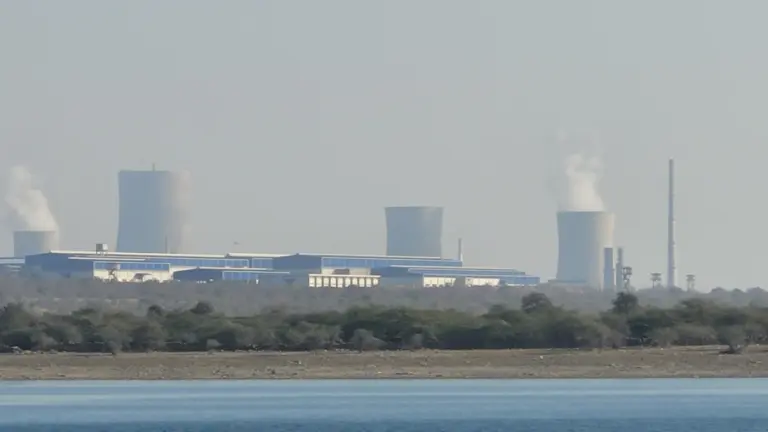

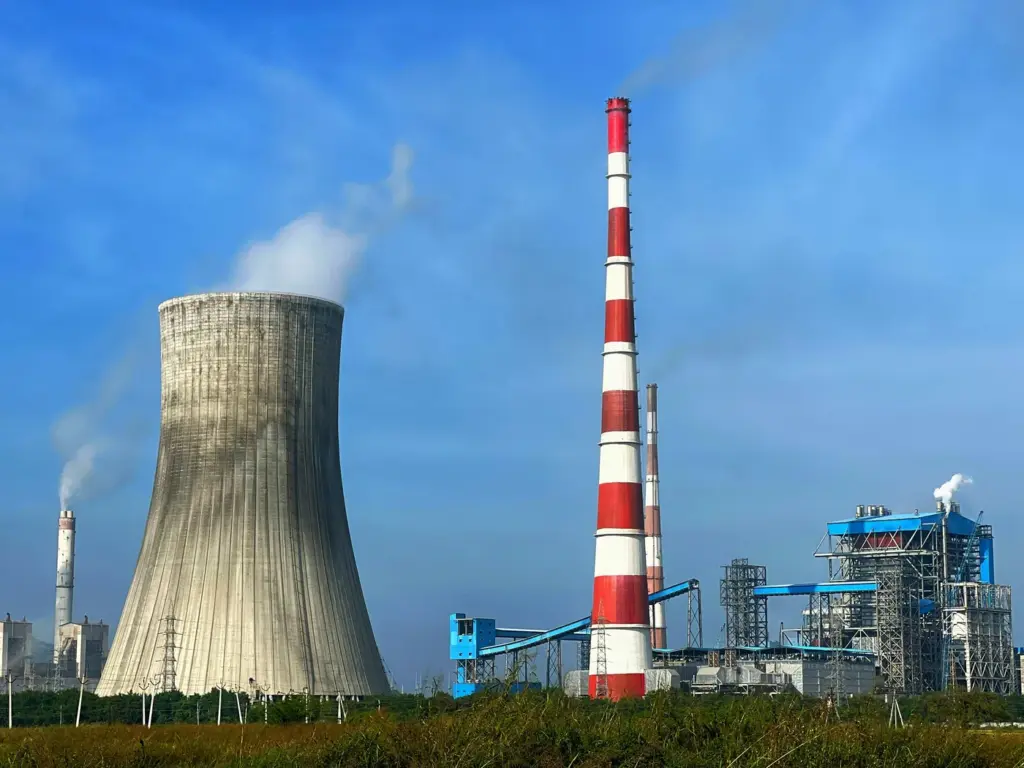
India’s per capita carbon emissions look modest on paper: about 2.18 tonnes of CO2 per person in both 2024 and 2025. That one national average hides a much sharper picture. Split the same data by state and one of them, Chhattisgarh, comes out at 8.70 to 8.72 tonnes per person, which is higher than Germany’s figure in the same dataset.
Most aspirants read a number like that and jump to the wrong conclusion: that people in Chhattisgarh live carbon-heavy, German-style lives. They don’t. The number tells you where coal power stations, steel plants and cement kilns sit, and how few people live around them. Learn to read it that way and you can use state-wise emissions data in a Mains answer without falling into the obvious trap.
Per Capita Carbon Emissions in India: The Short Answer
India emitted about 3,067 million tonnes (Mt) of CO2 in 2024 and 3,087 Mt in 2025, excluding forestry and land use. Divided by the projected population, that’s 2.18 tonnes per person in both years. Germany, in the same dataset and on the same rules, stands at 7.62 tonnes (2024) and 7.57 tonnes (2025).
- Highest state: Chhattisgarh, 8.70 t (2024) and 8.72 t (2025), roughly four times the national average and about 15% above Germany.
- Second highest: Odisha, 5.12 t and 5.29 t, still about 30% below Germany.
- Lowest state: Assam, 0.68 t and 0.69 t. Chhattisgarh emits nearly 13 times as much CO2 per person as Assam.
- Above the national average: 13 of the 28 states in 2025.
- Largest total emitter: Uttar Pradesh, about 314 Mt in 2025, yet only 1.30 t per person because 241 million people share that total.
- Scope: CO2 only, forestry and land use excluded, the same settings for every state, India and Germany.
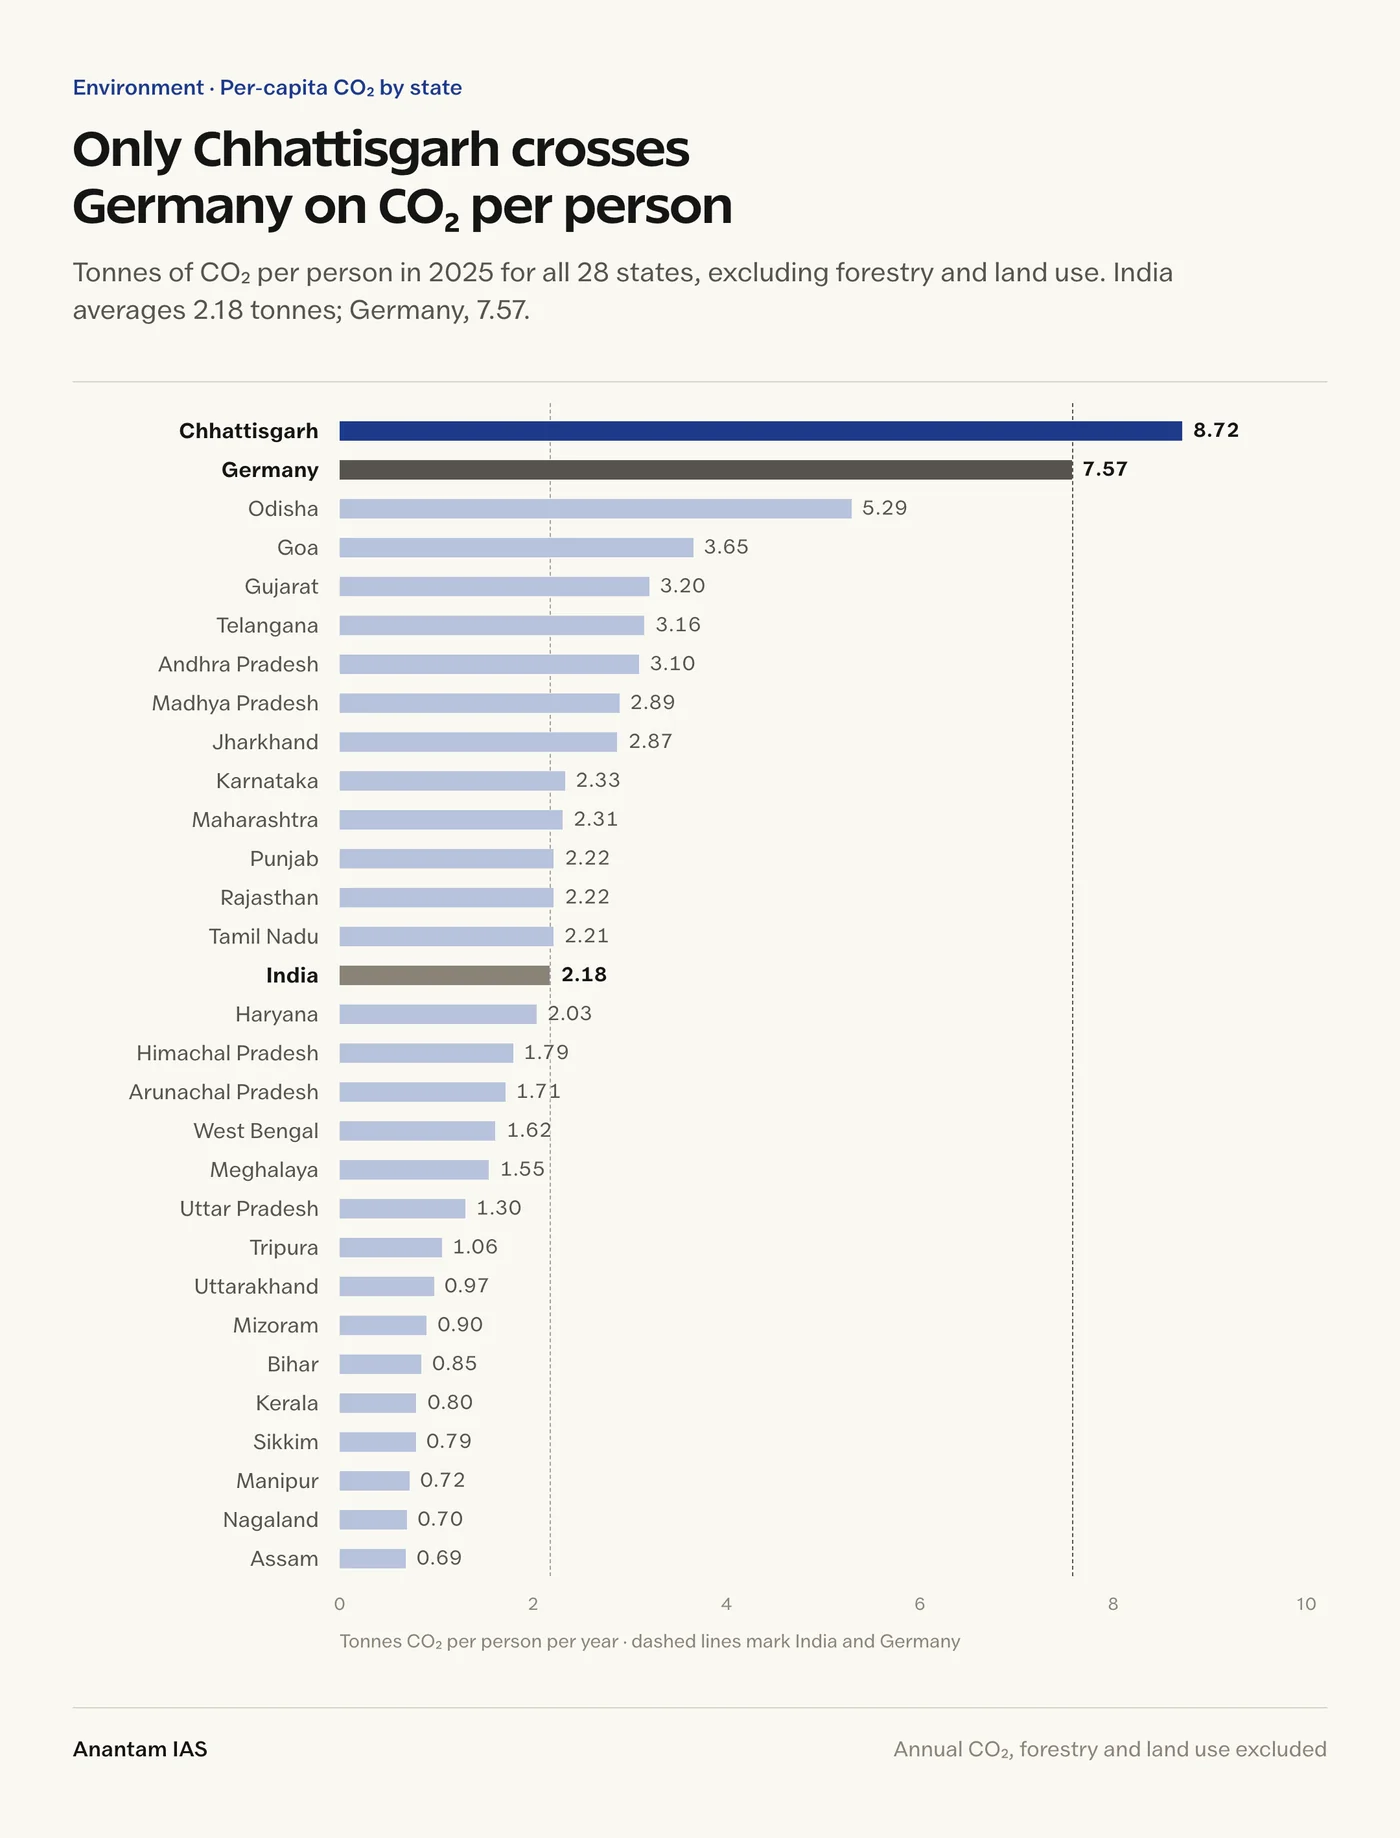
The chart makes the core point faster than any paragraph. One state sits beyond the Germany line, a cluster of coal and industry states sits between 2.9 and 5.3 tonnes, and the populous Gangetic and northeastern states sit well below one or two tonnes.
What Per Capita Carbon Emissions Actually Measure
Per capita emissions are a region’s annual emissions divided by its population. That makes them an average across everyone who lives there, not a measured footprint of any single resident. Think of it like dividing a district’s total electricity bill by its headcount: a district with a giant aluminum smelter will look like it’s full of heavy power users, even if most households run two fans and a bulb.
Here is the worked example behind the headline number. Chhattisgarh’s 2024 CO2 total in the dataset is about 266.51 Mt. Its projected population on 1 July 2024 is 30.638 million. Divide the first by the second and you get 8.70 tonnes per person. That’s the whole calculation. Everything that matters lies in what goes into the numerator.
Five distinctions prevent most misleading comparisons:
- Total emissions describe scale. A populous state can have a huge total and a low per-person figure.
- Per capita emissions adjust for population but not for industrial structure, income inequality or interstate trade.
- CO2 is not CO2e. CO2 counts carbon dioxide alone. CO2-equivalent (CO2e) adds methane, nitrous oxide and fluorinated gases, weighted by their global warming potential over a chosen time horizon. The two numbers aren’t interchangeable.
- Production-based accounting records emissions where goods and power are produced. Consumption-based accounting reallocates them, through trade, to the people whose demand drives that production.
- Historical (cumulative) emissions build up over decades. One year’s emissions say nothing about responsibility for the CO2 stock already in the atmosphere.
This article measures annual CO2, excluding forestry and land use, on a production basis. It is not a full greenhouse-gas ranking and not a household-consumption survey. Keep that boundary in mind and every number below reads correctly.
State-wise Per Capita CO2 Emissions, 2024 and 2025
The map shows the geography at a glance. High per-person emissions cluster in a central and eastern belt of coal, power and metals: Chhattisgarh, Odisha, Jharkhand, Telangana and Madhya Pradesh, with Gujarat and Goa on the west coast. The large, densely populated states of the Gangetic plain and almost the whole Northeast sit at the light end.
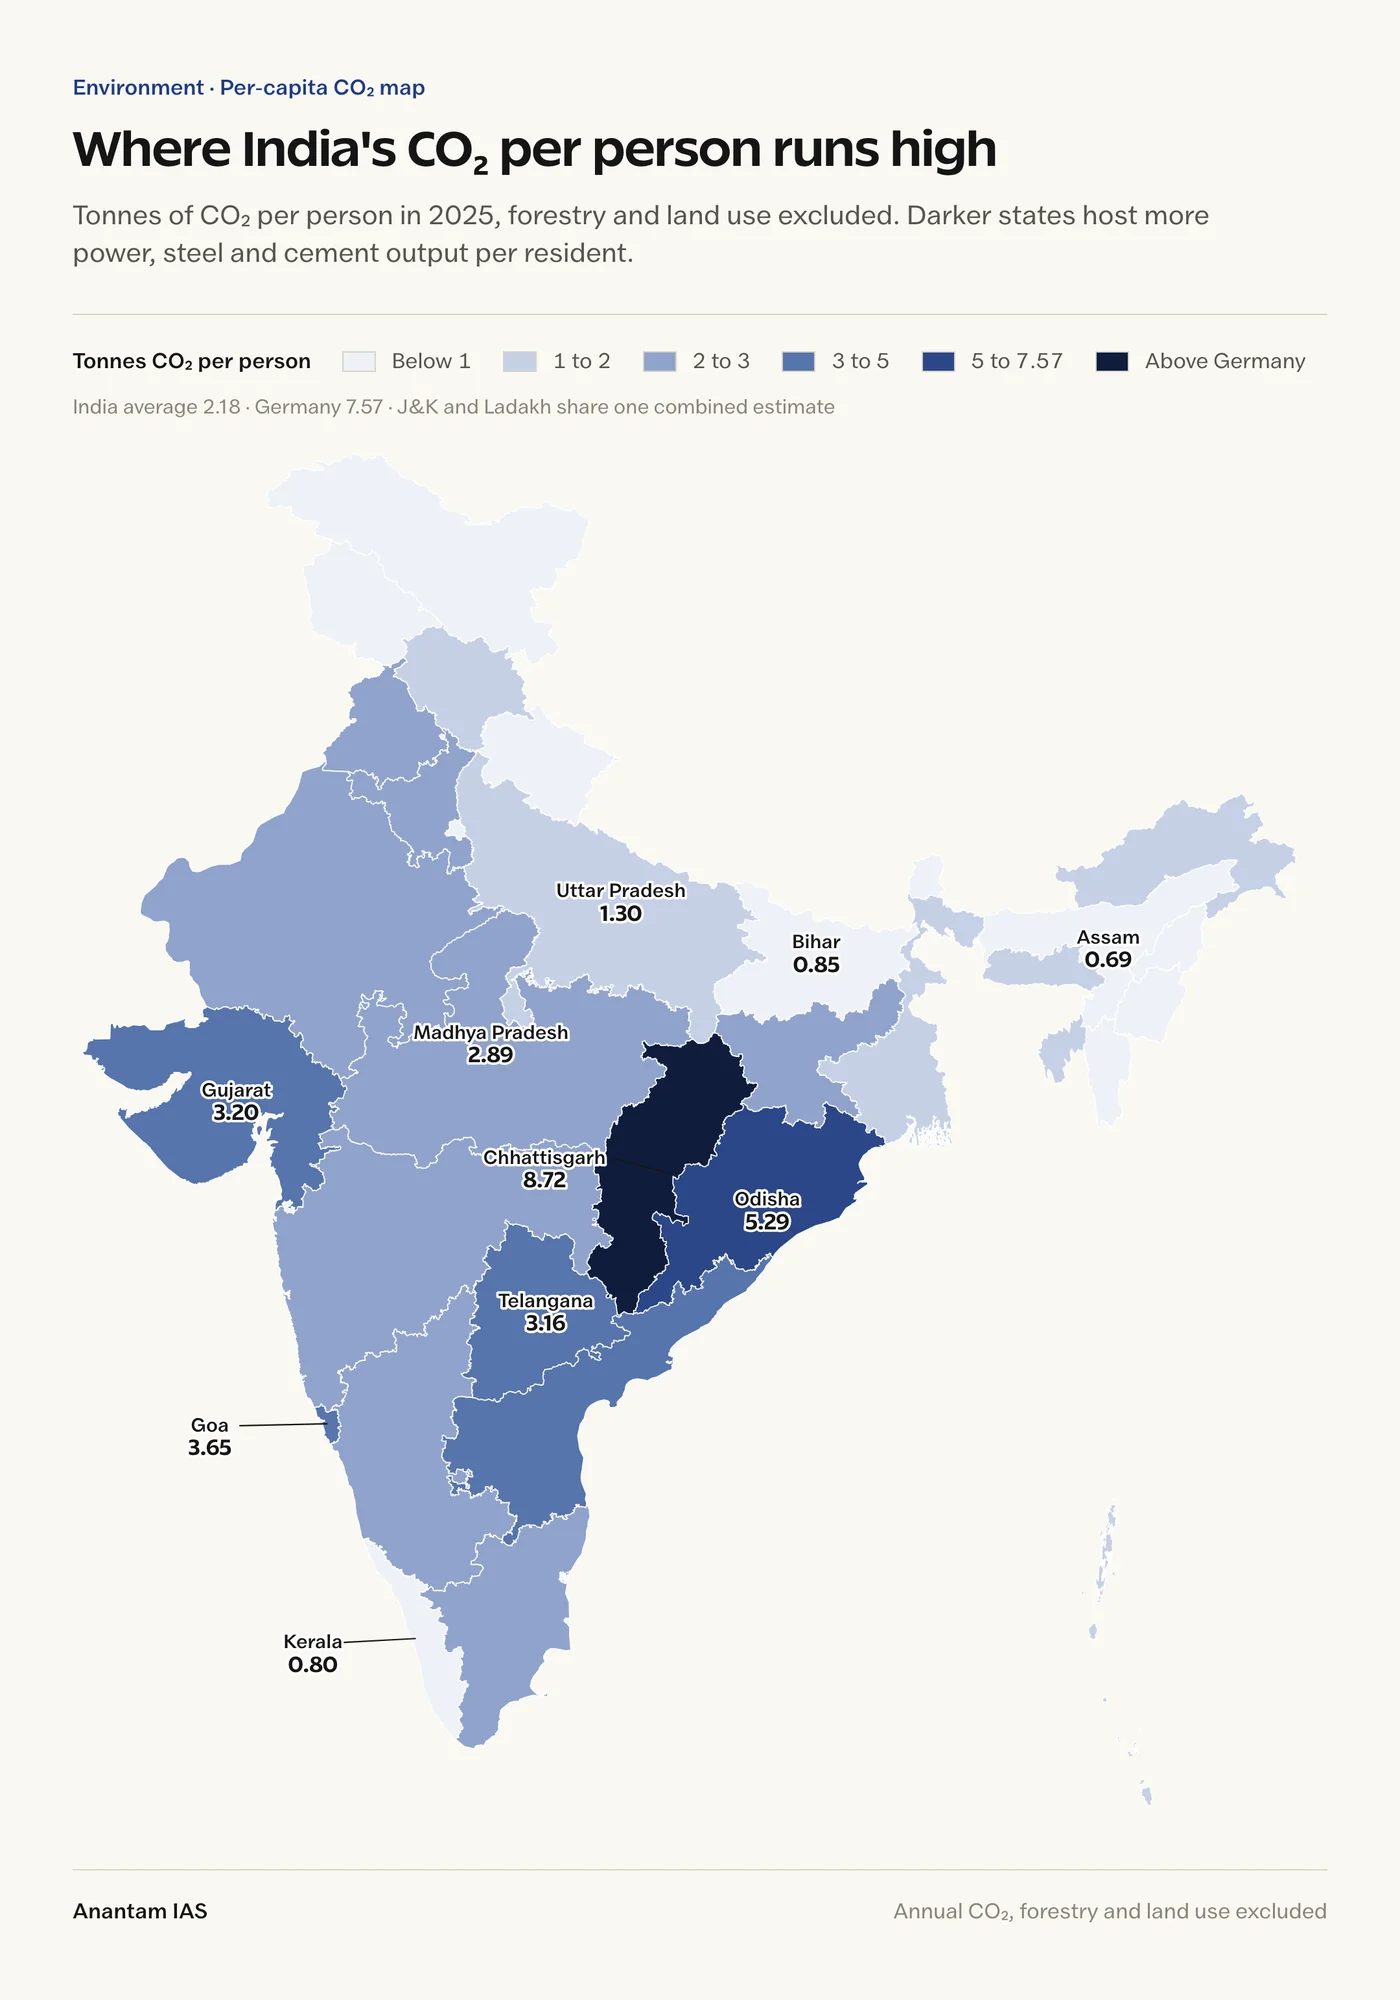
The table covers all 28 states, ordered by the 2024 value. India and Germany are benchmarks, not ranked entries. The last column gives each state’s 2025 total, so you can see how scale and per-person intensity differ.
| State | 2024 (t CO2 per person) | 2025 (t CO2 per person) | 2025 total (Mt CO2) |
|---|---|---|---|
| Germany (benchmark) | 7.62 | 7.57 | 632.0 |
| India (national average) | 2.18 | 2.18 | 3,087 |
| 1. Chhattisgarh | 8.70 | 8.72 | 270.1 |
| 2. Odisha | 5.12 | 5.29 | 248.5 |
| 3. Goa | 3.62 | 3.65 | 5.8 |
| 4. Gujarat | 3.46 | 3.20 | 235.3 |
| 5. Telangana | 3.06 | 3.16 | 121.5 |
| 6. Andhra Pradesh | 3.01 | 3.10 | 165.9 |
| 7. Madhya Pradesh | 2.94 | 2.89 | 257.3 |
| 8. Jharkhand | 2.90 | 2.87 | 116.7 |
| 9. Maharashtra | 2.29 | 2.31 | 296.7 |
| 10. Rajasthan | 2.28 | 2.22 | 184.1 |
| 11. Tamil Nadu | 2.26 | 2.21 | 171.0 |
| 12. Karnataka | 2.25 | 2.33 | 159.9 |
| 13. Punjab | 2.22 | 2.22 | 69.2 |
| 14. Haryana | 2.13 | 2.03 | 63.2 |
| 15. Himachal Pradesh | 1.78 | 1.79 | 13.5 |
| 16. Arunachal Pradesh | 1.68 | 1.71 | 2.7 |
| 17. West Bengal | 1.61 | 1.62 | 161.9 |
| 18. Meghalaya | 1.54 | 1.55 | 5.3 |
| 19. Uttar Pradesh | 1.28 | 1.30 | 314.0 |
| 20. Tripura | 1.06 | 1.06 | 4.5 |
| 21. Uttarakhand | 0.95 | 0.97 | 11.6 |
| 22. Bihar | 0.86 | 0.85 | 111.0 |
| 23. Mizoram | 0.85 | 0.90 | 1.1 |
| 24. Sikkim | 0.76 | 0.79 | 0.6 |
| 25. Kerala | 0.75 | 0.80 | 28.8 |
| 26. Manipur | 0.70 | 0.72 | 2.4 |
| 27. Nagaland | 0.68 | 0.70 | 1.6 |
| 28. Assam | 0.68 | 0.69 | 25.0 |
Union territories are listed separately. Their populations are small, and two of them are measured through combined geographies, so treat their figures with extra care.
| Union territory | 2024 (t CO2 per person) | 2025 (t CO2 per person) | 2025 total (Mt CO2) |
|---|---|---|---|
| Andaman and Nicobar Islands | 1.66 | 1.68 | 0.68 |
| Delhi (NCT) | 1.00 | 0.97 | 21.65 |
| Lakshadweep | 0.92 | 1.17 | 0.08 |
| Jammu and Kashmir + Ladakh (combined) | 0.89 | 0.91 | 12.83 |
| Chandigarh | 0.85 | 0.86 | 1.09 |
| Puducherry | 0.64 | 0.61 | 1.05 |
| Dadra and Nagar Haveli and Daman and Diu | 0.44 | 0.44 | 0.64 |
- Jammu and Kashmir + Ladakh: the dataset still measures these as one combined area, so a single value covers both union territories (population 14.14 million in 2025).
- Dadra and Nagar Haveli and Daman and Diu: the two former UTs are combined, matching the merged union territory.
- Lakshadweep: its jump from 0.92 to 1.17 tonnes comes from a total of under 0.1 Mt. On a base that small, a single new source moves the per-person figure sharply.
How the figures were calculated
The emissions totals come from Climate TRACE, an independent coalition that estimates emissions from individual facilities and sources using satellite data, sensors and statistical models. Every query used the same settings: gas set to CO2 and sectors set to all sectors except forestry and land use. Each annual total was checked for all 12 months.
- Indian population: projected population as on 1 July of each year, from Table 11 of the Report of the Technical Group on Population Projections, 2011-2036 published by the Ministry of Health and Family Welfare.
- German population: Destatis mid-year estimate of 83.51 million on 30 June 2024, and a matching mid-2025 estimate.
- Consistency check: the state and UT totals add up to India’s national total within 0.01% in both years. The small leftover was kept, not redistributed.
- Boundary detail: the dataset files some border areas under separate codes. Arunachal Pradesh is the clearest case: about 1.95 Mt of its 2.65 Mt (2024) sits in a separately coded area. Leave it out and Arunachal’s figure falls from 1.68 to 0.45 tonnes. The table includes these areas, which is why the state totals reconcile with the national figure.
Two cautions matter more than any decimal. These are independent estimates, not official state inventories, and some sources are located with modeled proxies rather than direct measurement. The scope also follows Climate TRACE’s own sector definitions, which don’t match every official inventory convention. Two decimal places help you compare; they don’t mean the numbers are known to that precision.
Which States Are Comparable With Germany?
Only Chhattisgarh crosses Germany in this comparison: about 14% higher in 2024 and 15% higher in 2025. Odisha, the next state down, is about 33% below Germany in 2024 and 30% below in 2025. Nobody else comes close. Goa, at third place, is less than half of Germany’s figure.
That conclusion is conditional, and saying so is what separates a good answer from a quotable one:
- Change the gases (CO2 versus CO2e) and the numbers change.
- Add forestry and land use and forested or deforesting states can move sharply in either direction.
- Change the population base (projections versus a fresh census) and every per-person figure shifts.
- Change the dataset and the absolute levels move. A comparison is only fair when both sides use the same rules, which is why Germany here comes from the same Climate TRACE series rather than an official German inventory.
Two years also can’t prove a trend. Gujarat dropped from 3.46 to 3.20 tonnes, and its total fell by about 6%, but a one-year change can reflect plant outages, weather, fuel switching, data revisions or modeling updates. Calling that “decarbonization” would need a longer, consistently built series.
A Big Total Is Not a High Per-Person Figure
This is the single idea most worth carrying into the exam hall. Uttar Pradesh is India’s largest emitter by total, about 306 Mt in 2024 and 314 Mt in 2025, more than Chhattisgarh. But spread across roughly 241 million people, that’s only 1.30 tonnes per person. Chhattisgarh’s 270 Mt is shared by about 31 million.
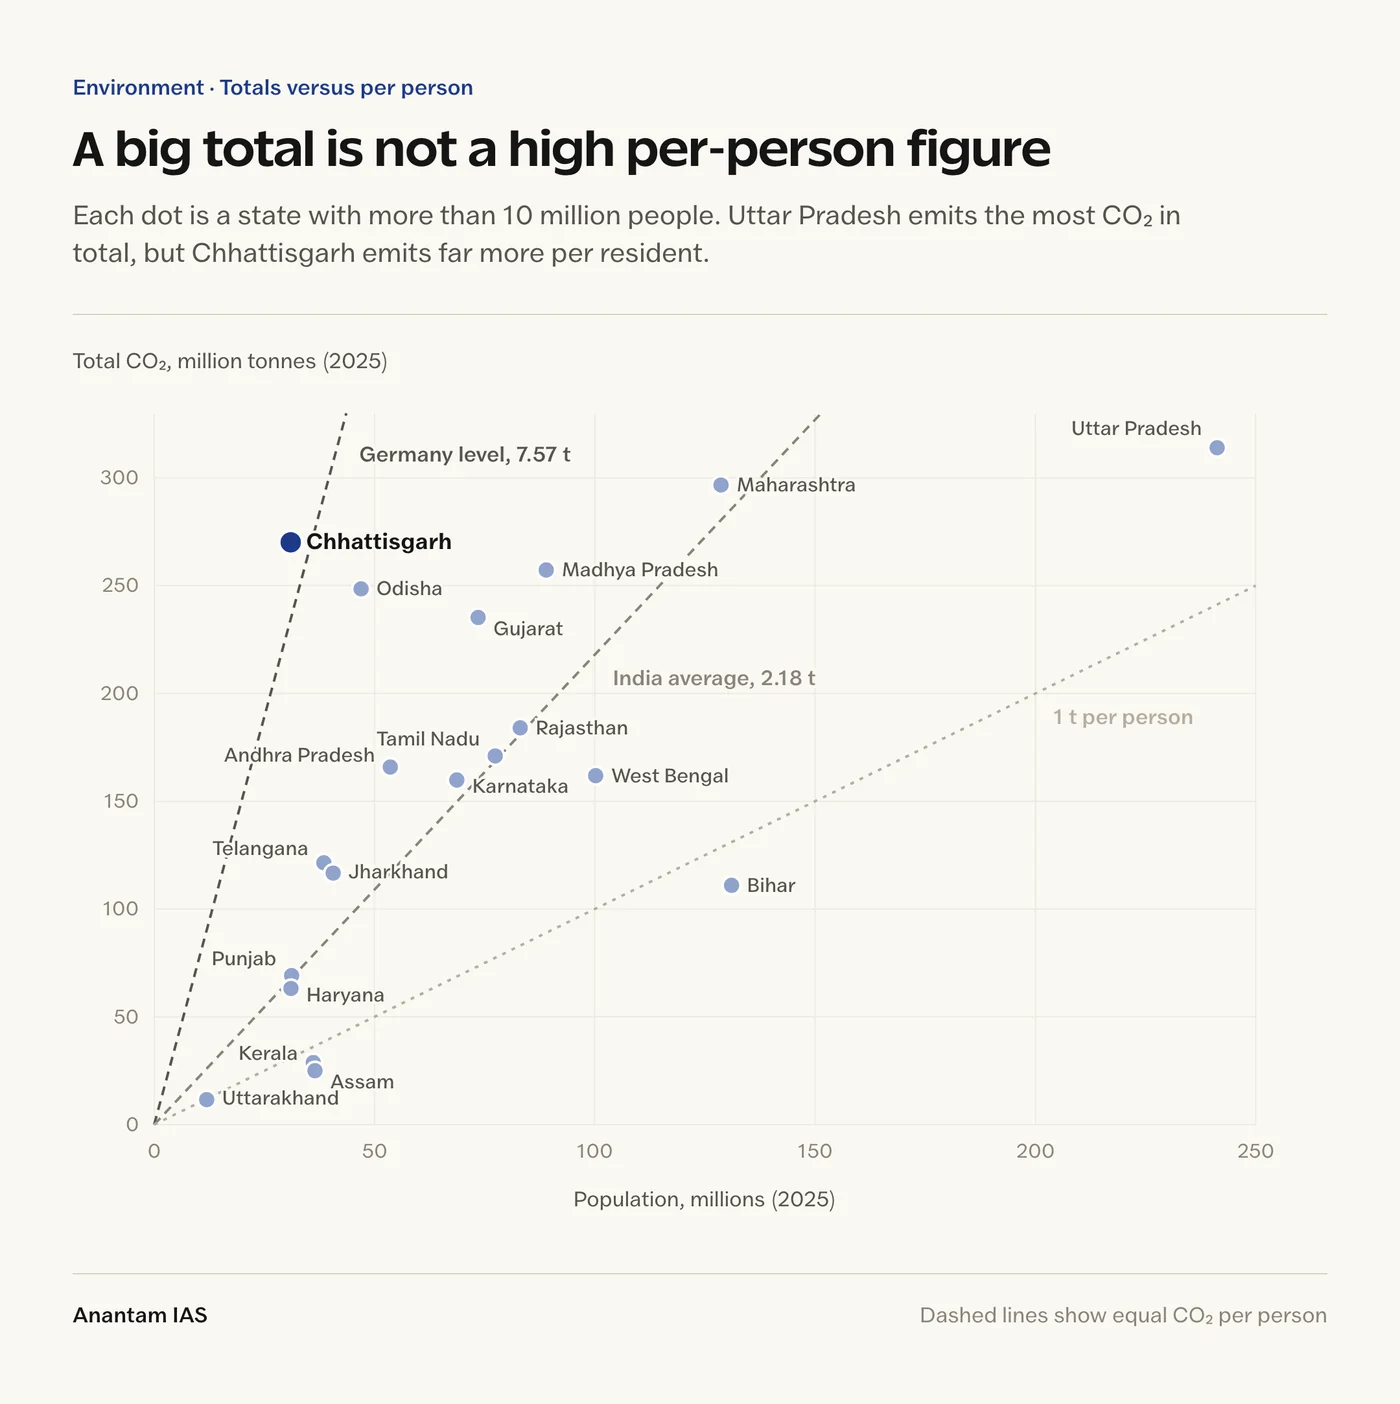
Read the chart along the dashed lines. Every point on the steepest line has the same per-person emissions as Germany; every point on the middle line matches India’s average. Chhattisgarh sits on the Germany side despite a mid-sized total. Bihar, Kerala and Assam sit near or below the 1-tonne line. Population, not just pollution, decides where a state lands.
The same logic explains why India’s national figure is low by global standards while its total is the world’s third largest. Scale and intensity answer different questions, and UPSC questions often test whether you know which one is being asked.
Why Chhattisgarh’s Figure Is So High
The sector breakdown explains Chhattisgarh better than the ranking does. In the 2024 estimate, power generation accounts for about 67% of the state’s CO2, manufacturing for about 21% and fossil fuel operations (mainly coal mining) for about 8%. Transport and buildings together are barely 3%.
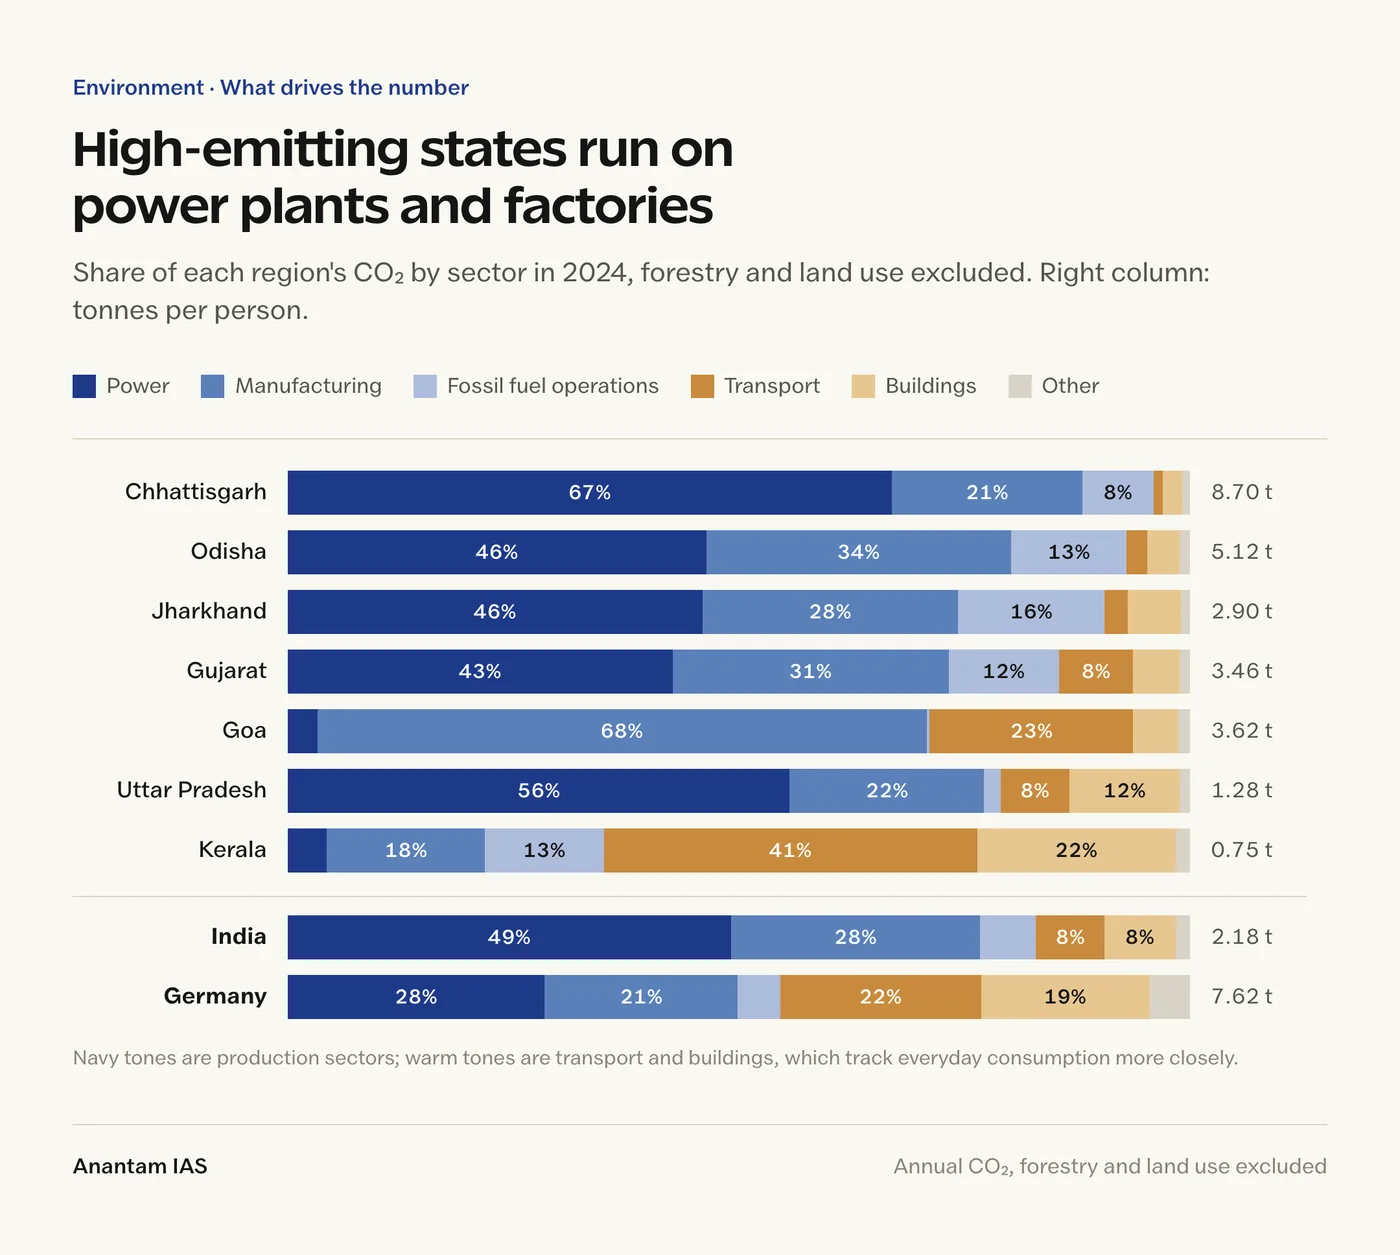
Compare that with Germany, where transport (22%) and buildings (19%) together make up about two-fifths of emissions. Those sectors track how people live: cars, heating, homes. Chhattisgarh’s emissions instead track what the state produces for the rest of India. Korba, often called the power capital of India, hosts several large coal-fired stations, and the state’s coalfields and steel and cement plants feed national supply chains. India’s own mix sits in between, with power at 49% and manufacturing at 28%.
The other high states follow the same pattern with local variations:
- Odisha and Jharkhand: power plus metals and mining, with fossil fuel operations at 13% and 16%.
- Goa: manufacturing alone is about 68% of a small total (5.7 Mt), shared by only about 1.6 million people, so a few industrial units drive the per-person figure.
- Kerala: at the other end, transport (41%) and buildings (22%) dominate, because the state hosts little heavy industry.
Research by the International Institute for Sustainable Development, in its assessment of Chhattisgarh’s energy transition, also points to the state’s dependence on revenue linked to coal and fossil fuels and the need to diversify its economy. That’s why decarbonizing Chhattisgarh isn’t just a matter of swapping boilers for solar panels. It touches state finances, jobs and local development.
Production versus consumption accounting
Here’s the simplest way to see the gap. A coal power station in State A sends half its electricity to State B. Under source-based (production) accounting, all the station’s emissions are recorded in State A. State B’s residents use the power, but the emissions don’t appear in State B’s total.
The same thing happens with steel, cement, aluminum and coal. A tonne of steel made in Raipur and built into a flyover in Mumbai is counted in Chhattisgarh. Under consumption-based accounting, those embodied emissions would move to the region that uses the product.
One honest limit: the table above doesn’t measure interstate electricity flows or reallocate embodied emissions. It shows why production and consumption footprints can differ, not exactly how much of any state’s emissions serve demand elsewhere. And neither framing lets anyone off the hook. A low production figure isn’t proof of good climate policy, and a high one isn’t a license to delay. Producing and consuming regions both have work to do. For the energy-system background, see this guide to thermal electricity in India and the notes on coal power in India.
Why Forestry and Land Use Are Left Out
Land use, land-use change and forestry (LULUCF) answers a different part of the carbon question. Clearing forests, degradation and fires release carbon; growing forests and soils absorb it. Those flows can be large and uncertain, and they behave very differently from smokestack emissions.
In a state with a small population, even a moderate land-use estimate can produce a startling per-person number that has nothing to do with fuel use. That’s why the comparison applies the same exclusion to every region, India and Germany included.
Excluding it doesn’t mean land use is unimportant, or that forest-rich states deserve no credit for removals. A complete assessment would report fossil and industrial CO2 alongside a clearly defined land-use account, show removals separately and avoid double counting. This table can’t tell you whether any state is a net carbon sink, and it shouldn’t be relabeled “total net greenhouse-gas emissions.”
The rule worth remembering: define the boundary before you compare the number. For the forestry side of the story, read about blue carbon and India’s REDD+ project in the Khasi Hills.
What the Comparison Means for Climate Justice
The Chhattisgarh-Germany comparison is a strong hook, but it’s easy to misuse in an answer on climate justice. Three points keep it honest.
National averages hide domestic differences
India’s national average can’t describe every state, district or household. Industrial structure, energy access, income and consumption vary enormously inside the country. But state averages don’t fix the equity problem either. They still blend affluent urban households with poor rural ones, and neither measure captures the consumption footprint of the richest Indians or the development needs of the poorest.
Current emissions don’t erase historical responsibility
India’s Long-Term Low-Emission Development Strategy, submitted to the UNFCCC in 2022, frames its path to net zero by 2070 around equity, national circumstances and common but differentiated responsibilities and respective capabilities (CBDR-RC). A one-year comparison between one Indian state and Germany doesn’t disprove that principle. Germany’s cumulative emissions since industrialization dwarf Chhattisgarh’s, and CBDR-RC is about cooperation between countries.
Nor does CBDR-RC create a formula for dividing effort between Indian states. Inside the country, the useful lesson is different: transition support should reflect each state’s economic dependence on coal, its capacity and its development needs. For the international framework, see the notes on the UNFCCC, the Paris Agreement and India’s LT-LEDS.
A just transition must include workers and state finances
Coal-dependent regions need more than a closure date. Mine workers, contract labor, transporters, local suppliers and state revenues all depend on coal and thermal power. If the transition ignores them, the regions that powered the rest of the country end up carrying a disproportionate share of the cost.
That’s the core of a just transition: pair emission cuts with social protection, credible alternative jobs and economic diversification. India’s RECLAIM framework for closed coal mines is one early attempt; the broader debate is covered in the guide to just transition.
What Policymakers Should Do
The data points to five practical priorities. Each one follows from what the numbers do and don’t show.
- Improve state-level reporting. Publish regular state inventories with consistent sectors, years, boundaries and methods. Separate official inventories from independent estimates, and flag revisions so a methodology change isn’t mistaken for real-world progress.
- Target the dominant sources. In a power-heavy state, cleaner electricity, plant efficiency, transmission and grid flexibility matter most. Heavy industry needs sector-specific measures: material efficiency, recycling and low-carbon processes for steel and cement. Household behavior can’t substitute for these.
- Plan beyond the power plant. Renewable megawatts won’t replace coal jobs or coal revenue one for one. Skills, infrastructure, mine-land restoration and new industries need coordinated planning, ideally starting before closures, not after.
- Share transition costs fairly. Producing states should have a real voice in national decarbonization pathways. Finance and institutional support should reflect how much the rest of the economy depends on their output, without rewarding avoidable emissions growth.
- Keep mitigation and adaptation together. A low-emission state can still face severe heat, floods, water stress or livelihood risk. An emissions ranking is not a vulnerability ranking, and it shouldn’t decide adaptation support on its own.
These are questions of environmental governance and fiscal federalism as much as engineering, which is exactly how GS II and GS III can examine them together.
How to Use This Data in UPSC Answers
This topic sits across GS III (environment, energy and sustainable development) and GS II (climate diplomacy and federalism), and it makes a strong example in the Essay paper. Use it as evidence, not as a headline.
- Always state the scope: “CO2 only, excluding land use, production basis.” One clause shows the examiner you know the limits.
- Pair a total with a per-capita figure: Uttar Pradesh versus Chhattisgarh is the cleanest illustration that scale and intensity differ.
- Name the driver: about two-thirds of Chhattisgarh’s CO2 comes from power generation.
- Separate production from consumption: emissions are recorded where power and steel are made, not where they’re used.
- Close with just transition: decarbonization in coal states affects jobs, revenues and development, so it needs support, not blame.
Here’s my honest take on this topic: the Germany comparison is memorable, and that’s precisely why it’s risky. Used carelessly, it suggests that a state where incomes sit below the national average lives as carbon-intensively as a rich European country, which is false. Used carefully, it’s one of the best illustrations you’ll find of why India’s climate debate needs better accounting and a fair transition. Compare like with like, then explain the economy behind the number.
Frequently Asked Questions
What is India’s per capita carbon emission?
About 2.18 tonnes of CO2 per person in both 2024 and 2025, based on Climate TRACE estimates of CO2 excluding forestry and land use, divided by the Ministry of Health and Family Welfare’s projected population. Datasets with a different scope, such as all greenhouse gases or official inventories, give different figures, so always quote the scope with the number.
Which Indian state has the highest per capita CO2 emissions?
Chhattisgarh, at 8.70 tonnes per person in 2024 and 8.72 tonnes in 2025. Odisha is second at 5.12 and 5.29 tonnes, and Goa third at 3.62 and 3.65 tonnes. Chhattisgarh is the only state above Germany’s 7.62 and 7.57 tonnes in the same dataset.
Which Indian state has the lowest per capita CO2 emissions?
Among states, Assam is lowest at about 0.68 tonnes per person in 2024 and 0.69 tonnes in 2025, with Nagaland and Manipur close behind. Among union territories, Dadra and Nagar Haveli and Daman and Diu is lowest at 0.44 tonnes.
Why are Chhattisgarh’s per capita emissions higher than Germany’s?
Because the state hosts a large share of India’s coal-fired power generation, coal mining, steel and cement production, while only about 31 million people live there. Power accounts for about 67% of its CO2 and manufacturing for about 21%. Much of that output serves consumers in other states, but production-based accounting records the emissions where the plants stand.
Does this mean people in Chhattisgarh have bigger carbon footprints than Germans?
No. Per capita figures divide a region’s production emissions by its population. They don’t measure what residents consume. Incomes in Chhattisgarh are well below Germany’s, and Germany’s emissions are driven far more by transport and buildings, which track everyday consumption. A consumption-based measure would give a very different picture.
What is the difference between production-based and consumption-based emissions?
Production-based accounting records emissions where goods and electricity are produced. Consumption-based accounting reallocates them, through trade, to the region whose demand drives that production. A coal plant in Chhattisgarh supplying power to Maharashtra counts in Chhattisgarh under the first method and partly in Maharashtra under the second.
Are these official government figures?
No. They are independent estimates from Climate TRACE, which models emissions source by source using satellite data and other inputs. India reports its official greenhouse gas inventory to the UNFCCC at the national level and doesn’t publish comparable annual state inventories, which is one reason better state-level reporting matters.
Practice Questions
Prelims MCQs
1. Consider the following statements: 1. High production-based emissions per person necessarily imply high household consumption in that region. 2. CO2-equivalent expresses different greenhouse gases in a common unit using their global warming potential over a specified time horizon. Which of the statements given above is/are correct?
- (a) 1 only
- (b) 2 only
- (c) Both 1 and 2
- (d) Neither 1 nor 2
Answer: (b) Production emissions can serve consumers elsewhere, so statement 1 is wrong. CO2e weights gases by global warming potential, so statement 2 is right.
2. Electricity is generated in one state and consumed in another. Under production-based (source-based) emissions accounting, the power station’s direct emissions are assigned to:
- (a) The generating state
- (b) The consuming state
- (c) Both states in full
- (d) Neither state
Answer: (a) Source-based accounting records emissions where they occur. Counting them in both states would double count.
3. A state has the largest total CO2 emissions in India but per capita emissions below the national average. Which of the following best explains this?
- (a) It has the largest forest cover
- (b) Its total is shared by a very large population
- (c) It imports all its electricity
- (d) Its emissions are measured as CO2e rather than CO2
Answer: (b) Per capita emissions divide the total by population, so a very populous state can have a large total and a low per-person figure, as Uttar Pradesh does.
4. Consider the following statements about land use, land-use change and forestry (LULUCF): 1. It can include both emissions and removals of carbon. 2. A per capita figure that excludes LULUCF shows a region’s net greenhouse gas balance. Which of the statements given above is/are correct?
- (a) 1 only
- (b) 2 only
- (c) Both 1 and 2
- (d) Neither 1 nor 2
Answer: (a) LULUCF covers releases from clearing and fires and removals by growing vegetation. Excluding it means the figure can’t show a net balance.
5. India’s Long-Term Low-Emission Development Strategy, submitted to the UNFCCC, is built around a goal of net zero emissions by:
- (a) 2047
- (b) 2050
- (c) 2060
- (d) 2070
Answer: (d) India announced the 2070 net zero goal at COP26 in Glasgow and set out the pathway in its LT-LEDS in 2022.
Mains Practice Questions
- ‘National per capita emissions conceal regional differences in production and development.’ Discuss the implications for a just transition in India. (15 marks, 250 words)
- Distinguish between production-based and consumption-based emissions accounting. Why does the distinction matter for climate policy in a federal country like India? (10 marks, 150 words)
- Coal-dependent states such as Chhattisgarh, Jharkhand and Odisha face the twin challenge of decarbonization and development. Suggest a policy framework that addresses both. (15 marks, 250 words)
- Some Indian states record per capita CO2 emissions comparable to developed countries. Does this weaken India’s position on common but differentiated responsibilities and respective capabilities (CBDR-RC)? Critically examine. (15 marks, 250 words)
- Why are regular state-level greenhouse gas inventories important for India’s climate governance? Discuss the challenges in preparing them. (10 marks, 150 words)
Tell Google you want more of this.
Add Anantam IAS as a preferred sourceOne tap, and this site shows up more often in your own Top Stories, AI Overviews and AI Mode. Remove it any time.