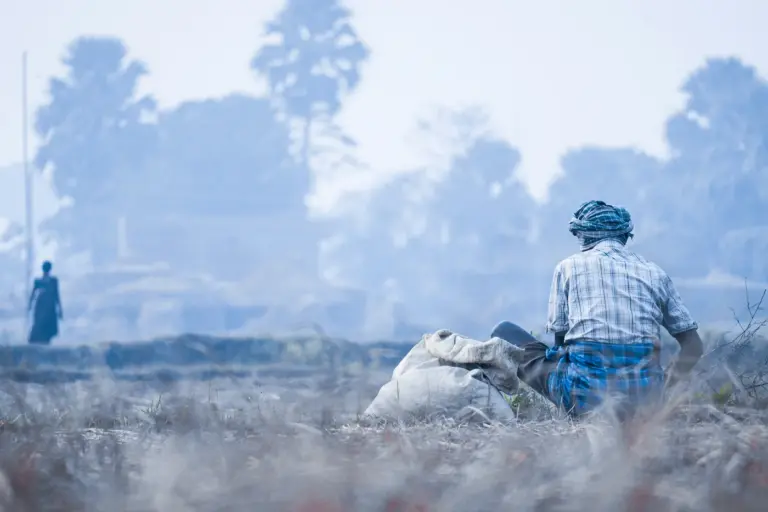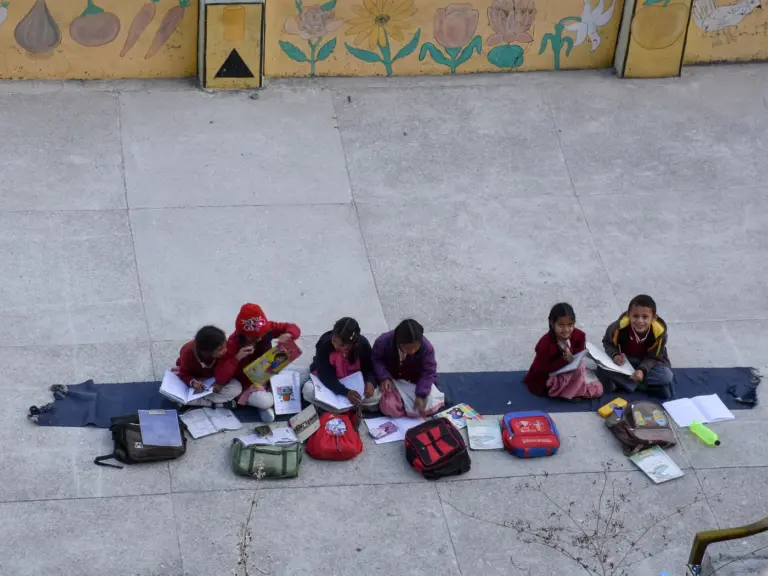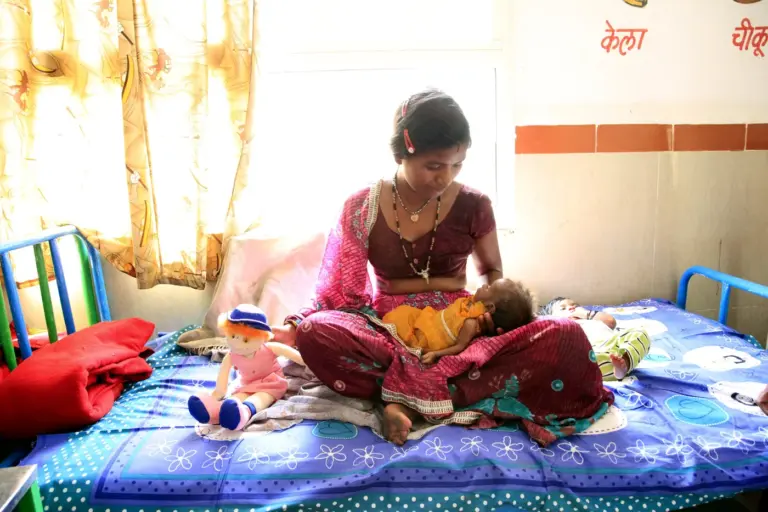
Poverty remains one of India’s most persistent and complex socio-economic challenges. Despite decades of economic growth and a significant reduction in absolute poverty numbers, India still accounts for a large share of the world’s poor. Understanding the causes of poverty requires examining a web of interconnected factors — historical legacies of colonial exploitation, structural inequalities of caste and gender, demographic pressures, unemployment, low agricultural productivity, and regional disparities. Poverty in India is not merely an income problem; it is multidimensional, encompassing deprivations in health, education, living standards, and social dignity.
For UPSC, poverty is a cross-cutting topic spanning Economy (GS3), Society (GS1), and Governance (GS2), with frequent Mains questions on causes, measurement methodologies, and government interventions.
Defining Poverty
Absolute Poverty
A person is in absolute poverty when their income or consumption falls below a defined poverty line — the minimum level needed to meet basic needs (food, clothing, shelter).
Relative Poverty
Relative poverty measures inequality — a person is relatively poor if their income is significantly below the median or average income of the society, even if basic needs are met.
Multidimensional Poverty
The Multidimensional Poverty Index (MPI), developed by the Oxford Poverty and Human Development Initiative (OPHI) and UNDP, goes beyond income to measure deprivations across three dimensions and ten indicators:
| Dimension | Indicators | Weight (each) |
|---|---|---|
| Health | Nutrition, Child mortality | 1/6 each |
| Education | Years of schooling, School attendance | 1/6 each |
| Living Standards | Cooking fuel, Sanitation, Drinking water, Electricity, Housing, Assets | 1/18 each |
A person is considered multidimensionally poor if they are deprived in one-third or more of the weighted indicators.
India’s MPI progress: According to NITI Aayog‘s National MPI (2023), India’s MPI value declined from 0.117 (2015-16) to 0.066 (2019-21), with approximately 13.5 crore people escaping multidimensional poverty in that period.
Causes of Poverty in India
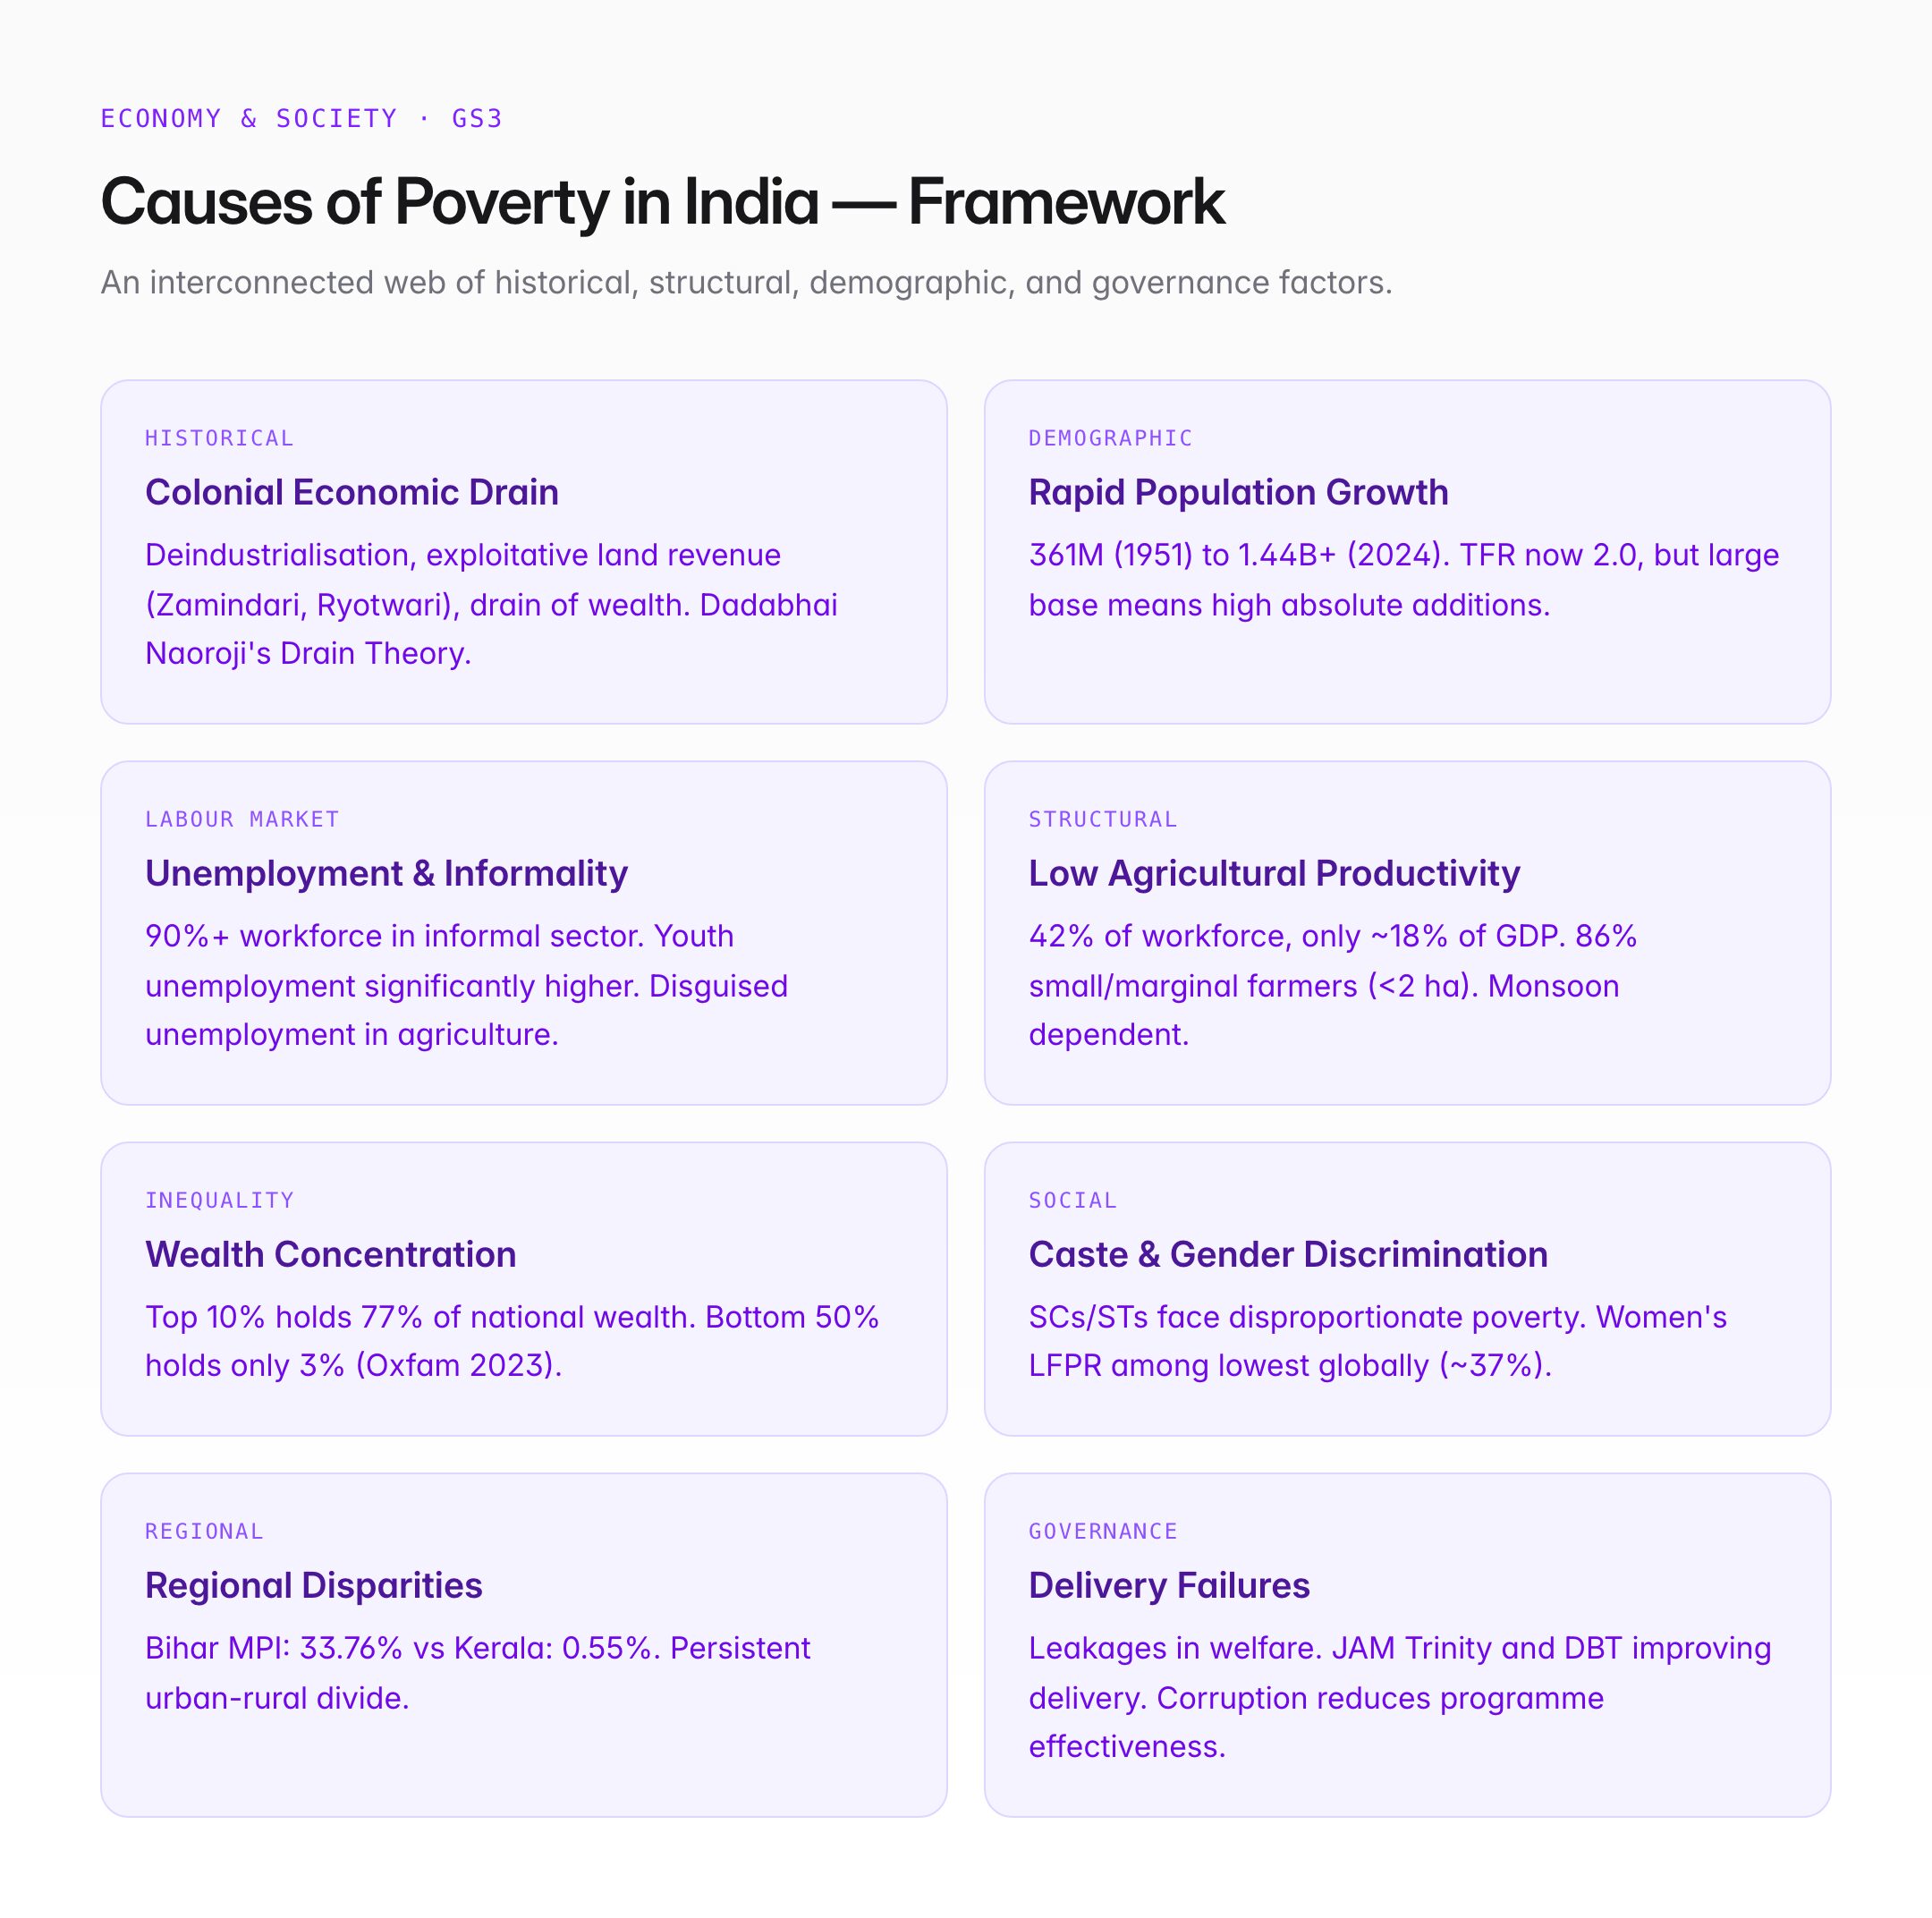
1. Historical — Colonial Economic Drain
- British colonial rule systematically drained India's wealth through deindustrialisation (destruction of handicrafts and textiles), exploitative land revenue systems (Zamindari, Ryotwari), and the drain of wealth to Britain
- Dadabhai Naoroji first articulated the Drain Theory in Poverty and Un-British Rule in India (1901)
- At independence in 1947, India had a per capita income among the lowest in the world and a life expectancy of about 32 years
2. Rapid Population Growth
- India's population grew from 361 million (1951) to over 1.44 billion (2024), putting enormous pressure on resources, employment, and public services
- While the Total Fertility Rate (TFR) has declined to 2.0 (NFHS-5, 2019-21), the large base means absolute population additions remain high
- The demographic dividend can become a demographic disaster if education and employment opportunities do not keep pace
3. Unemployment and Underemployment
- India's labour market suffers from both open unemployment and widespread underemployment (especially in agriculture)
- The Periodic Labour Force Survey (PLFS) 2022-23 reported an unemployment rate of ~5.0% (usual status), but this masks disguised unemployment in agriculture and the informal sector
- Youth unemployment (15-29 years) is significantly higher, particularly among the educated
- The informal sector employs over 90% of India's workforce, offering low wages, no social security, and precarious conditions
4. Low Agricultural Productivity
- Agriculture employs about 42% of India's workforce but contributes only ~18% of GDP — this mismatch is a core driver of rural poverty
- Small and marginal farmers (holdings <2 hectares) constitute over 86% of all farmers
- Challenges: fragmented landholdings, dependence on monsoon rainfall, poor irrigation coverage, low mechanisation, inadequate credit access, and middleman exploitation
- Disguised unemployment in agriculture means many workers produce near-zero marginal output
5. Inequality and Concentration of Wealth
- India has one of the highest levels of wealth inequality in the world
- Oxfam India (2023): The top 10% of the population holds 77% of the national wealth; the bottom 50% holds only 3%
- Income inequality is compounded by inequalities in land ownership, education access, and digital access
6. Caste-Based Discrimination
- Scheduled Castes (SCs) and Scheduled Tribes (STs) experience disproportionately higher poverty rates due to centuries of social exclusion, occupational restrictions, and limited access to education and land
- Despite constitutional protections (Articles 15, 17, 46) and affirmative action (reservations), caste-based economic disparities persist
- Bonded labour, though legally abolished (Bonded Labour System Abolition Act 1976), continues in pockets
7. Regional Disparities
- Poverty is not uniformly distributed. States like Bihar, Jharkhand, Uttar Pradesh, Madhya Pradesh, and Odisha have significantly higher poverty rates than Kerala, Goa, Punjab, and Himachal Pradesh
- Urban-rural divide: Rural poverty rates are consistently higher than urban rates, though urban poverty is concentrated in slums
| State | MPI Headcount Ratio (2019-21) | Category |
|---|---|---|
| Bihar | 33.76% | Highest poverty |
| Jharkhand | 28.82% | Very high |
| Uttar Pradesh | 22.93% | High |
| Madhya Pradesh | 20.63% | High |
| Kerala | 0.55% | Lowest poverty |
| Goa | 3.76% | Very low |
8. Inadequate Education and Skill Development
- Low human capital formation perpetuates the poverty cycle
- Literacy rate (Census 2011): 74.04% (male: 82.14%, female: 65.46%)
- Quality of education remains poor in government schools, leading to low employability
- Skills mismatch between what the education system produces and what the labour market demands
9. Gender Inequality
- Women's labour force participation rate in India is among the lowest in the world (~37%, PLFS 2022-23)
- Wage gap: Women earn significantly less than men for comparable work
- Lack of property rights, limited mobility, and social norms restrict women's economic participation
- Female-headed households are more vulnerable to poverty
10. Governance Failures
- Leakages in welfare delivery: Rajiv Gandhi famously stated that only 15 paise of every rupee spent on poverty alleviation reaches the intended beneficiary
- Corruption, bureaucratic inefficiency, and poor targeting of subsidies reduce the effectiveness of anti-poverty programmes
- JAM Trinity (Jan Dhan-Aadhaar-Mobile) and Direct Benefit Transfer (DBT) have improved delivery in recent years
Poverty Measurement in India — Key Committees
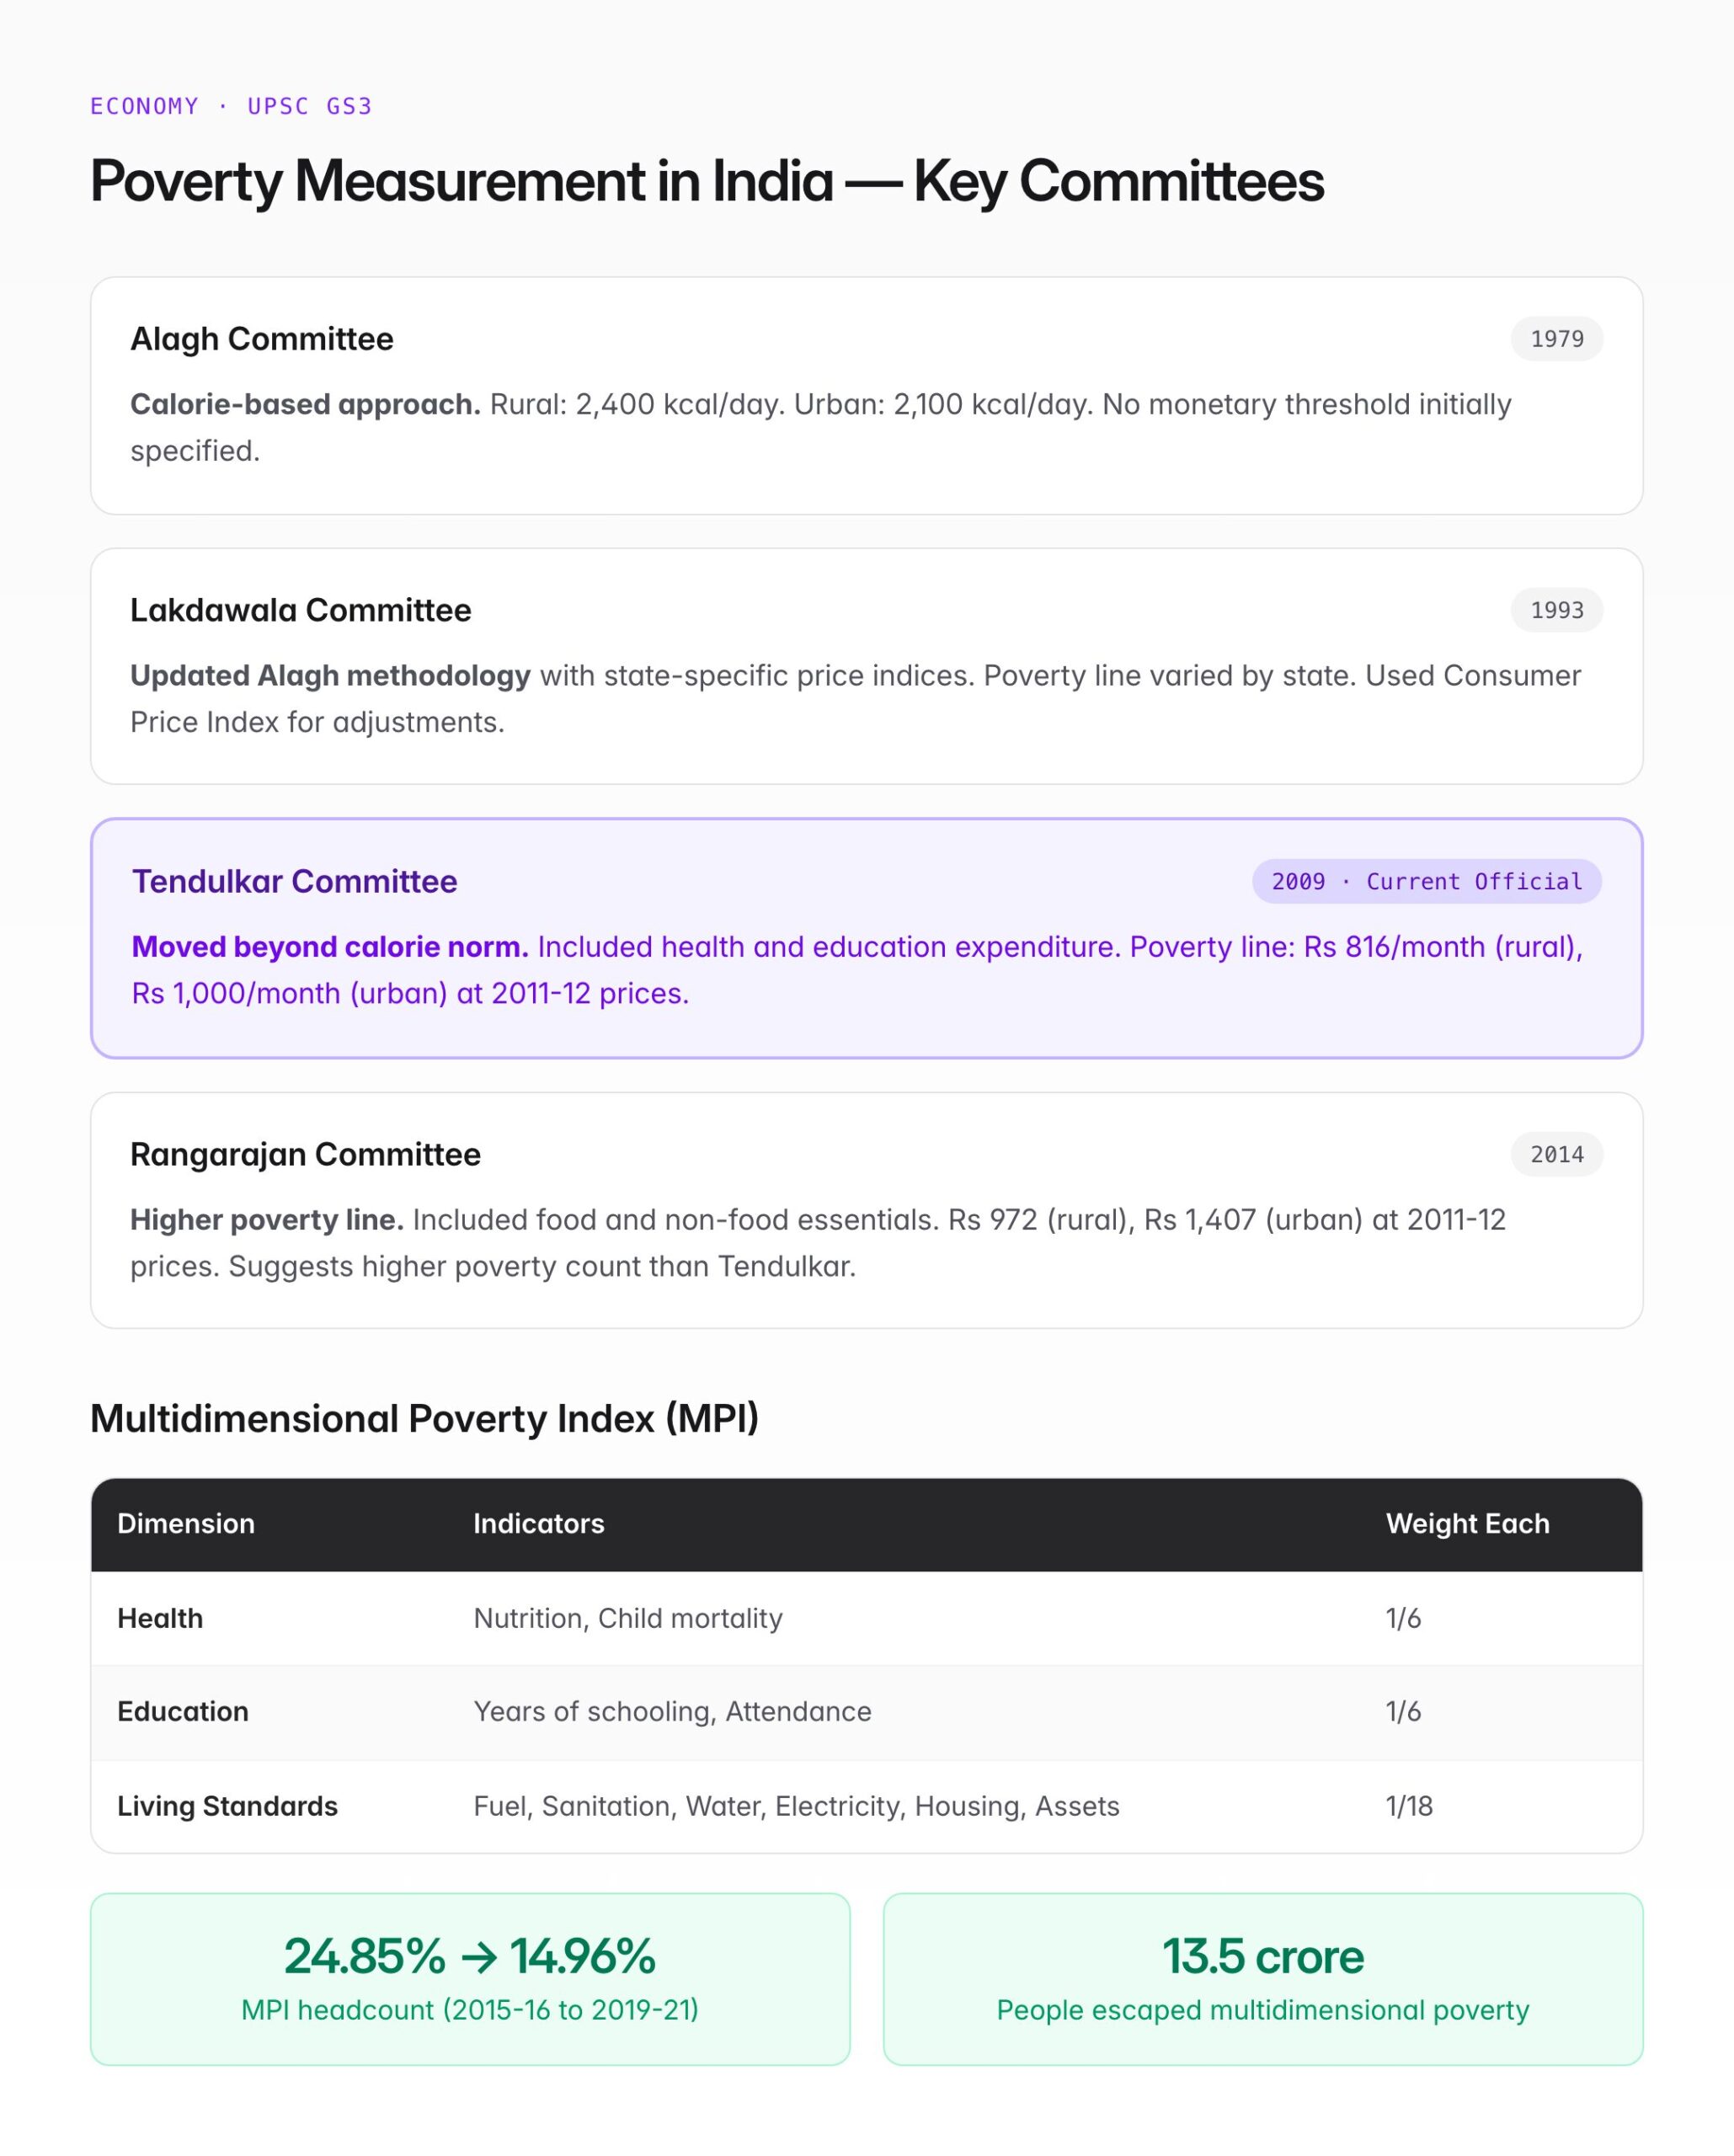
| Committee | Year | Methodology | Poverty Line (Monthly Per Capita) |
|---|---|---|---|
| Alagh Committee | 1979 | Calorie-based (2400 kcal rural, 2100 kcal urban) | Not specified in monetary terms initially |
| Lakdawala Committee | 1993 | Updated Alagh with state-specific price indices | Varied by state |
| Tendulkar Committee | 2009 | Moved beyond calorie norm; included health, education expenditure | Rs 816 (rural), Rs 1000 (urban) — at 2011-12 prices |
| Rangarajan Committee | 2014 | Higher poverty line; included food and non-food essentials | Rs 972 (rural), Rs 1407 (urban) — at 2011-12 prices |
Current status: The government uses the Tendulkar methodology as the official benchmark, though the Rangarajan estimates suggest a higher poverty count. No new official poverty line has been adopted since.
Major Government Programmes for Poverty Alleviation
| Programme | Year | Focus |
|---|---|---|
| MGNREGA | 2005 | 100 days guaranteed rural employment |
| PMAY (Pradhan Mantri Awas Yojana) | 2015 | Housing for all |
| PM-KISAN | 2019 | Direct income support to farmers (Rs 6,000/year) |
| National Food Security Act (NFSA) | 2013 | Subsidised food grains to ~67% of population |
| Deendayal Antyodaya Yojana (DAY-NRLM) | 2011 | Women's SHG-based livelihoods |
| Ayushman Bharat (PM-JAY) | 2018 | Health insurance for bottom 40% families |
UPSC Relevance
GS Paper I: Society — Social stratification, caste, regional disparities, urbanisation and poverty.
GS Paper III: Economy — Poverty measurement, poverty alleviation programmes, inclusive growth, employment.
GS Paper II: Governance — Welfare schemes, DBT, JAM, effectiveness of government intervention.
Key Points for Prelims
- Multidimensional Poverty Index (MPI) measures deprivations across health, education, and living standards (10 indicators)
- Tendulkar Committee (2009) is the current official methodology for poverty estimation
- Rangarajan Committee (2014) proposed a higher poverty line than Tendulkar
- India's MPI headcount declined from 24.85% (2015-16) to 14.96% (2019-21) per NITI Aayog
- MGNREGA guarantees 100 days of employment; demand-driven, rights-based programme
- NFSA 2013 covers ~67% of population (75% rural, 50% urban) with subsidised food grains
- Drain Theory was propounded by Dadabhai Naoroji
- Agriculture employs ~42% of workforce but contributes ~18% of GDP — a key structural cause of poverty
- Bihar has the highest MPI headcount ratio; Kerala has the lowest
Tell Google you want more of this.
Add Anantam IAS as a preferred sourceOne tap, and this site shows up more often in your own Top Stories, AI Overviews and AI Mode. Remove it any time.