
Why in News
India’s Ministry of Statistics and Programme Implementation (MoSPI) released a new national accounts series with 2022–23 as the base year, replacing the earlier 2011–12 base year. The new series introduces updated data sources and improved statistical methods to measure economic growth more accurately.
UPSC Relevance:
GS III: Economy
What is GDP and Base Year?
GDP
Gross Domestic Product (GDP) is the total value of all final goods and services produced within a country during a given period.
Base Year
The base year is the reference year used to calculate real GDP (GDP at constant prices) by removing the effect of inflation.
Example
If base year = 2022-23, prices of that year are used to compare output in other years.
Why is base year revision done?
The base year is revised periodically to reflect structural shifts in the economy and to improve the accuracy of economic estimates. Such updates allow for methodological refinements and the integration of more comprehensive and reliable data sources.
The United Nations System of National Accounts (SNA 1993) recommends base-year updates every five years. India, which had historically revised roughly once per decade, is now committing to a more regular five-year cycle — a significant step towards aligning with global statistical best practices.
The last base year change was from 2004–05 to 2011–12 done in 2015.
Why was 2022–23 specifically chosen?
The year 2022–23 was chosen as the anchor because it represents the first stable post-COVID economic year — after the sharp contractions of 2019–21 and the recovery bounce of 2021–22. A stable, non-shock year is always preferred as the base.
Timeline of GDP Base Year in India
| Series | Base Year | Key Feature |
| Old series | 2004-05 | First major modern update |
| Previous series | 2011-12 | Introduced MCA-21 corporate database |
| New series | 2022-23 | Uses GST, digital data and improved methods |
Key methodological changes
1. Double deflation (biggest change)
The most important methodological change is the shift from the “single-deflator” method to the “double-deflation” method for calculating real Gross Value Added (GVA). In the old method, only output was adjusted for prices. Now, both output and intermediate inputs are separately deflated — making the measurement of real value addition far more precise.
Double deflation is being applied in sectors like manufacturing and agriculture. In other sectors, single extrapolation is being used. Deflators are being applied at a more detailed, granular level. These changes are expected to improve the accuracy and reliability of GDP deflators in the new series.
Real Value Added = Real Output – Real Intermediate Inputs
This improves accuracy especially in manufacturing where input prices and output prices move differently.
2. New data sources integrated
The revised series incorporates administrative datasets such as GST Network data and Public Financial Management System (PFMS) records.
| Data Source | Purpose |
| GST data | Business activity and value addition |
| e-Vahan | Automobile sector output |
| PFMS | Government expenditure |
| Corporate filings | Corporate sector performance |
| Household surveys | Consumption estimates |
These improve the coverage of the formal and informal economy.
3. Supply and Use Tables (SUT) framework
The new series provides a more accurate, consistent framework through the SUT structure, improving transparency and internal consistency across sectors.
| Supply Side | Use Side |
| Domestic production | Consumption |
| Imports | Investment |
| Exports |
This reduces statistical discrepancies.
4. Improved Measurement of the Informal Sector
Earlier approach
- Benchmarks from older surveys
New approach – New surveys incorporated
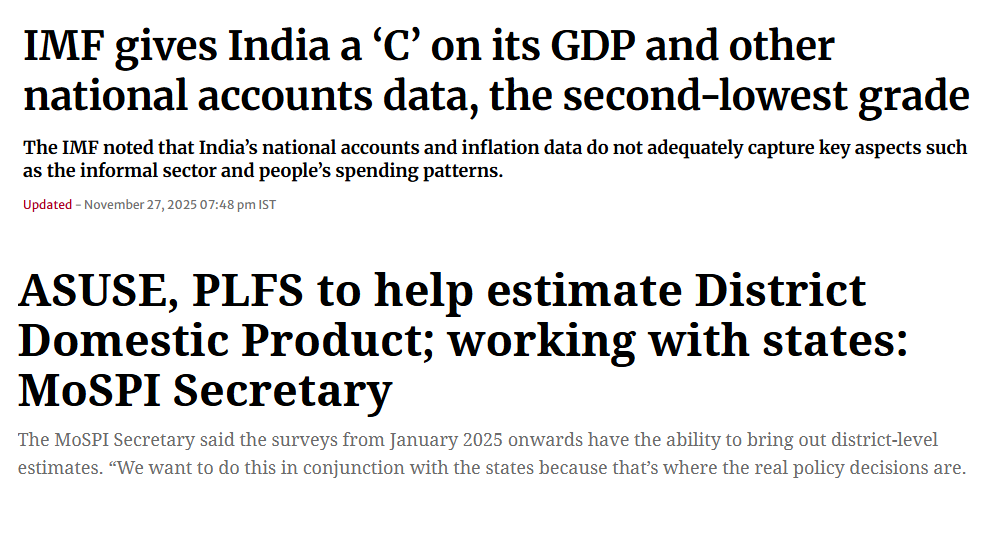
- Uses Annual Survey of Unincorporated Sector Enterprises (ASUSE)
- Combined with Periodic Labour Force Survey (PLFS) data
This allows annual estimates of the unorganised sector, instead of extrapolating old benchmarks.
5. Segregation of multi-activity enterprises
Enterprises engaged in multiple sectors are now separately classified, improving sectoral attribution.
Earlier method
- Entire company output assigned to dominant sector
New method
- Output allocated activity-wise based on revenue shares
Example
A company involved in manufacturing and services will now contribute to both sectors appropriately.
6. Improved Price Deflators
The new GDP estimates use more granular price indices (around 500–600 items from CPI and WPI) compared with around 180 earlier.
This improves inflation adjustment accuracy.
What do the new numbers say?
Absolute Size and Nominal Growth
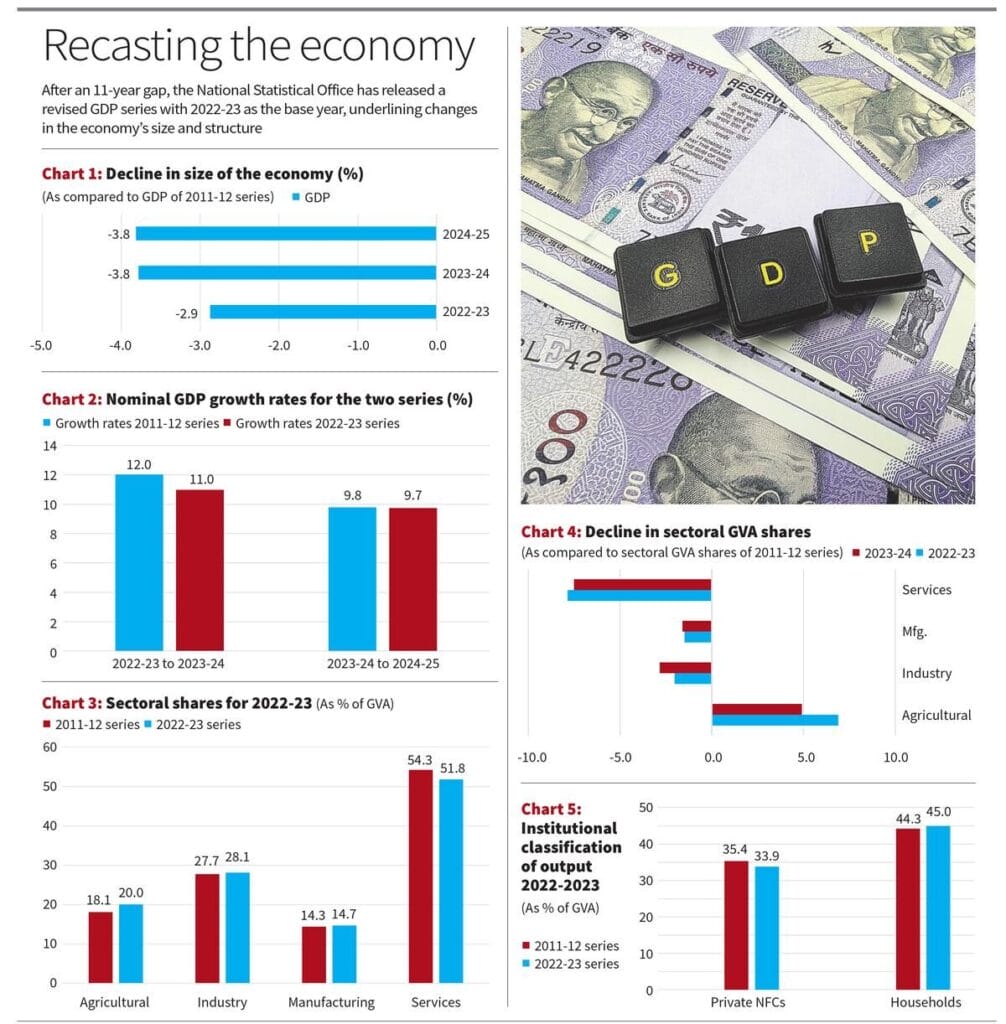
- Smaller Denominator: The absolute nominal GDP for FY26 is now estimated at ₹345 lakh crore, roughly 3.3% lower than the previous estimate of ₹357 lakh crore.
- Historical Downward Revision: Nominal GDP levels for the past three years (FY24–FY26) were reduced by 3% to 4% compared to the old series.
- Nominal Growth Rate: Despite the lower base, nominal growth for FY26 is projected at 8.6%.
Real GDP Growth Revisions
The new series, based on 2022-23 prices, changed the growth trajectory as follows:
- FY24: Revised down to 7.2% from the earlier estimate of 9.2%.
- FY25: Revised up to 7.1% from the earlier 6.5%.
- FY26: Projected at 7.6%, higher than the 7.4% estimated under the old series.
The 2022–23 GDP has been revised to ₹261 lakh crore (from the previously reported ₹269 lakh crore), and FY 2025–26 GDP is estimated at ₹345 lakh crore (earlier ₹357 lakh crore). Per capita annual income is now ₹2,43,180 (earlier ₹2,51,393).
What are the Fiscal implications of these changes?
- Nominal GDP is now lower by 3–4%, even though real growth is higher. This creates a paradox with fiscal ratios:
- The fiscal deficit for FY26 is now estimated at 4.51% of GDP instead of 4.36%, even though the absolute deficit amount remains unchanged. Similarly, the debt-to-GDP ratio for FY27 is pegged at 57.5%, compared to the earlier target of 55.6%. This makes the government’s debt consolidation path toward its FY2031 target of reducing debt to 50% of GDP steeper.
- To achieve the targeted 4.3% fiscal deficit for 2026–27, the economy will now require a massive nominal growth rate of 13–14%, notably higher than the 10% assumption in Union Budget 2026–27, indicating the government may need to aggressively recalibrate its borrowing strategies.
- On the $5 trillion goal: GDP in FY 2025–26 stands at about $3.9 trillion at ₹88 per USD (earlier $4 trillion), indicating India is further from the $5 trillion target. India is expected to comfortably cross the $4 trillion mark during FY 2026–27.
IMF context:
In November 2025, the IMF awarded India’s national accounts data a ‘C’ grade in its Data Adequacy for Surveillance (DAS) assessment. While India scored an ‘A’ for timeliness of data releases and a ‘B’ for granularity, its coverage quality — especially of the informal sector and use of outdated base-year data — drew sharp criticism. The new series directly addresses these concerns.
For how many year will the Back-series data be provided?
Back-series data is expected to be released by December 2026. As per the practice, in India, back-series estimates are recalculated using revised methodology of the new GDP series up to the previous base year. After that, the data is linked at a disaggregated level and extended back to 1950-51. However, the final method for preparing the back-series will be decided in consultation with the Advisory Committee set up to guide MoSPI.
Comparison with the international statistical standards:
India prepares GDP estimates according to the 2008 System of National Accounts (SNA 2008). The UN is now moving toward SNA 2025, and countries are expected to adopt it around 2029–30. India plans to adopt SNA 2025 in its next base year revision.
What are the Criticisms and Challenges?
- Heavy reliance on Ministry of Corporate Affairs data may overstate large firms’ performance while underestimating MSMEs that do not file timely returns.
- The WPI base year revision must also be completed swiftly to ensure that deflators used across all sectors represent current market realities.
- Administrative data (GST, corporate filings) may have reporting errors.
- Despite improvements, the unorganised sector is still difficult to measure accurately.
- New methodology makes comparison with older data difficult.
Conclusion
The new GDP series represents an important step toward modernising India’s statistical system, improving reliability of economic measurement and enabling better policy making, though continued improvements in data quality and transparency remain essential.
Practice MCQs:
With reference to the revised GDP series with 2022-23 as the base year, consider the following statements:
- The base year is used to remove the effect of inflation while calculating real GDP.
- India revises the GDP base year periodically to reflect structural changes in the economy.
- The base year revision directly changes the size of the population used for GDP calculation.
Which of the statements given above are correct?
A. 1 only
B. 1 and 2 only
C. 2 and 3 only
D. 1, 2 and 3
Answer: B
Which of the following data sources are used in the new GDP series with base year 2022-23?
- GST data
- Corporate filings database
- Periodic Labour Force Survey
- e-Vahan vehicle registration data
Select the correct answer using the code below.
A. 1 and 2 only
B. 1, 2 and 3 only
C. 1, 2 and 4 only
D. 1, 2, 3 and 4
Answer: D
Consider the following statements regarding Supply-Use Tables (SUT) used in national accounts:
- They help reduce statistical discrepancies in GDP estimation.
- They are used only for calculating agricultural GDP.
- They match production data with expenditure data in the economy.
Which of the statements given above are correct?
A. 1 only
B. 1 and 2 only
C. 2 and 3 only
D. 1, 2 and 3
Answer: C
The concept of double deflation, recently introduced in India’s revised GDP series, refers to:
A. Adjusting GDP for inflation using two different price indices
B. Separately deflating output and intermediate inputs to estimate real value added
C. Using both CPI and WPI simultaneously to estimate GDP
D. Removing inflation from both nominal GDP and per capita GDP
Answer: B
Which of the following indicators may be affected when nominal GDP estimates are revised?
- Fiscal deficit-to-GDP ratio
- Debt-to-GDP ratio
- Tax-to-GDP ratio
Select the correct answer using the code below.
A. 1 only
B. 1 and 2 only
C. 1, 2 and 3
D. 2 and 3 only
Answer: C
Which of the following best describes Gross Value Added (GVA)?
A. Total value of all goods produced in the economy
B. Value of output minus the value of intermediate inputs
C. GDP minus government expenditure
D. GDP adjusted for population
Answer: B
Tell Google you want more of this.
Add Anantam IAS as a preferred sourceOne tap, and this site shows up more often in your own Top Stories, AI Overviews and AI Mode. Remove it any time.