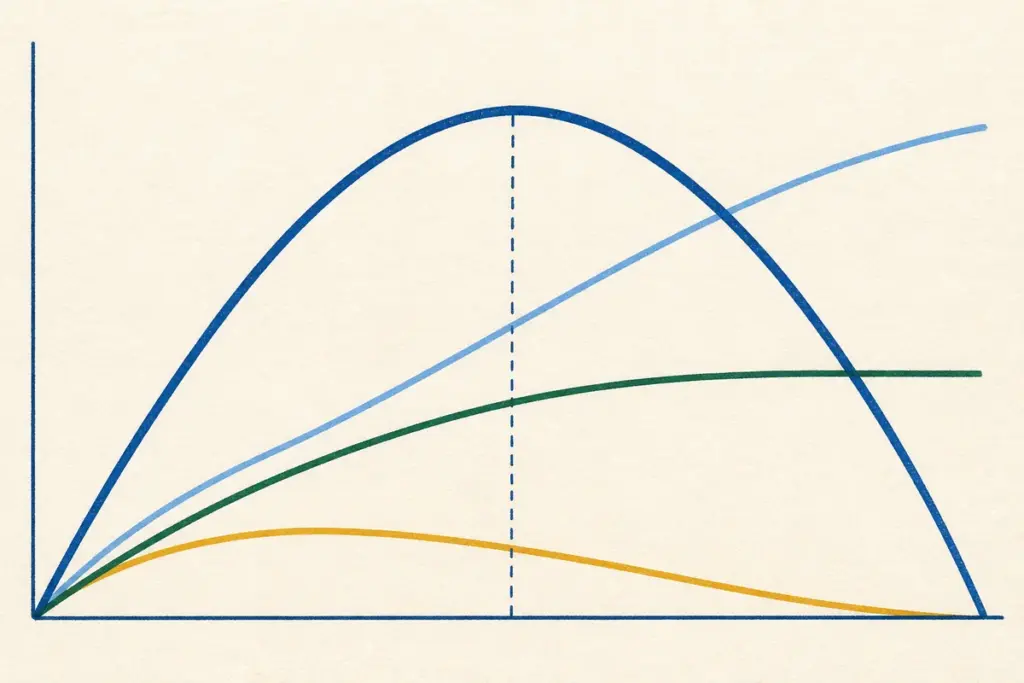
The environmental Kuznets curve proposes that environmental damage rises with income to a turning point and then falls, tracing an inverted U. It is one of the most cited and most misused ideas in development geography, and the useful thing about it is not whether it is true but which kinds of damage it fits and which it does not.
Applied to India, it fits one category of pollution well, fails completely for a second, and cannot describe a third at all.
The Original Claim
Simon Kuznets proposed in 1955 that income inequality rises during early industrialisation and falls later. The environmental version, developed in the early 1990s by Grossman and Krueger, applied the same shape to pollution. Three mechanisms are offered for the downturn.
- The scale effect raises damage: more output means more emissions and more resource use.
- The composition effect reduces it: an economy shifts from agriculture through heavy industry to services, and services pollute less per unit of output.
- The technique effect reduces it further: richer societies can afford cleaner technology and, importantly, begin to demand it politically.
The curve turns over when the composition and technique effects together overtake the scale effect.
Where the Curve Holds
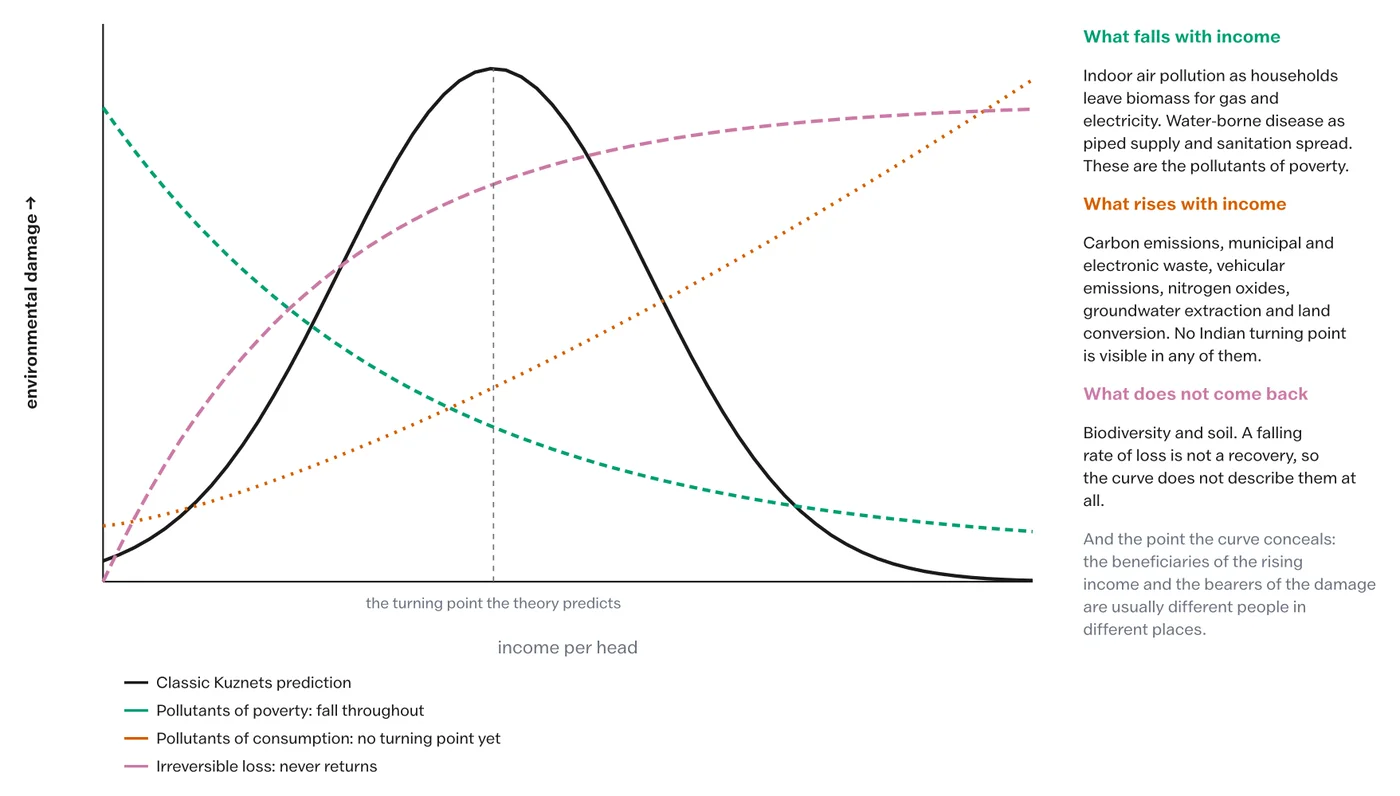
It holds reasonably well for what can be called the pollutants of poverty: local, visible, health-damaging and technically easy to fix.
- Indoor air pollution falls sharply as households move from biomass to gas and electricity for cooking.
- Water-borne disease falls as piped supply and sanitation spread.
- Sulphur dioxide and particulates from point sources fall once scrubbers are affordable and enforced.
Note that these do not merely fall after a turning point; for several of them the relationship is monotonically downward from the start, which is a different shape from the inverted U and worth saying so.
Where It Fails
It fails for the pollutants of consumption: diffuse, global, generated by affluence itself rather than by production technique.
| Category | Behaviour with rising income | Indian evidence |
|---|---|---|
| Carbon emissions | Rise with income; no turning point observed anywhere at current levels | Per capita emissions rising with GDP |
| Municipal and electronic waste | Rise with income and with urbanisation | Volumes rising faster than collection capacity |
| Vehicular emissions and nitrogen oxides | Rise with vehicle ownership | NOx rising even where particulates have been addressed |
| Groundwater extraction | Rises with irrigation investment and urban demand | Blocks moving from safe to over-exploited |
| Land conversion | Rises with construction | Peri-urban farmland lost continuously |
For these there is no observed turning point in India, and the honest statement is that the curve’s mechanism does not apply: the composition effect does not help when the damage comes from consumption rather than from production, and the technique effect cannot offset a rising volume of consumers.
The Category the Curve Cannot Describe At All
A third category defeats the shape entirely: irreversible losses.
- Biodiversity. A species lost does not return when income rises. A falling rate of loss is not a recovery.
- Soil. Topsoil forms over centuries and is lost in years.
- Aquifer structure. An over-drawn aquifer can compact, permanently reducing the volume it can ever hold again.
For these the correct statement is not that the curve turns later, but that the curve is the wrong instrument, because it plots a flow when the thing at risk is a stock.
A falling rate of loss is not a recovery. Where the damage is irreversible, the shape of the curve is beside the point.
Four Standing Criticisms
- It may reflect displacement rather than improvement. Rich countries reduced domestic industrial pollution partly by importing goods whose production pollutes elsewhere. The global total did not fall; the map changed.
- It is not automatic. Where the downturn has happened it followed regulation, litigation and public pressure, not income alone. Treating it as a natural consequence of growth removes the very mechanism that produced it.
- It conceals distribution. The beneficiaries of the rising income and the bearers of the damage are usually different people in different places. A national average curve hides that entirely.
- The turning points are high. Where estimated, they often lie at income levels well above what most developing countries will reach for decades, which makes the curve useless as a policy timetable.
What It Means for Indian Policy
The policy reading follows directly from the three categories.
- For the pollutants of poverty, growth genuinely helps, and programmes that accelerate the transition, such as clean cooking fuel and piped sanitation, are working with the grain of the curve.
- For the pollutants of consumption, waiting for a turning point is not a strategy. These require decoupling by deliberate policy: emission standards, pricing, public transport and renewable capacity.
- For irreversible losses, the curve gives no guidance at all, and the operative principle is precaution rather than growth.
Stated that way, the environmental Kuznets curve becomes a useful analytical device rather than an excuse: it tells you which environmental problems growth will help with, and by elimination which ones it will not.
What is the environmental Kuznets curve?
The proposition that environmental damage rises with income per head to a turning point and then falls, tracing an inverted U. It is named after Simon Kuznets, whose original 1955 curve concerned income inequality rather than pollution.
What mechanisms are supposed to cause the downturn?
Three. The scale effect raises damage as output grows. The composition effect lowers it as an economy shifts from heavy industry to services. The technique effect lowers it further as richer societies afford and politically demand cleaner technology.
For which pollutants does the curve hold?
The pollutants of poverty: local, visible and technically easy to fix. Indoor air pollution, water-borne disease and sulphur dioxide from point sources all decline as income rises, though several decline monotonically rather than after a turning point.
Where does the environmental Kuznets curve fail?
For the pollutants of consumption, which are diffuse and global and generated by affluence itself: carbon emissions, municipal and electronic waste, vehicular emissions, groundwater extraction and land conversion. No Indian turning point is visible in any of them.
Why can the curve not describe biodiversity loss?
Because it plots a flow when the thing at risk is a stock. A species lost does not return when income rises, and a falling rate of loss is not a recovery. The same applies to topsoil and to compacted aquifers.
What is the main criticism of the curve?
That where the downturn occurred it followed regulation, litigation and public pressure rather than income alone, so treating it as an automatic consequence of growth removes the mechanism that actually produced it. It may also reflect the displacement of polluting production abroad rather than a real global reduction.
Practice Questions
Prelims
1. The environmental Kuznets curve plots environmental damage against
- (a) population density
- (b) income per head
- (c) time
- (d) industrial output
Answer: (b)
2. Which effect is held to RAISE environmental damage as an economy grows?
- (a) Composition effect
- (b) Technique effect
- (c) Scale effect
- (d) Substitution effect
Answer: (c)
3. The curve holds best for
- (a) carbon dioxide emissions
- (b) municipal solid waste
- (c) indoor air pollution
- (d) biodiversity loss
Answer: (c)
4. The principal reason the curve cannot describe biodiversity loss is that
- (a) biodiversity is hard to measure
- (b) it plots a flow when the loss is a stock
- (c) biodiversity rises with income
- (d) the data are unavailable
Answer: (b)
5. A common criticism is that the observed downturn in rich countries reflects
- (a) falling population
- (b) the displacement of polluting production abroad
- (c) reduced consumption
- (d) climatic change
Answer: (b)
Mains
- Explain the environmental Kuznets curve and the three effects said to produce its shape. (10 marks)
- Distinguish between pollutants of poverty and pollutants of consumption with Indian examples. (15 marks)
- “A falling rate of loss is not a recovery.” Discuss the limits of the environmental Kuznets curve for irreversible environmental damage. (15 marks)
- Critically examine the proposition that economic growth will solve India’s environmental problems. (20 marks)
- Assess the policy implications of the environmental Kuznets curve for a developing economy. (20 marks)
Tell Google you want more of this.
Add Anantam IAS as a preferred sourceOne tap, and this site shows up more often in your own Top Stories, AI Overviews and AI Mode. Remove it any time.