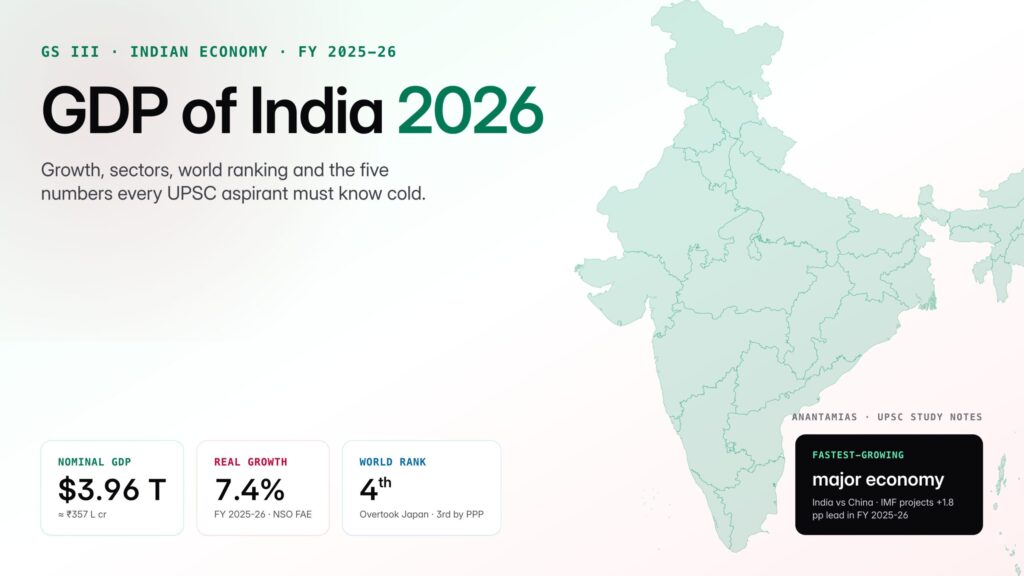
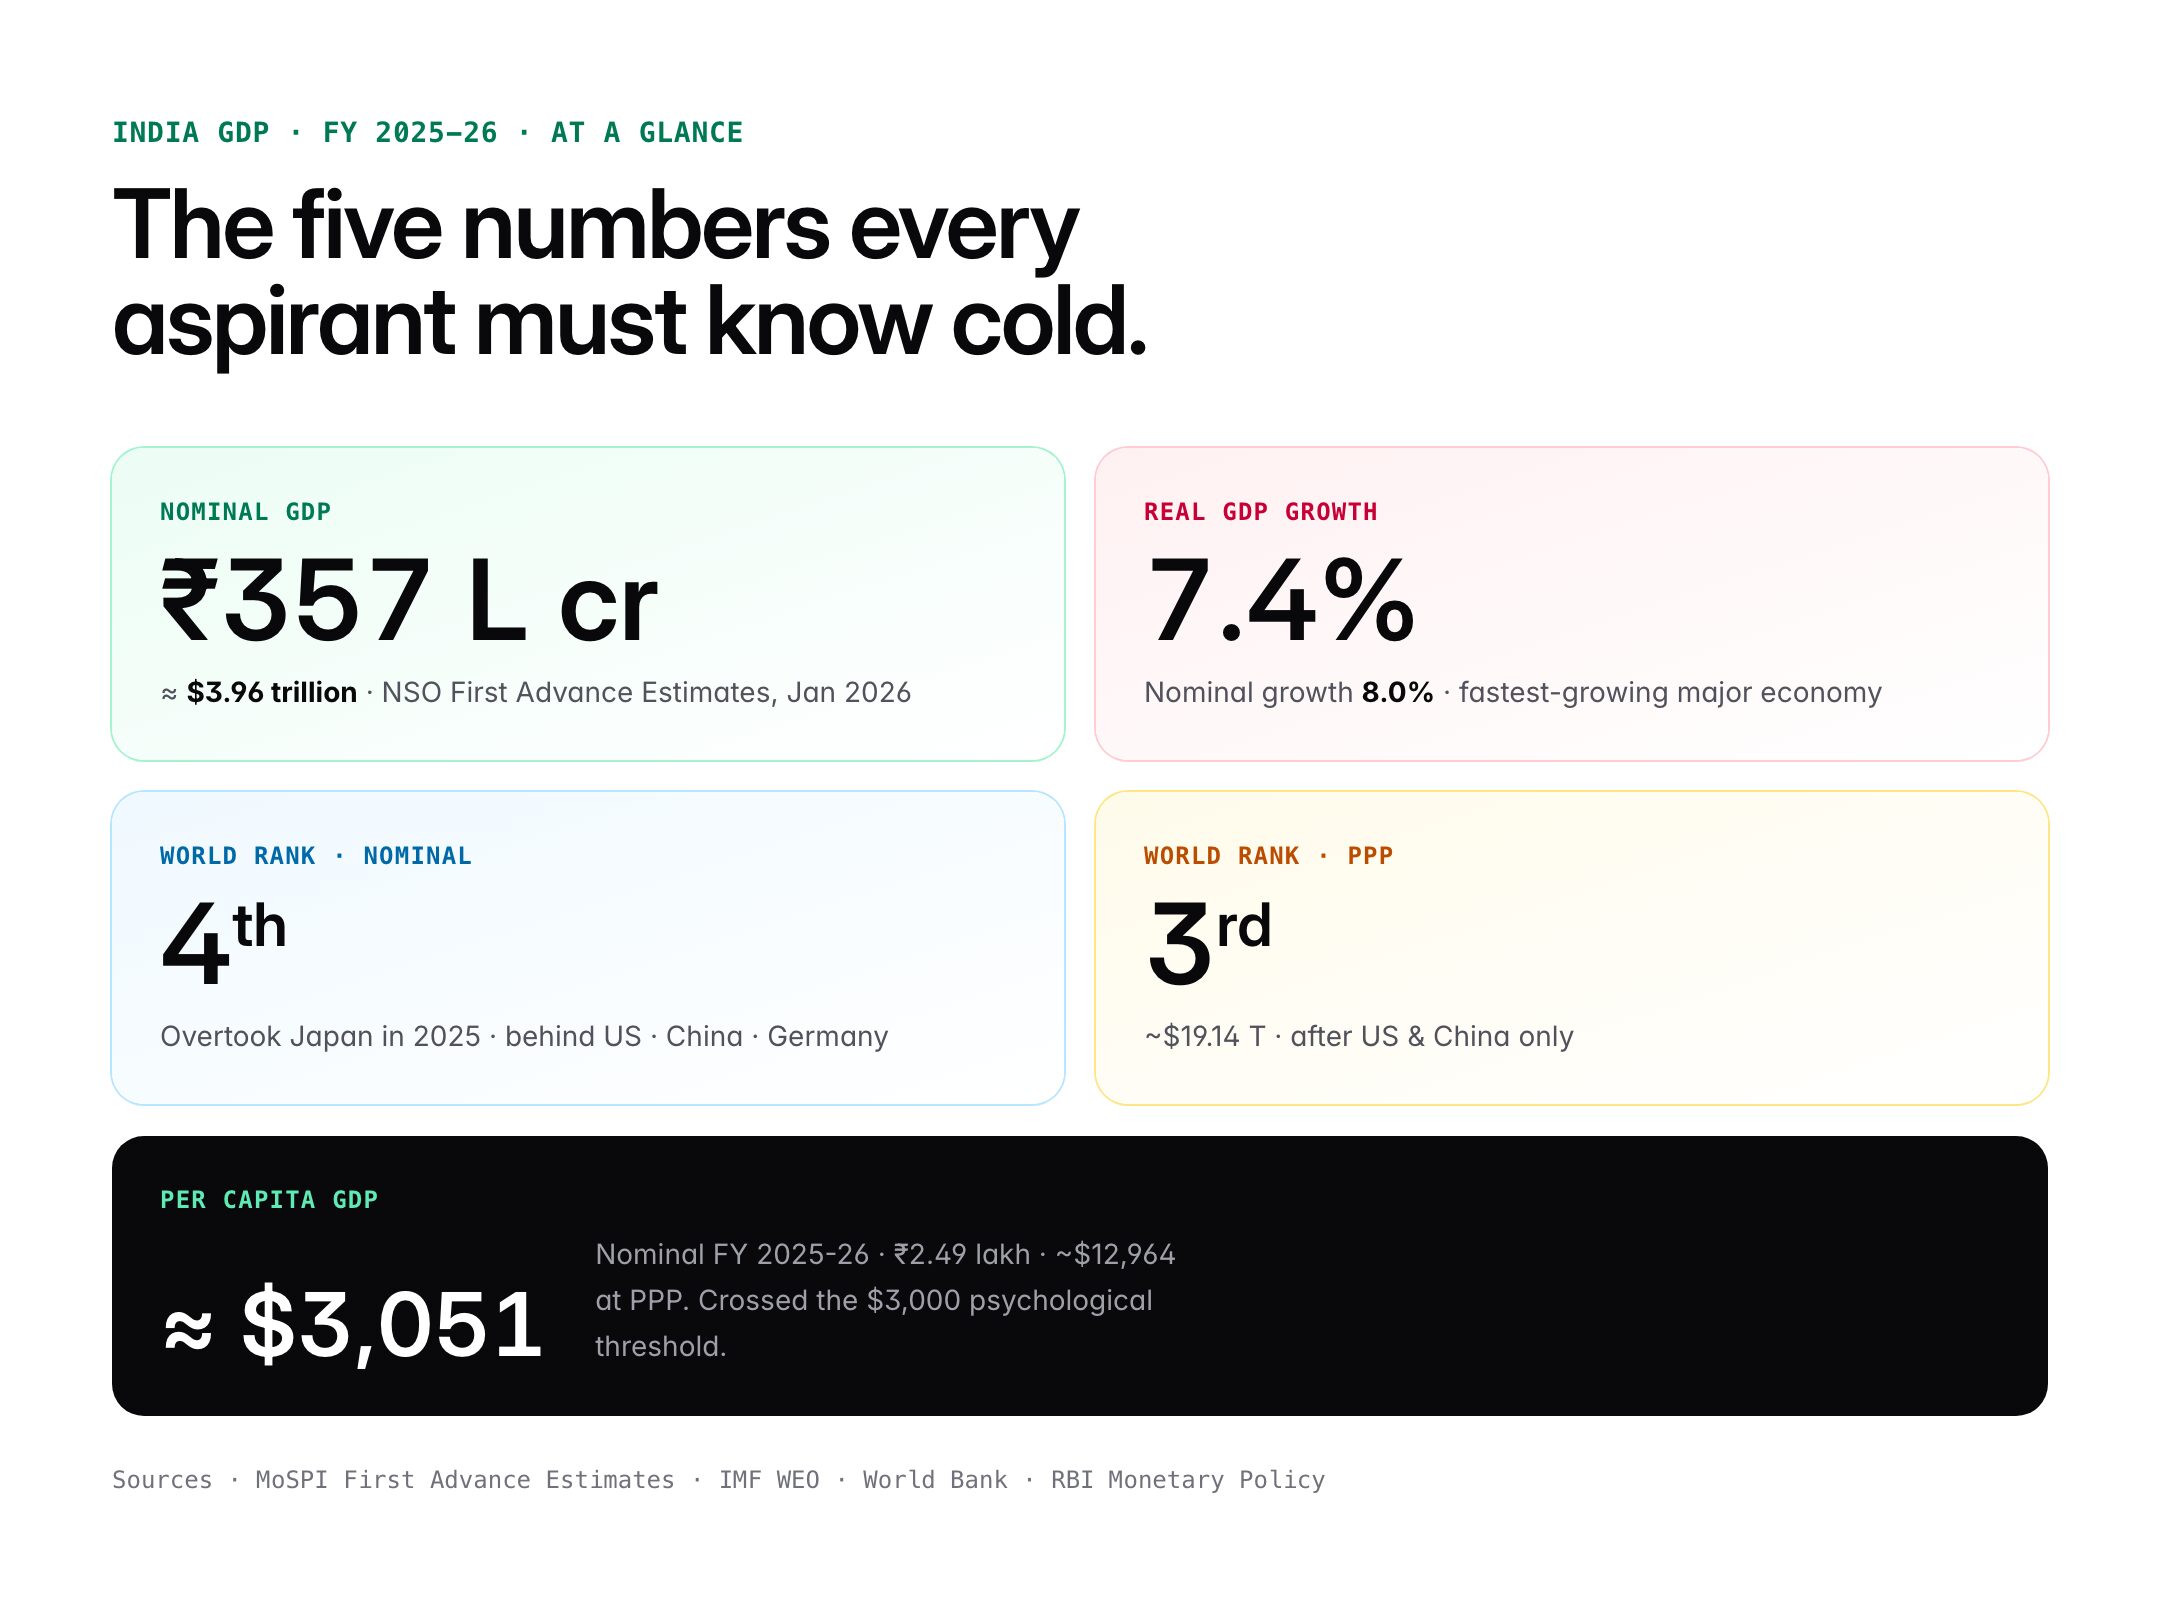
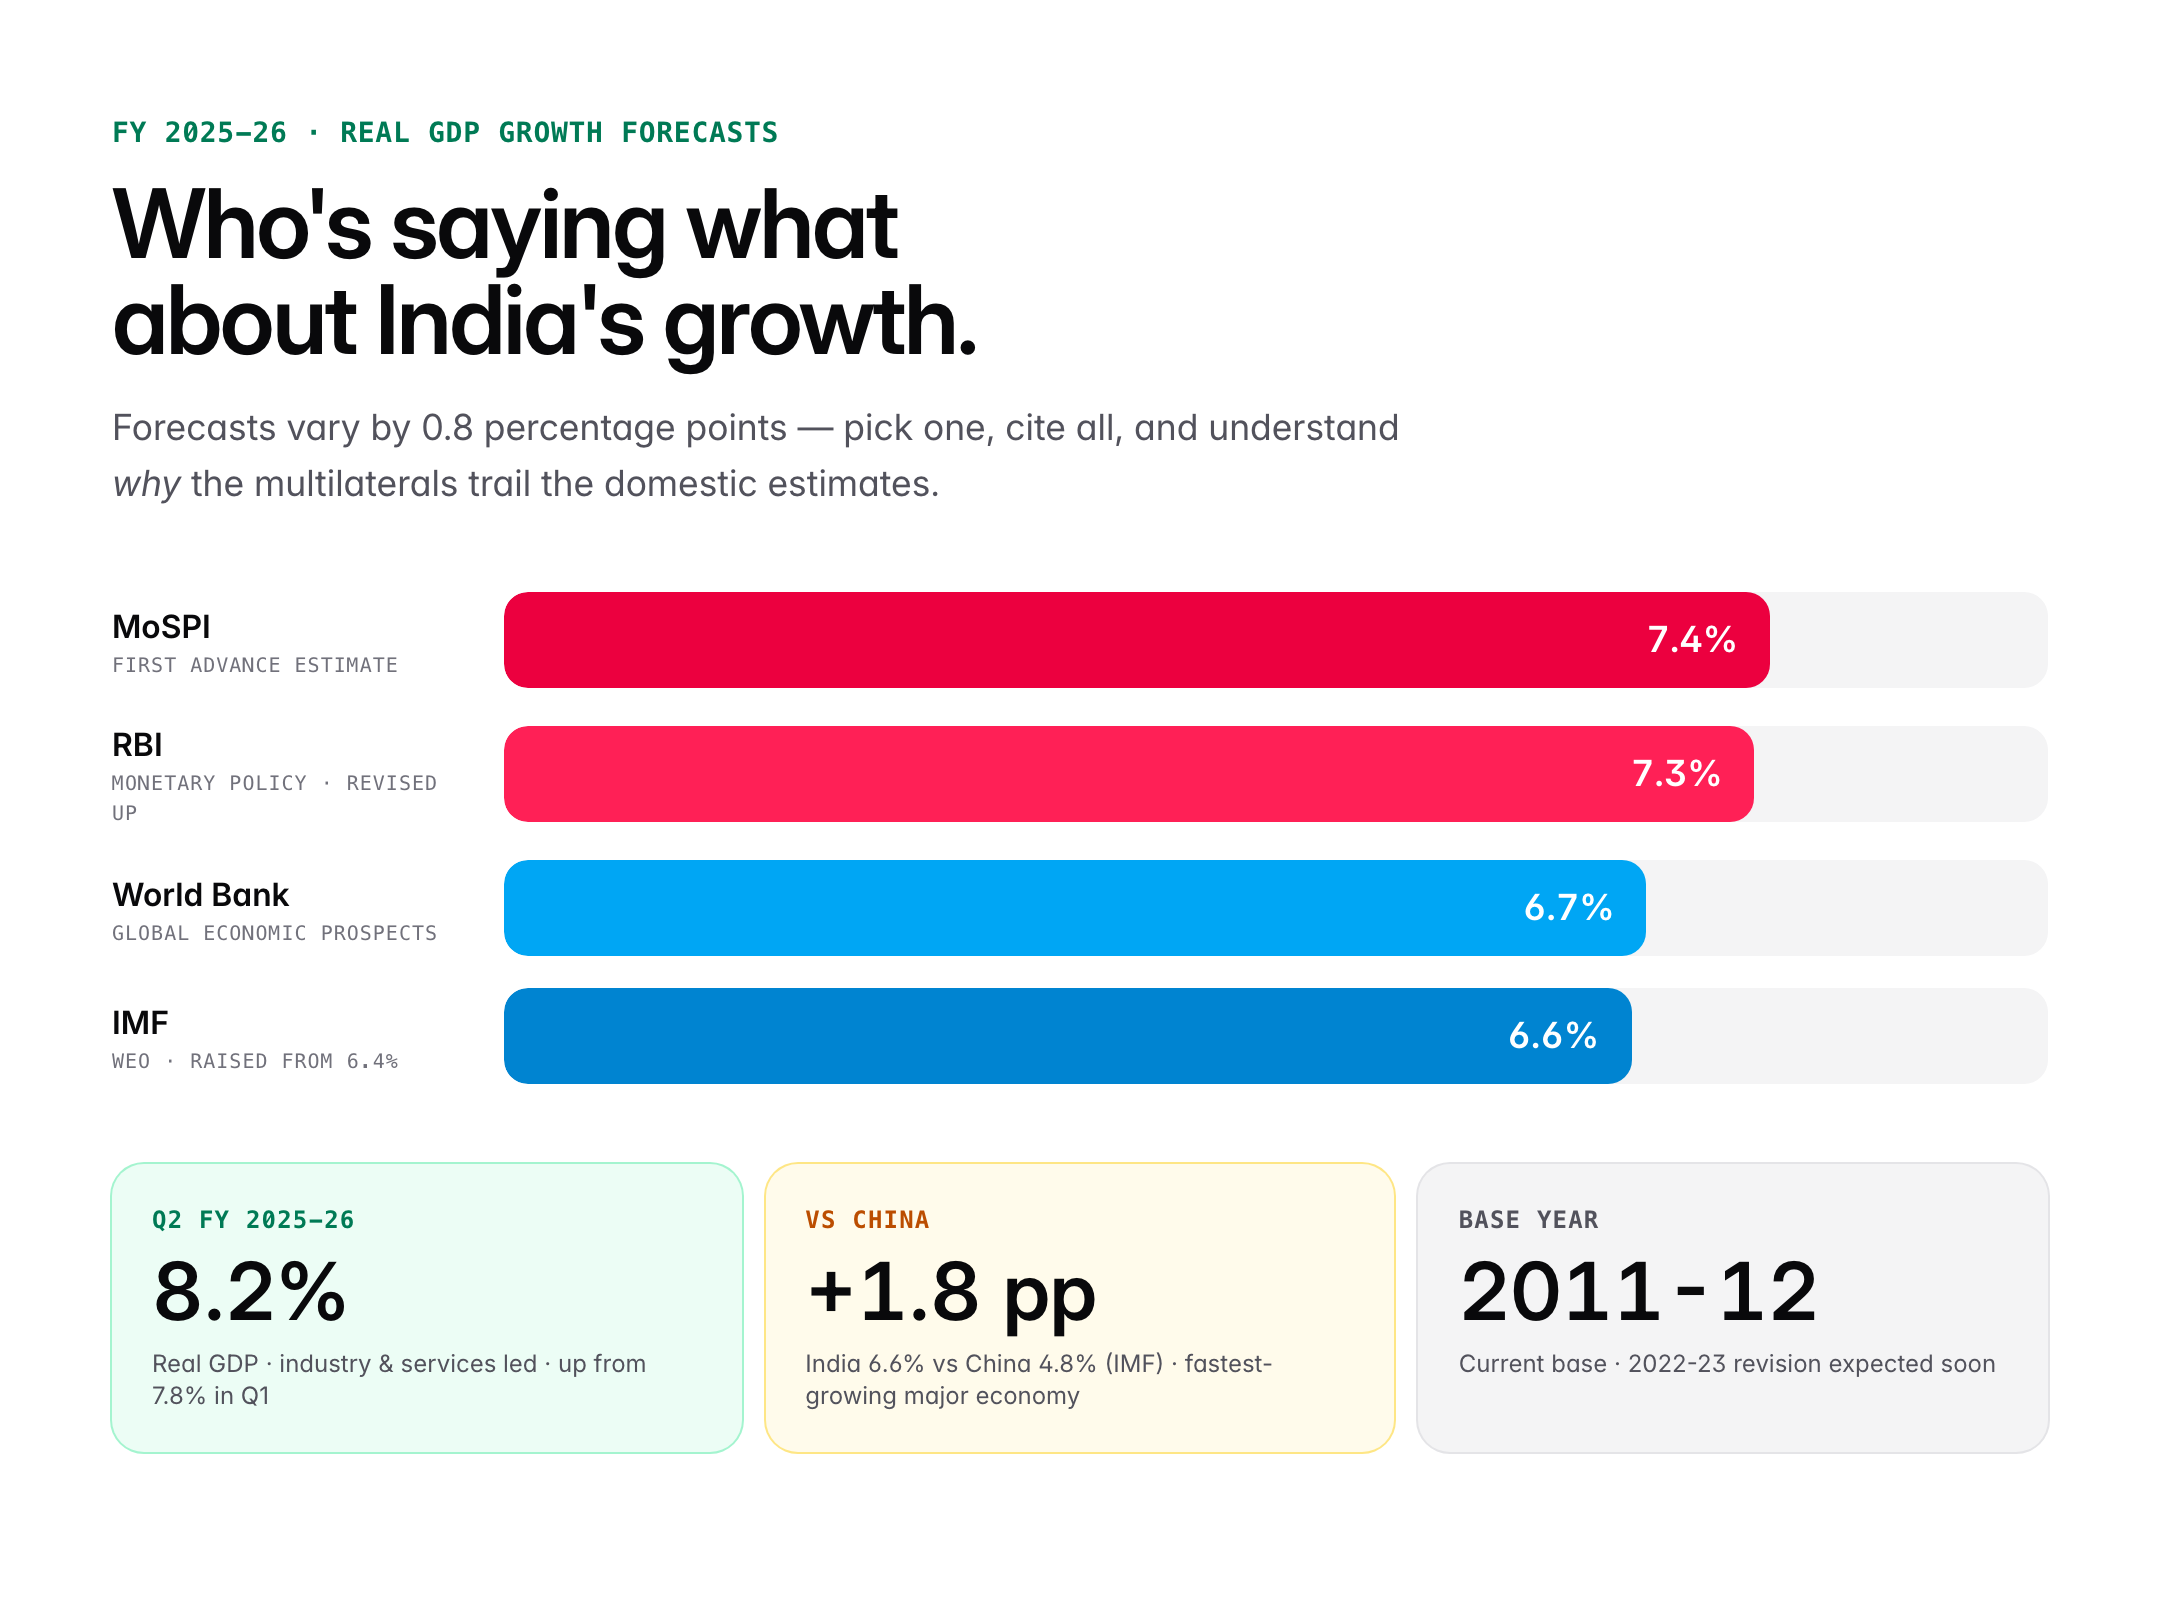
India's GDP for FY 2025-26 is estimated at approximately ₹357 lakh crore in nominal terms (~$3.96 trillion), according to the First Advance Estimates released by the National Statistical Office (NSO) in January 2026. The economy is projected to grow at 7.4% in real terms — retaining India's position as the fastest-growing major economy globally.
Significantly, India overtook Japan in 2025 to become the 4th largest economy by nominal GDP, behind only the US, China, and Germany. By Purchasing Power Parity (PPP), India is already the 3rd largest economy.
For UPSC, India's GDP data appears across GS Paper III (Economy), Prelims fact-based questions, Essay (economic development), and interview rounds. This guide provides the complete 2025-26 picture with the latest official data.
India's GDP at a Glance (FY 2025-26)
Understanding GDP: Basics
What is GDP?
Gross Domestic Product (GDP) is the total monetary value of all final goods and services produced within a country's borders in a given time period (typically a year or quarter).
Key features:
- Measures economic output within geographical boundaries
- Includes production by both domestic and foreign firms within the country
- Excludes production by Indian firms abroad
- Calculated by the National Statistical Office (NSO) under MoSPI
Nominal vs Real GDP
| Measure | Meaning | India FY 2025-26 |
|---|---|---|
| Nominal GDP | At current market prices | ₹357 lakh crore |
| Real GDP | At constant (base year) prices | ₹194 lakh crore |
| Growth | Nominal: 8.0% / Real: 7.4% | — |
Real GDP is the more meaningful indicator — it strips out inflation and shows true economic growth. India's base year for GDP calculation is currently 2011-12, though a new base year (2021-22 or 2022-23) is under consideration.
Nominal vs PPP GDP
| Measure | 2026 Estimate | India's Rank |
|---|---|---|
| Nominal GDP | ~$3.96 trillion | 4th largest (overtook Japan 2025) |
| PPP GDP | ~$19.14 trillion | 3rd largest (after US, China) |
PPP adjusts for cost-of-living differences between countries. India's PPP GDP is higher because goods and services cost less in India than in developed economies. For comparing living standards and economic size across countries, PPP is often more meaningful.
India's GDP Growth Trajectory
Historical Growth Rates
What Drove Growth in FY 2025-26
The First Advance Estimate (Jan 2026) cites:
- Strong manufacturing revival — PMI consistently above 55
- Services sector resilience — IT, financial, real estate
- Agricultural recovery — normal monsoon (2025) boosted kharif output
- Capex push — Centre's capital expenditure rose sharply
- Consumption recovery — rural demand rebound after slowing in FY24-25
- Sound macroeconomic fundamentals — inflation under control, stable rupee
Comparison with Major Economies (2026)
| Country | Real GDP Growth (2026E) |
|---|---|
| 🇮🇳 India | 7.4% |
| 🇨🇳 China | 4.5% |
| 🇺🇸 USA | 2.1% |
| 🇯🇵 Japan | 1.0% |
| 🇩🇪 Germany | 0.7% |
| 🇬🇧 UK | 1.3% |
| 🇧🇷 Brazil | 2.2% |
India remains the fastest-growing major economy — a position it has held every year since FY 2021-22 (post-COVID).
Sector-wise Contribution to GDP
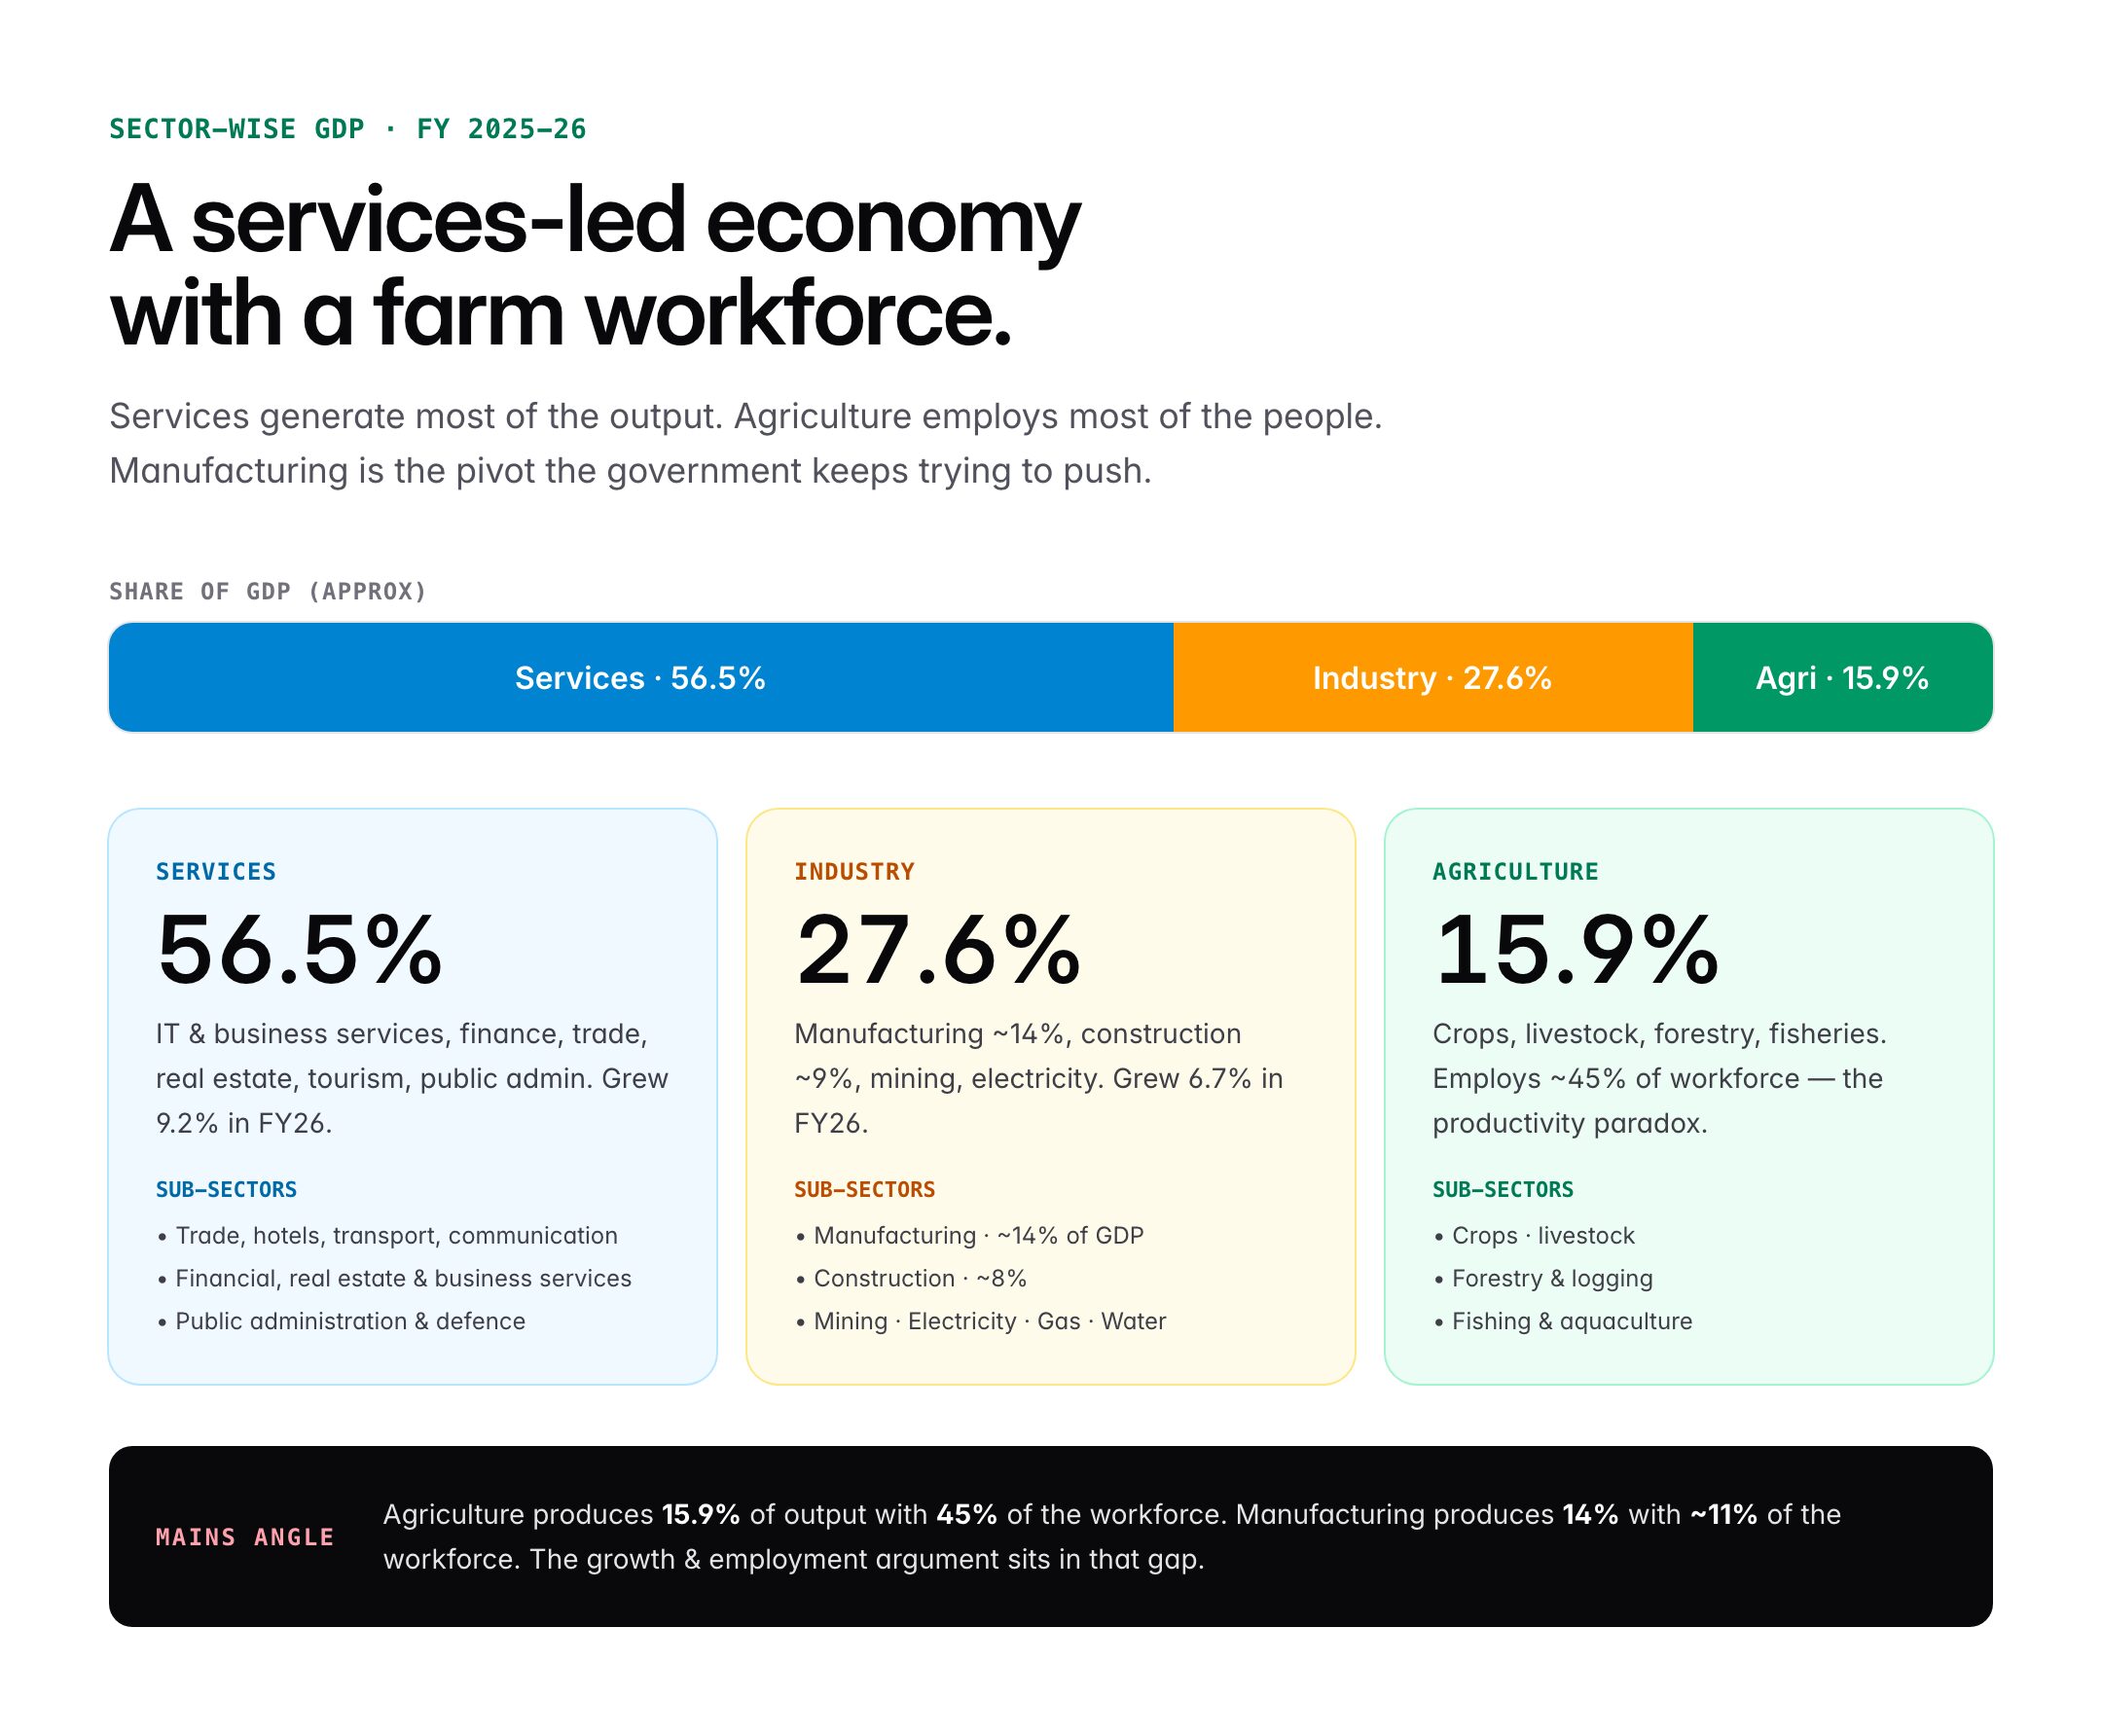
India's economy has three broad sectors. Their contribution to Gross Value Added (GVA) — which is GDP minus net taxes on products — paints a clearer production picture.
FY 2025-26 Sectoral Shares
| Sector | GVA Share | Growth Rate (FY26) |
|---|---|---|
| Agriculture & Allied | ~15.9% | 3.8% |
| Industry | ~27.6% | 6.7% |
| — Manufacturing | ~14.0% | 4.8% |
| — Construction | ~9.1% | 8.5% |
| — Mining | ~2.2% | 2.8% |
| — Electricity, gas | ~2.3% | 6.1% |
| Services | ~56.5% | 9.2% |
| — Trade, hotels, transport | ~18.8% | 8.6% |
| — Finance, real estate | ~23.0% | 9.0% |
| — Public admin, defence | ~14.7% | 10.1% |
Key Observations
Services dominance: India's services sector contributes 56.5% of GVA — among the highest in emerging economies. This reflects India's unique growth model where services (especially IT and financial services) lead growth.
Manufacturing lag: Despite PLI schemes and Make in India, manufacturing share remains stuck at ~14%. The government aims for 25% by 2025 — clearly missed.
Agriculture's declining share: Agriculture's GVA share has dropped from ~30% in 1991 to ~16% in 2026 — but still employs ~45% of the workforce, indicating productivity gaps.
Per Capita GDP and Income
| Metric | FY 2025-26 | FY 2024-25 |
|---|---|---|
| Per Capita GDP (nominal) | ₹2.49 lakh | ₹2.33 lakh |
| Per Capita GDP ($ nominal) | ~$3,051 | ~$2,878 |
| Per Capita GDP ($ PPP) | ~$12,964 | ~$12,100 |
| Per Capita NNI (net national income) | ~₹2.24 lakh | ~₹2.08 lakh |
India crossed the $3,000 per capita mark in FY25-26 — a psychological threshold. However, per capita income remains below the lower middle-income ceiling (~$4,465 per World Bank), and far below the upper middle-income threshold (~$13,845).
Viksit Bharat @ 2047 target: Per capita income of $18,000-$20,000 by 2047, requiring sustained ~7%+ growth.
How GDP is Measured in India
The NSO's Three Approaches
NSO (formerly CSO) uses three methods to estimate GDP — they should theoretically yield identical results:
| Method | What it Measures |
|---|---|
| Production (Output) | Sum of GVA across all sectors + net taxes on products |
| Income | Sum of all incomes — wages, rent, profit, interest |
| Expenditure | Private consumption + Government spending + Investment + Net exports |
India primarily uses the production approach. Expenditure-side GDP is increasingly published too.
Quarterly and Advance Estimates
NSO releases multiple estimates:
| Release | Timing |
|---|---|
| First Advance Estimate | 7 January (for current FY) |
| Second Advance Estimate | 28 February |
| Provisional Estimate | 31 May |
| First Revised Estimate | 31 January (next FY) |
| Second Revised Estimate | Later revisions |
| Third Revised Estimate | Final |
Base Year
Currently, GDP is calculated at 2011-12 base year prices for real GDP. This means:
- Real GDP = quantities at 2011-12 prices
- Nominal GDP = quantities at current year prices
- GDP Deflator = Nominal / Real × 100
Base year revision: A new base year (likely 2022-23) is expected soon. This is a routine methodological update to reflect changes in the economy's structure.
GDP Components by Expenditure
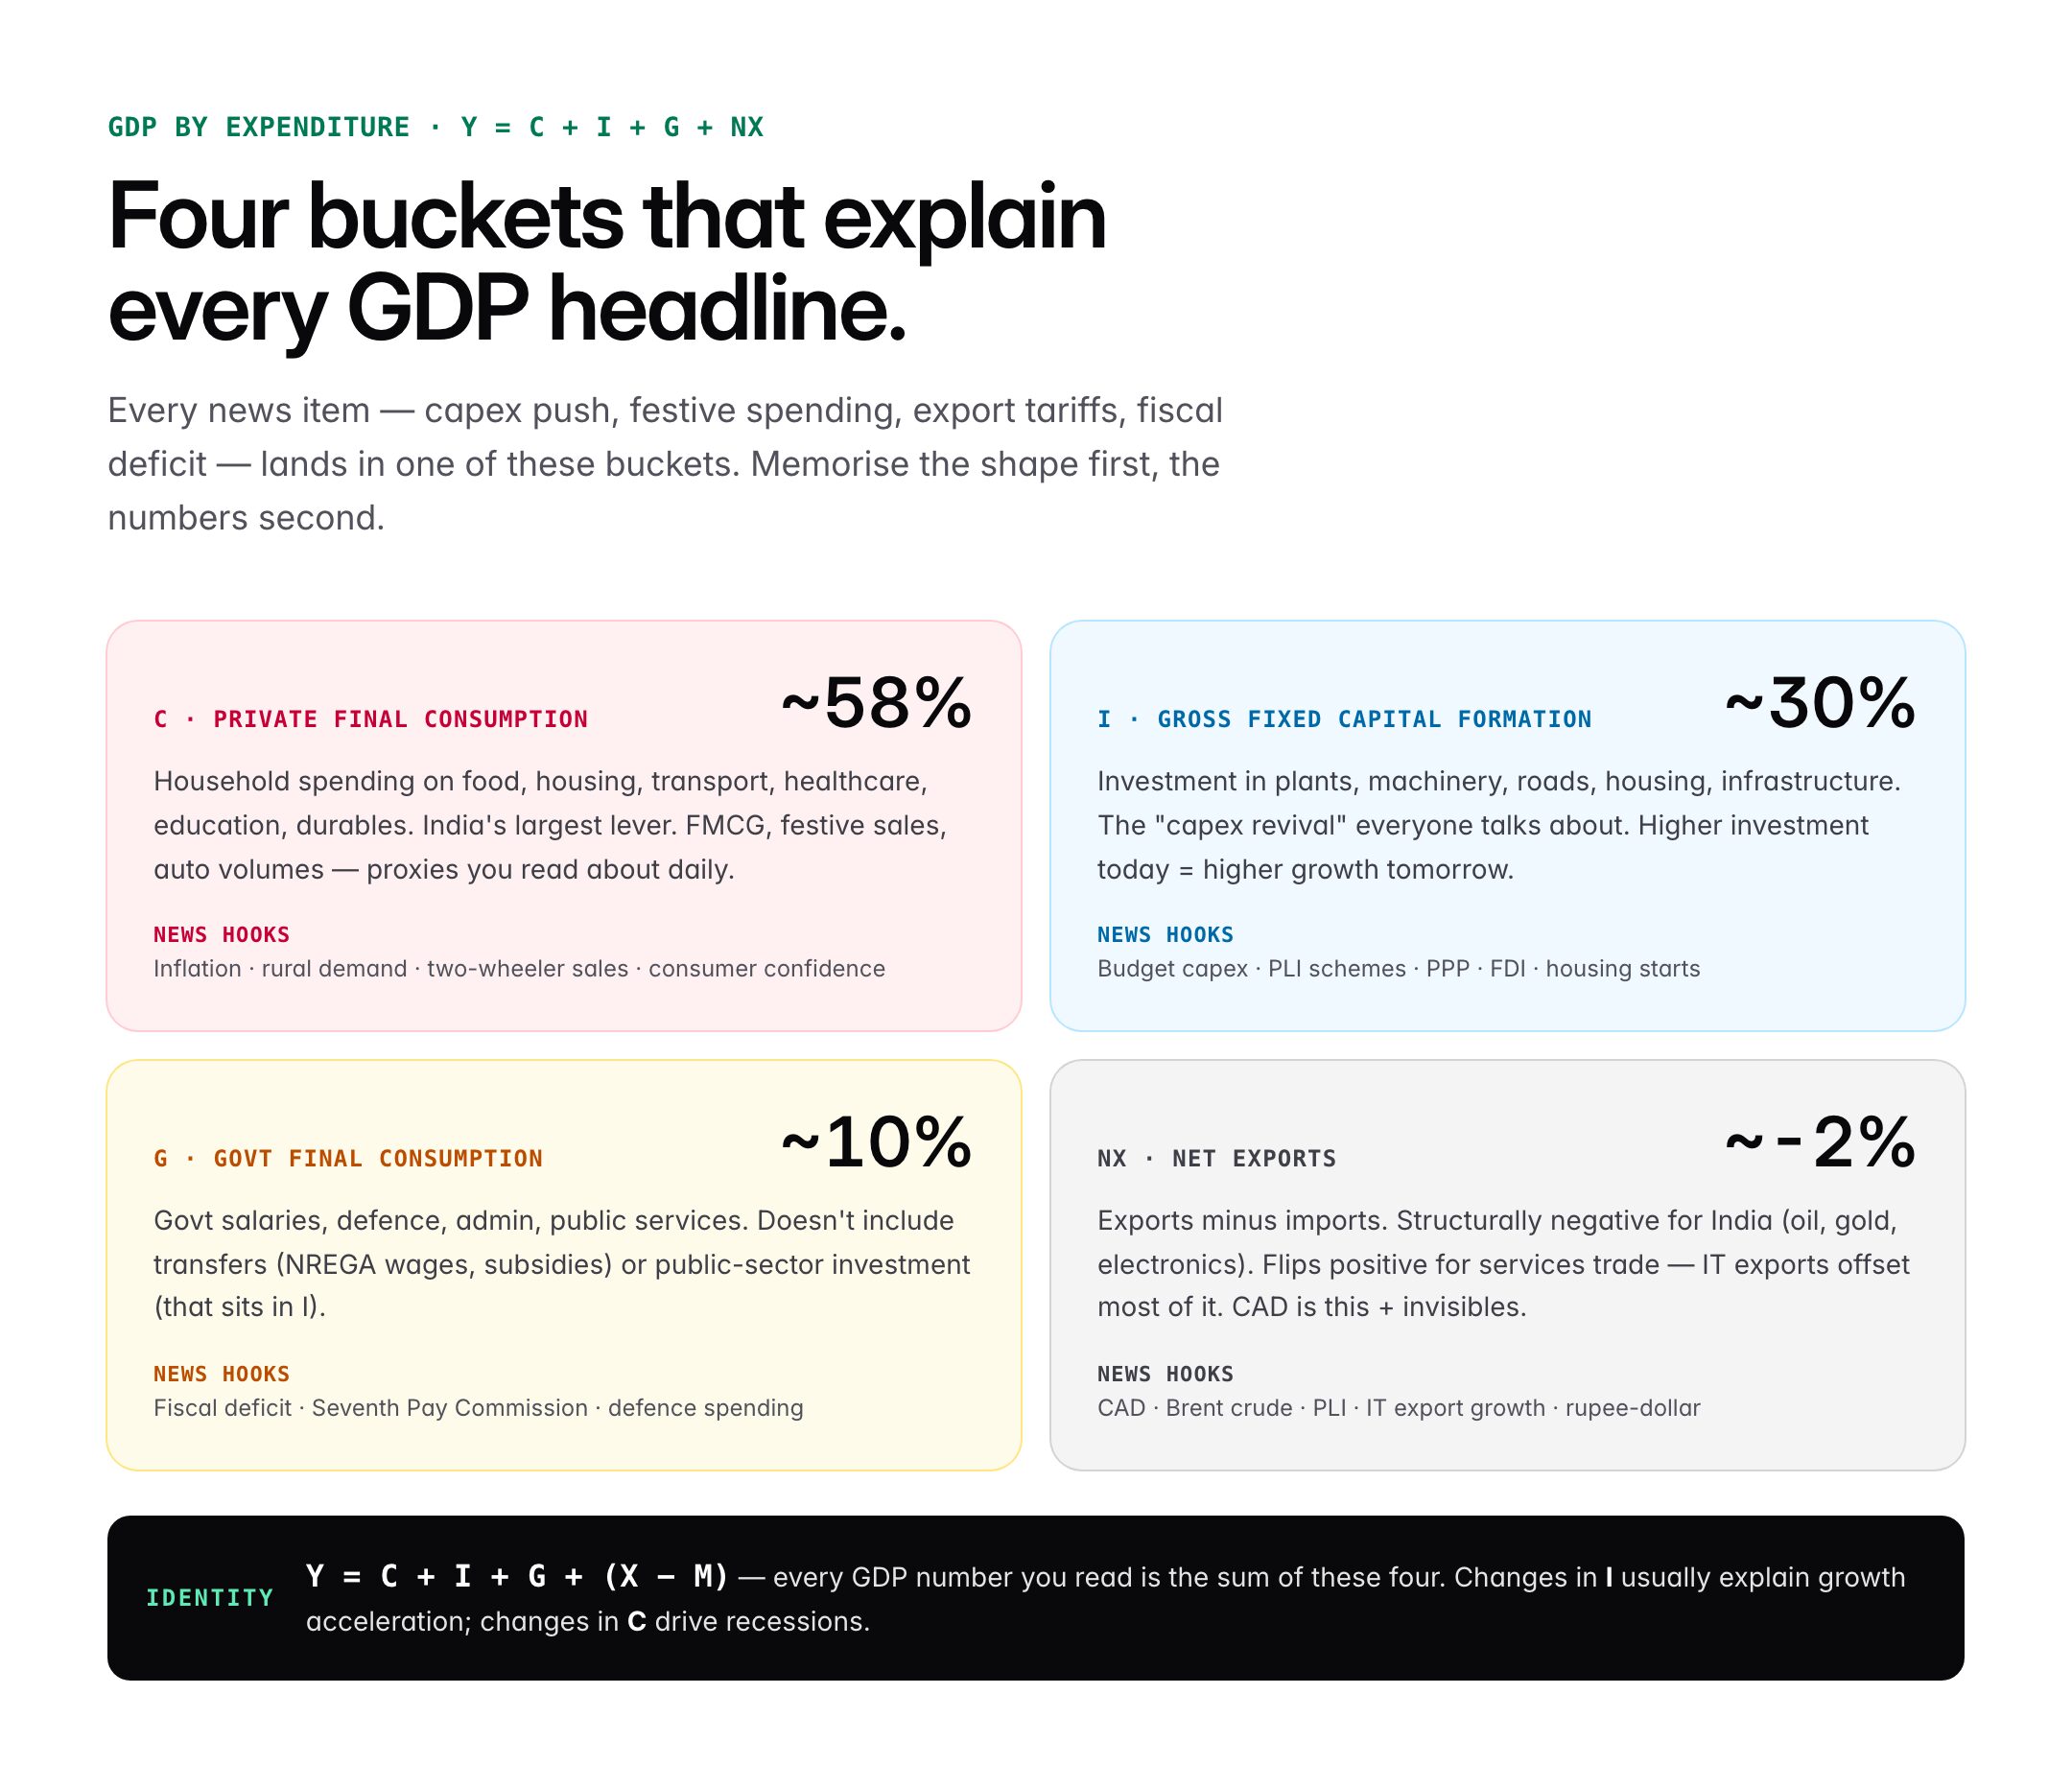
Breaking down FY 2025-26 GDP by expenditure:
| Component | % of GDP | Year-on-year Growth |
|---|---|---|
| Private Final Consumption (PFCE) | ~58% | 7.6% |
| Government Final Consumption (GFCE) | ~10% | 3.3% |
| Gross Fixed Capital Formation (GFCF) — Investment | ~30% | 7.1% |
| Net Exports (Exports – Imports) | ~-2% | — |
| Change in Stocks + Valuables | ~4% | — |
Key insights:
- Consumption remains the largest GDP driver (~58% of GDP)
- Investment (GFCF) has risen to ~30% — highest in a decade
- Net exports are negative (India imports more than it exports)
India's Global Economic Position
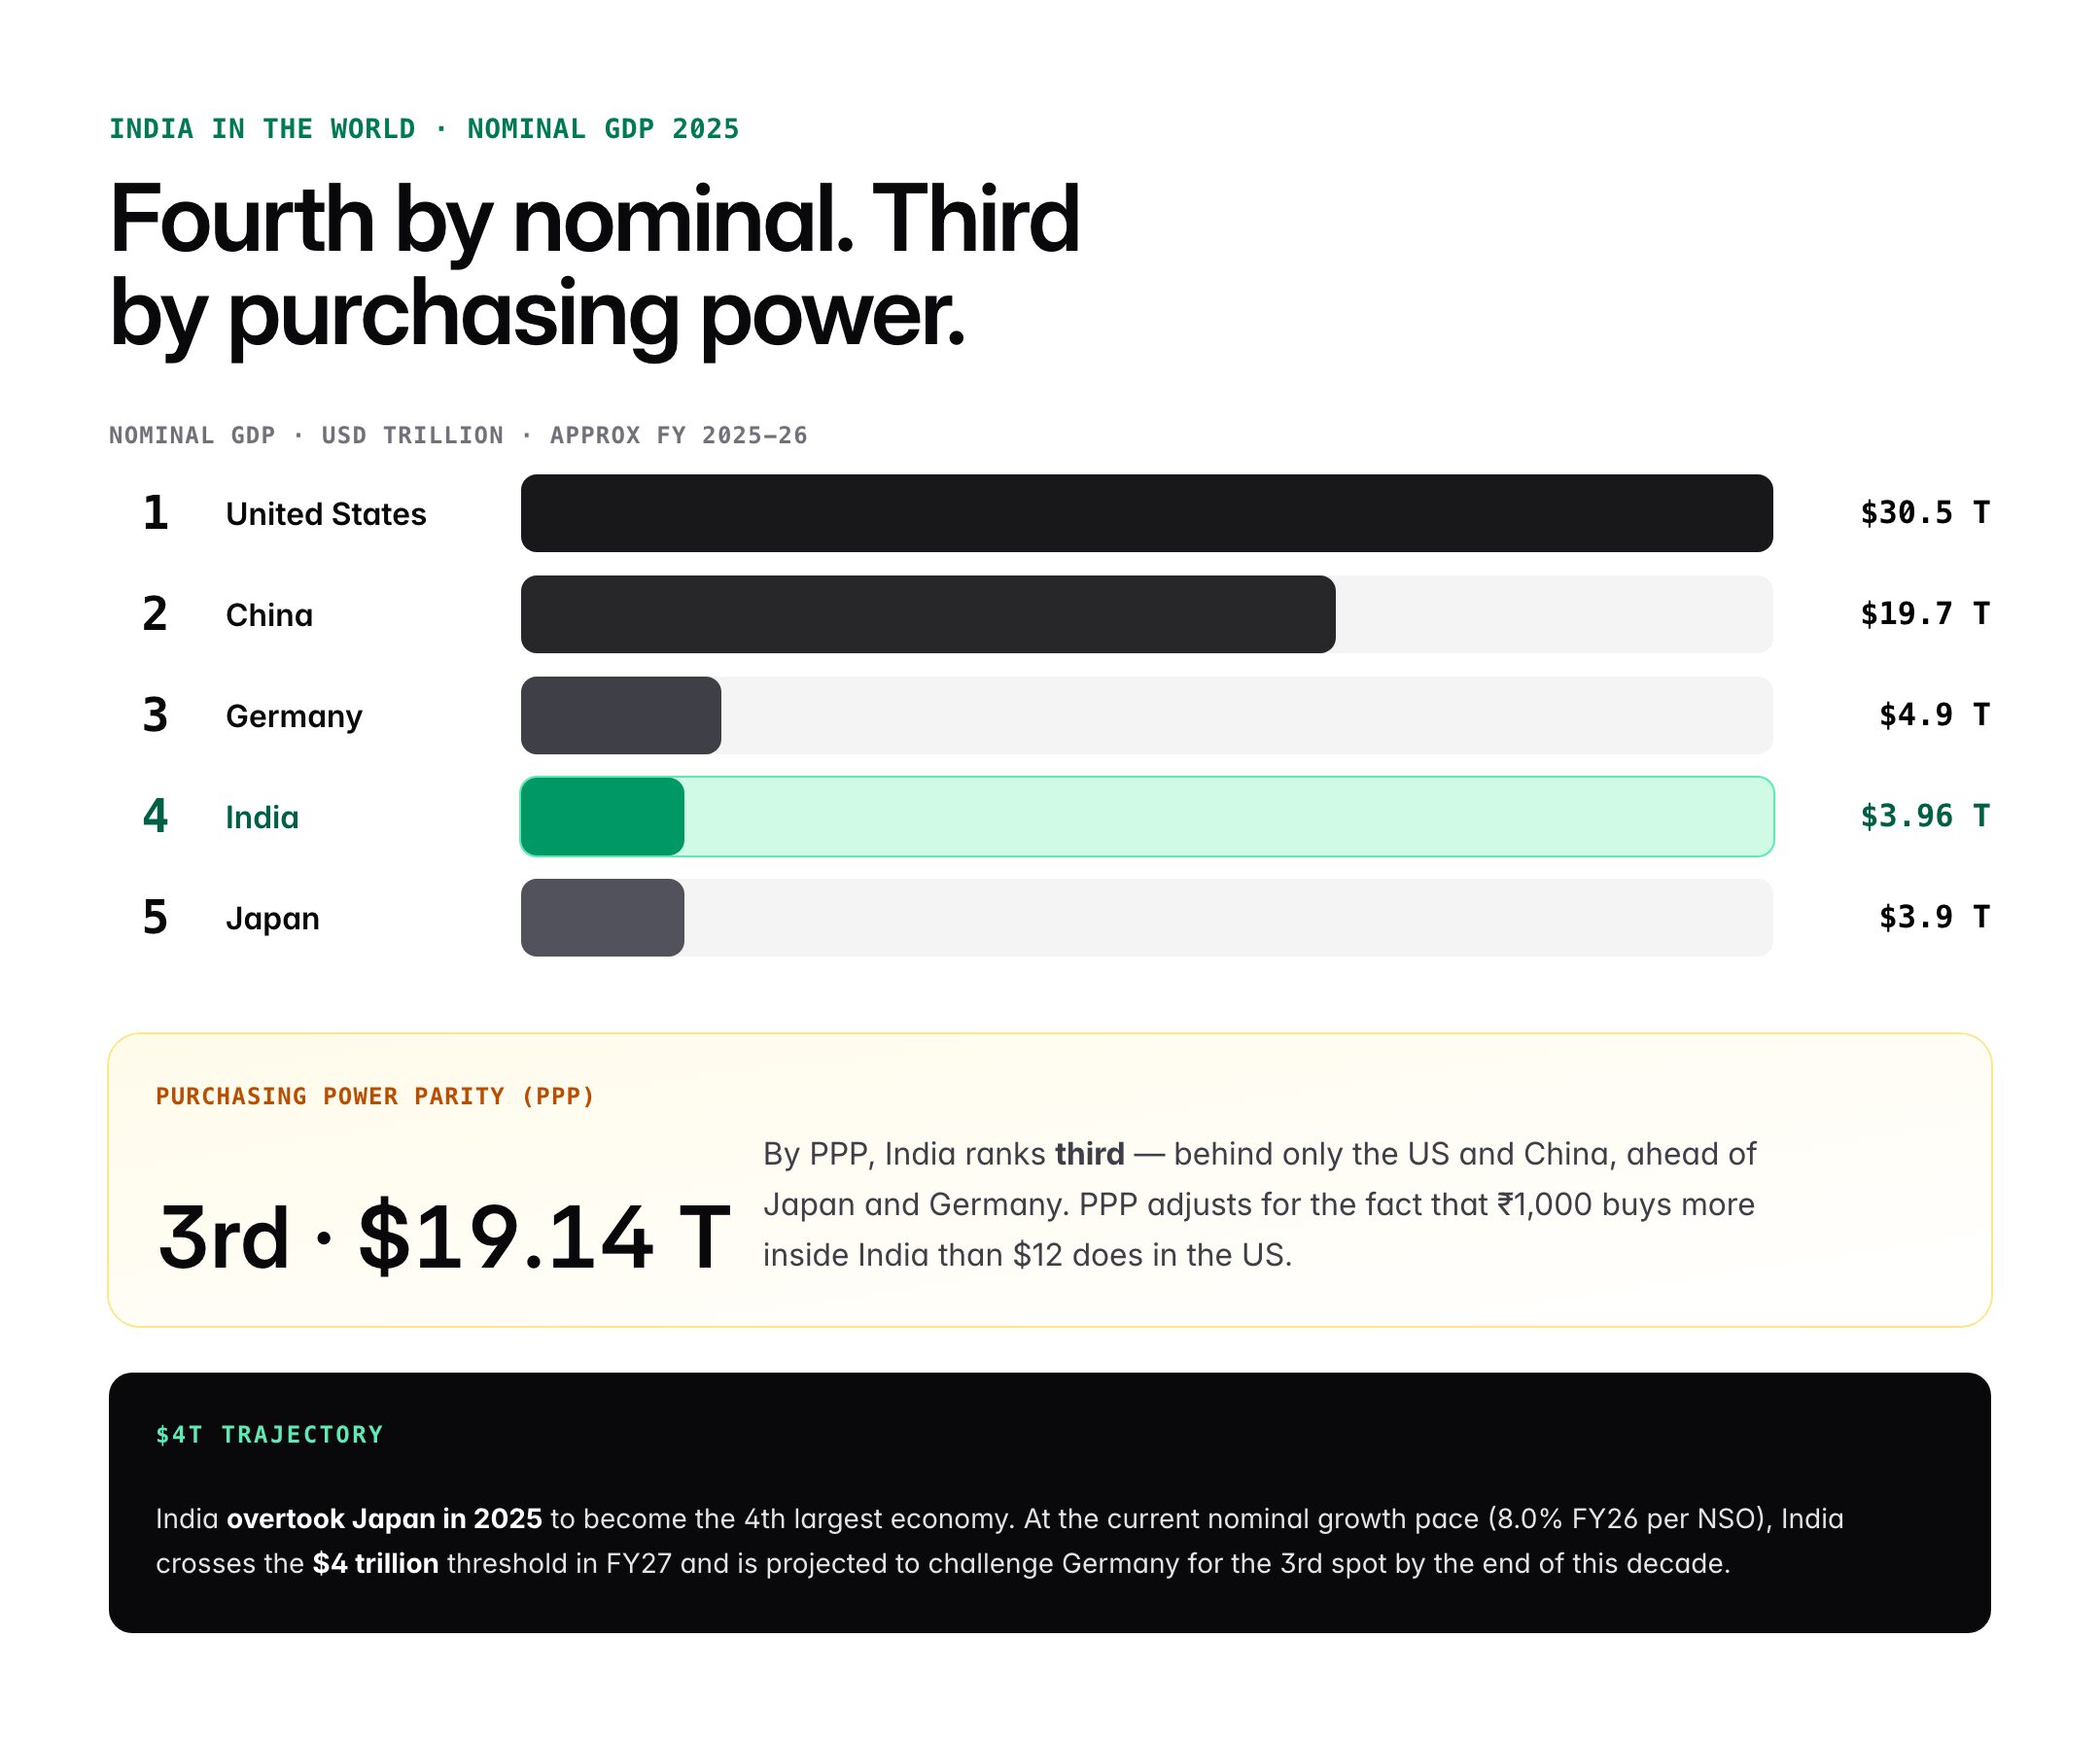
World GDP Rankings (2026E)
| Rank | Country | Nominal GDP ($ trillion) |
|---|---|---|
| 1 | USA | 30.4 |
| 2 | China | 19.5 |
| 3 | Germany | 4.9 |
| 4 | India 🇮🇳 | 3.96 |
| 5 | Japan | 3.8 |
| 6 | UK | 3.6 |
| 7 | France | 3.2 |
Historical Progression
- 2000: India ranked 13th with GDP of $476 billion
- 2014: India moved to 10th position with $2.04 trillion
- 2022: India became 5th largest (overtook UK)
- 2025: India became 4th largest (overtook Japan) 🎯
- 2027 (projected): India expected to overtake Germany → 3rd largest
- 2047 (Viksit Bharat): Target: developed economy status, ~$30 trillion GDP
India vs China: A Generational Gap
| Indicator | China | India |
|---|---|---|
| Nominal GDP | $19.5 T | $3.96 T |
| Per capita GDP | ~$13,800 | ~$3,051 |
| Growth rate (2026E) | 4.5% | 7.4% |
| Manufacturing share | ~28% | ~14% |
India is approximately 15-20 years behind China in per capita terms. But India's growth rate advantage creates a convergence path — though it will take decades to close the gap.
Concerns and Challenges
Despite strong headline numbers, several concerns persist:
Structural Issues
- Jobless growth: GDP rising faster than employment creation
- Manufacturing stagnation: Share stuck at ~14% despite PLI
- Informal sector dominance: ~90% of workforce in informal sector
- K-shaped recovery: Top-end growing faster than bottom-end
- Rural distress: Agriculture incomes lagging
External Risks
- Global slowdown: US/China/EU weakness affects Indian exports
- Oil prices: Higher oil = higher import bill and inflation
- Geopolitical tensions: Russia-Ukraine, Middle East
- US tariff policies: Trump administration's 2025 tariff measures
- Climate risks: Erratic monsoons, extreme weather
Measurement Debates
- Base year outdated: 2011-12 doesn't reflect post-COVID economy
- Informal sector estimation: GDP estimates may not fully capture informal activity
- Data gaps: Delays in Economic Census and ASI data
- Back-series controversy: Pre-2011 GDP estimates have been revised downward, triggering debate
Key Government Initiatives Impacting GDP
| Scheme | GDP Impact |
|---|---|
| Production-Linked Incentive (PLI) Scheme | Boosts manufacturing GVA across 14 sectors |
| Capex Push | Central capex ~₹11 lakh crore in FY 2025-26 |
| PM Gati Shakti | Infrastructure multi-modal integration |
| National Infrastructure Pipeline (NIP) | ₹111 lakh crore infrastructure investment |
| Digital India / UPI | Fintech boost + formalisation gains |
| Make in India | Manufacturing ecosystem |
| Viksit Bharat 2047 | Long-term growth vision |
Key Prelims and Mains Facts
Prelims-Level Facts
- FY 2025-26 Real GDP Growth: 7.4% (First Advance Estimate)
- FY 2025-26 Nominal GDP Growth: 8.0%
- Nominal GDP size: ~₹357 lakh crore (~$3.96 trillion)
- India's world rank (Nominal): 4th (overtook Japan in 2025)
- India's world rank (PPP): 3rd
- Per capita GDP (nominal): ~$3,051
- Per capita GDP (PPP): ~$12,964
- Base Year for GDP: 2011-12 (revision expected)
- Agency calculating GDP: National Statistical Office (NSO), under MoSPI
- Sectoral shares (GVA): Agriculture ~16%, Industry ~28%, Services ~56%
- GDP Deflator = Nominal GDP / Real GDP × 100
- 3 Methods of GDP: Production, Income, Expenditure
Mains-Level Points
- Why India is the fastest-growing major economy despite global slowdown
- Services-led growth vs manufacturing-led growth debate
- Challenges of jobless growth and inequality
- PLI scheme‘s impact on manufacturing share
- India's path to Viksit Bharat @ 2047
Frequently Asked UPSC Questions
Q: What is the difference between GDP and GNP? GDP is produced within country borders. GNP (Gross National Product) is produced by a country's residents, wherever located. GNP = GDP + (Income from abroad) − (Income paid abroad).
Q: What is GVA? Gross Value Added is the value of output minus intermediate consumption. GDP = GVA + Taxes on products − Subsidies on products.
Q: Why is India's PPP rank higher than nominal? Because of lower prices in India. PPP adjusts for cost of living — the same $1 buys more in India than in the USA, so India's economic size in PPP terms appears larger.
Q: What is NNI? Net National Income = GNP − Depreciation. It reflects income actually available after accounting for wear-and-tear of capital.
Data sources: NSO First Advance Estimates FY 2025-26 (January 2026); IMF WEO October 2025; World Bank; RBI Annual Report 2024-25; Economic Survey 2024-25.
Tell Google you want more of this.
Add Anantam IAS as a preferred sourceOne tap, and this site shows up more often in your own Top Stories, AI Overviews and AI Mode. Remove it any time.