
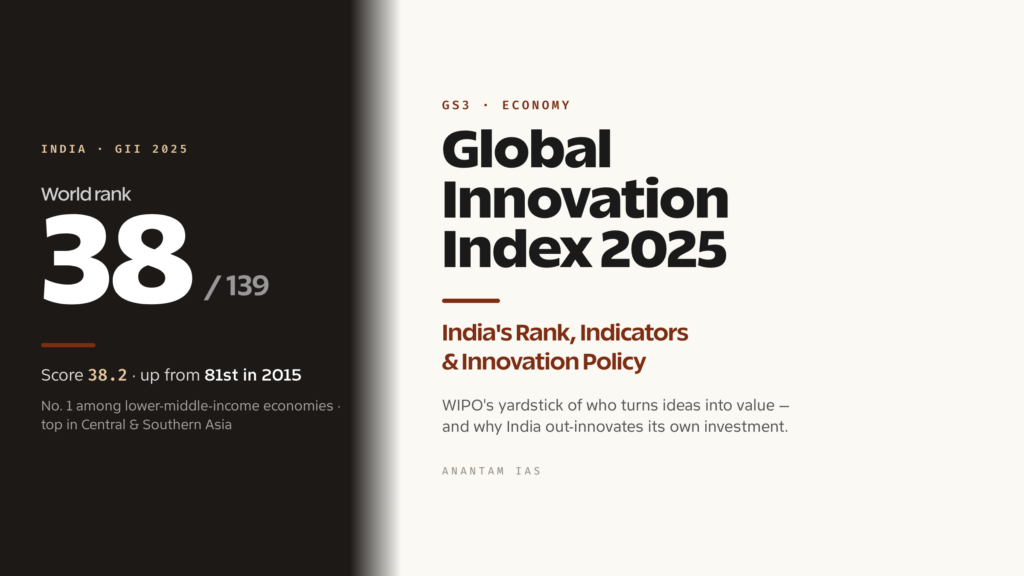
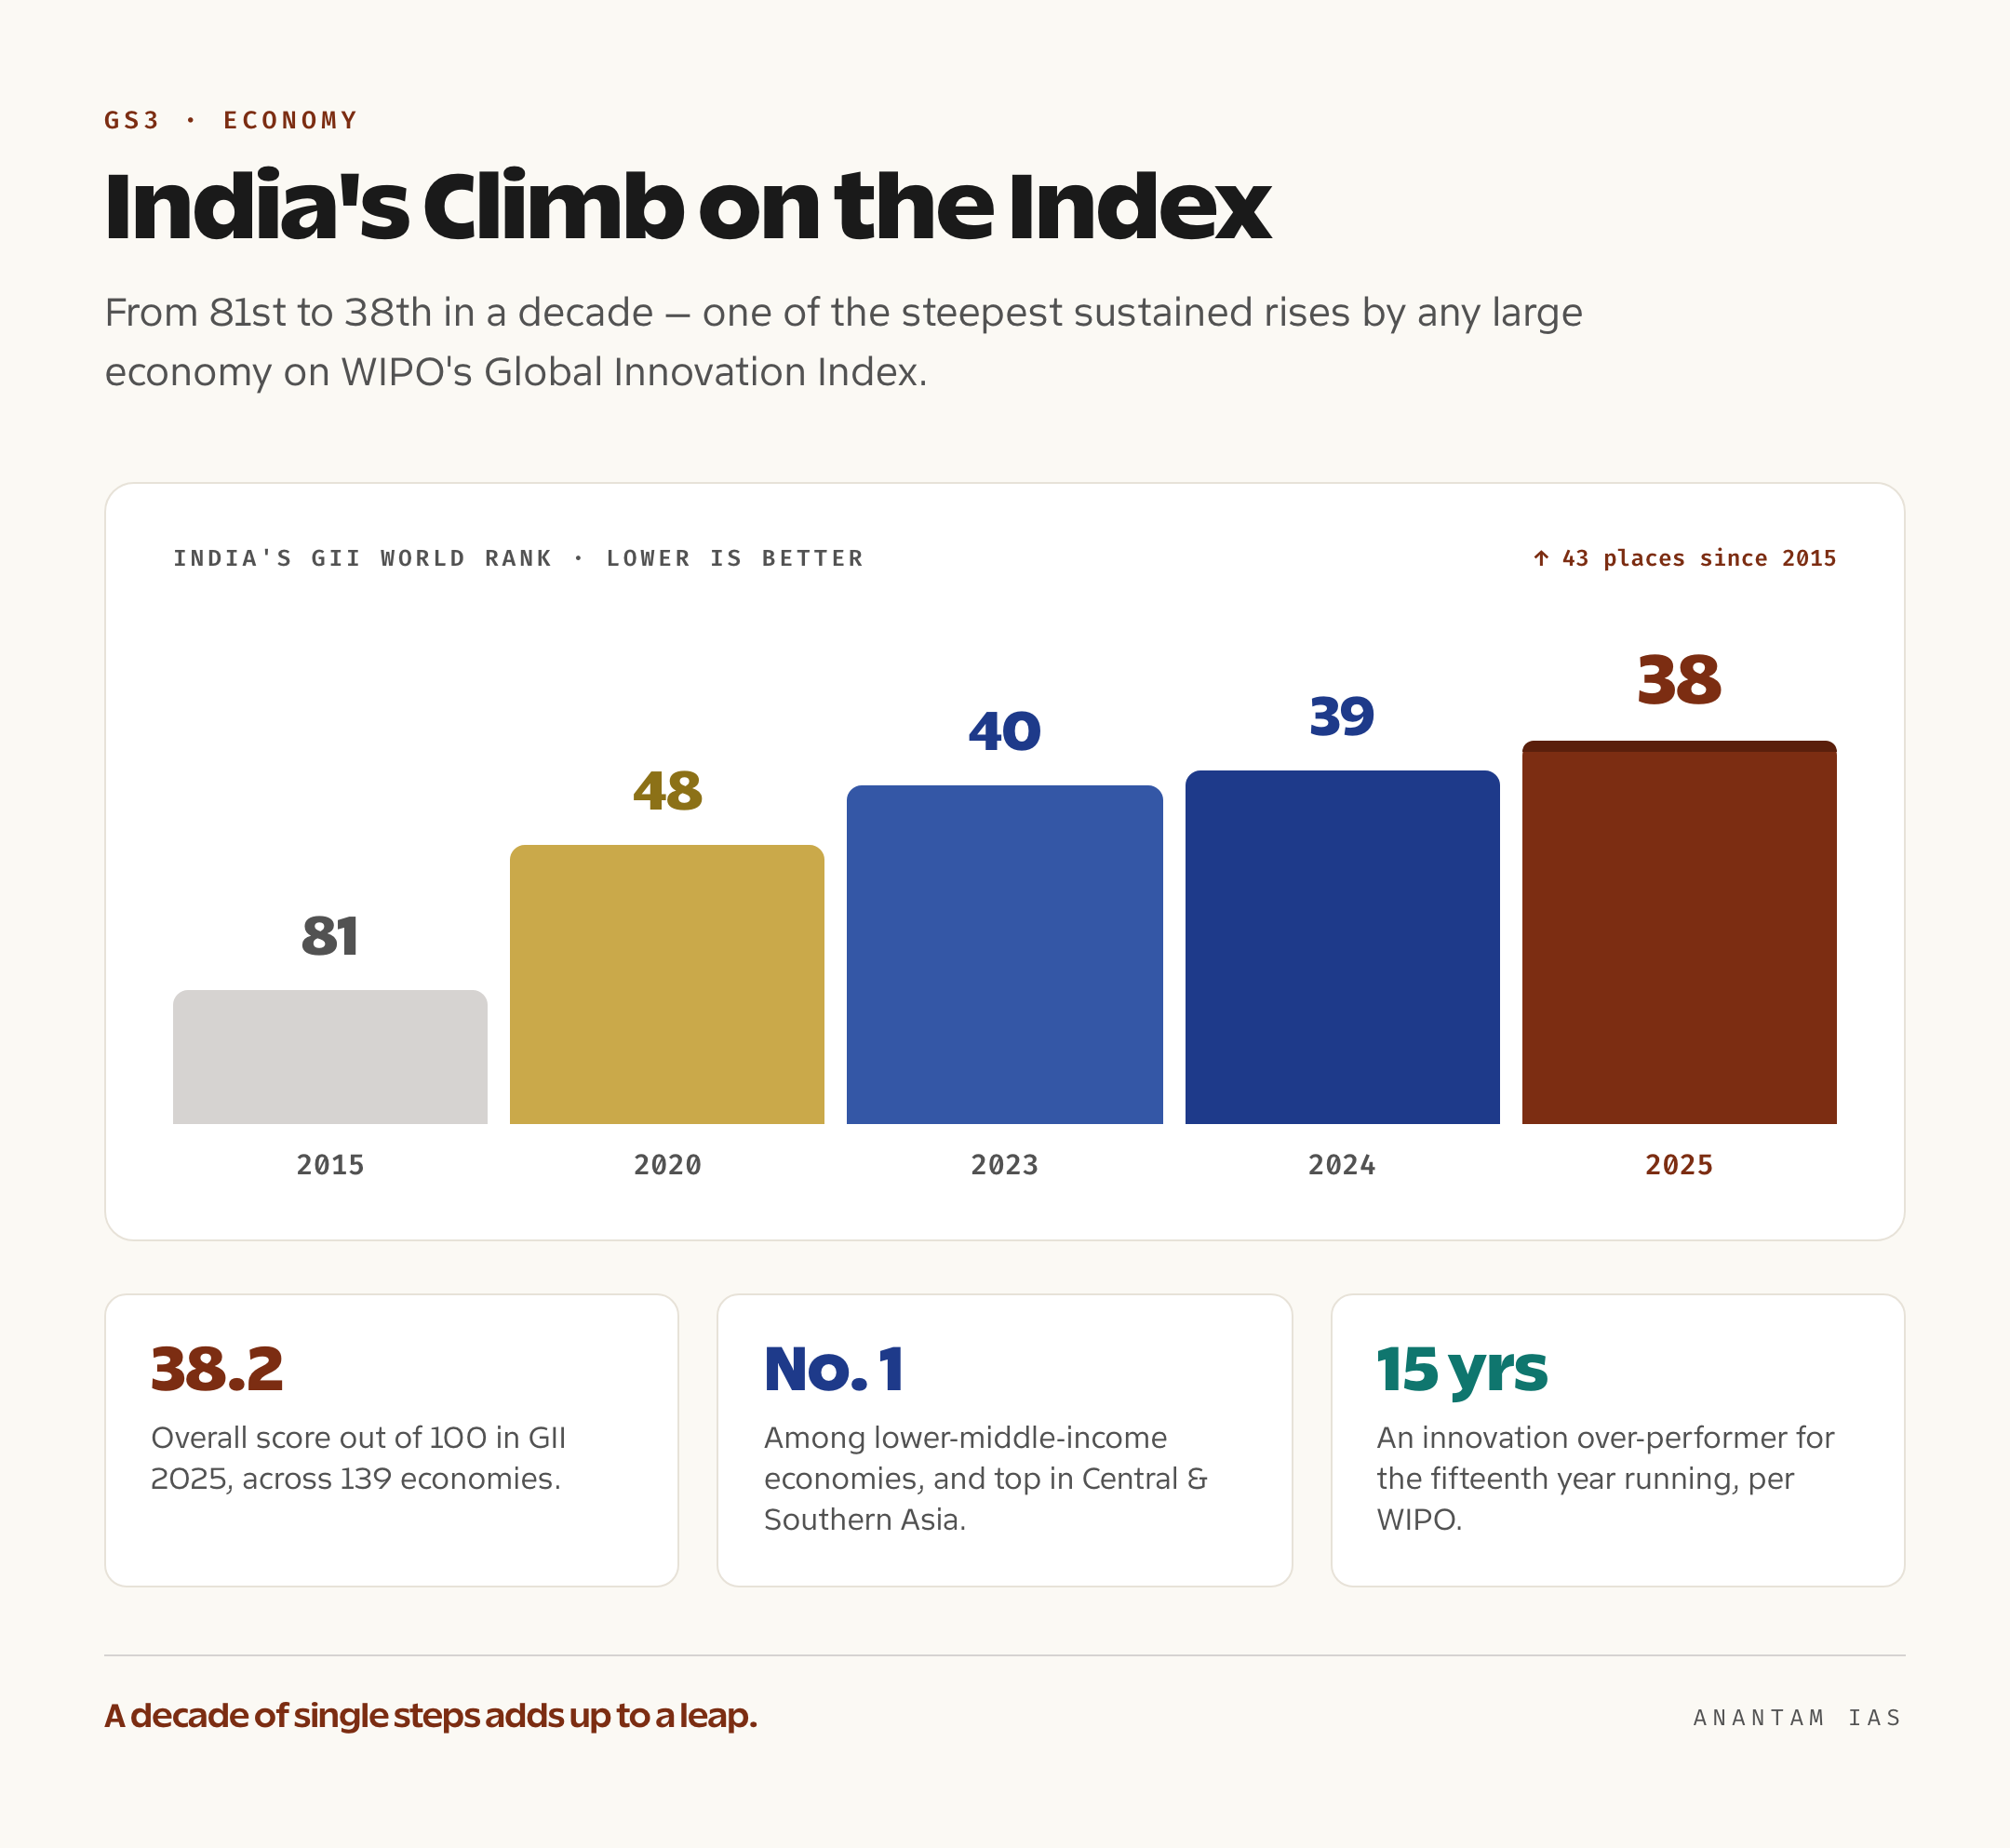
When the World Intellectual Property Organization, the UN agency that the world’s patents and trademarks pass through, released its Global Innovation Index for 2025, India had quietly climbed one more rung to 38th place out of 139 economies, with a score of 38.2. One place a year sounds modest. But stack a decade of those single steps on top of each other and the line is dramatic: India ranked 81st in 2015, sat at 40th in 2023 and 39th in 2024, and now stands at 38th. A country that was outside the top eighty a decade ago is knocking on the door of the top thirty-five. That is one of the steepest climbs any large economy has managed on the index in modern times.
And the number matters far beyond bragging rights. The Global Innovation Index has become the most widely cited yardstick for how well a country turns brains, money and institutions into new ideas, products and value — and governments, including India’s, now openly target it in policy documents. For a UPSC aspirant, the GII is a rare gift: a single, current, data-rich peg on which you can hang a whole GS3 answer about the Indian economy, science and technology, research and development, the startup ecosystem and the gap between India’s potential and its spending. It rewards the candidate who can say not just where India ranks, but why it ranks there — where it punches above its weight, and where it keeps tripping over the same few weaknesses.
What the Global Innovation Index Actually Measures
Start with what the index is, because the structure is half the answer. The Global Innovation Index is published every year by the World Intellectual Property Organization, or WIPO, and it ranks roughly 140 economies on how innovative they are. It does this by crunching around 80 separate indicators — things like research and development spending, venture-capital deals, high-tech exports, patent and trademark filings, the quality of universities and the strength of institutions — into one headline score out of 100. The higher the score, the more an economy is judged to be converting inputs into innovative output.
Those 80-odd indicators are grouped into seven pillars, and the seven pillars are themselves split into two halves — and this split is the single most useful thing to memorise. The first half is the Innovation Input Sub-Index, which captures everything a country pours in to enable innovation. It has five pillars: Institutions (the rule of law, regulation and political stability), Human Capital and Research (education, university quality and R&D spending), Infrastructure (ICT networks, energy, logistics), Market Sophistication (credit, investment and the ease of doing business) and Business Sophistication (how firms collaborate, absorb knowledge and link to research). The second half is the Innovation Output Sub-Index — the results — with two pillars: Knowledge and Technology Outputs (patents, scientific papers, software, high-tech production) and Creative Outputs (trademarks, design, cultural and digital creativity). Five pillars of effort, two pillars of result.
So the real question the GII answers for any country is not just “how innovative are you?” but “are you getting good results out of what you put in?” That input-versus-output framing is exactly where India’s story gets interesting — because India scores far better on the output side than on the input side, which is the polite way of saying India produces a remarkable amount of innovation given how little it spends. At the top of the table, the pattern is the opposite kind of consistency: Switzerland leads for the fifteenth year running, followed by Sweden, the United States, the Republic of Korea and Singapore, with the United Kingdom, Finland, the Netherlands and Denmark filling out the rest, and China breaking into the top ten for the first time at tenth place. These are high-income economies that spend heavily on inputs and harvest the outputs to match.
Where India Leads and Where India Lags
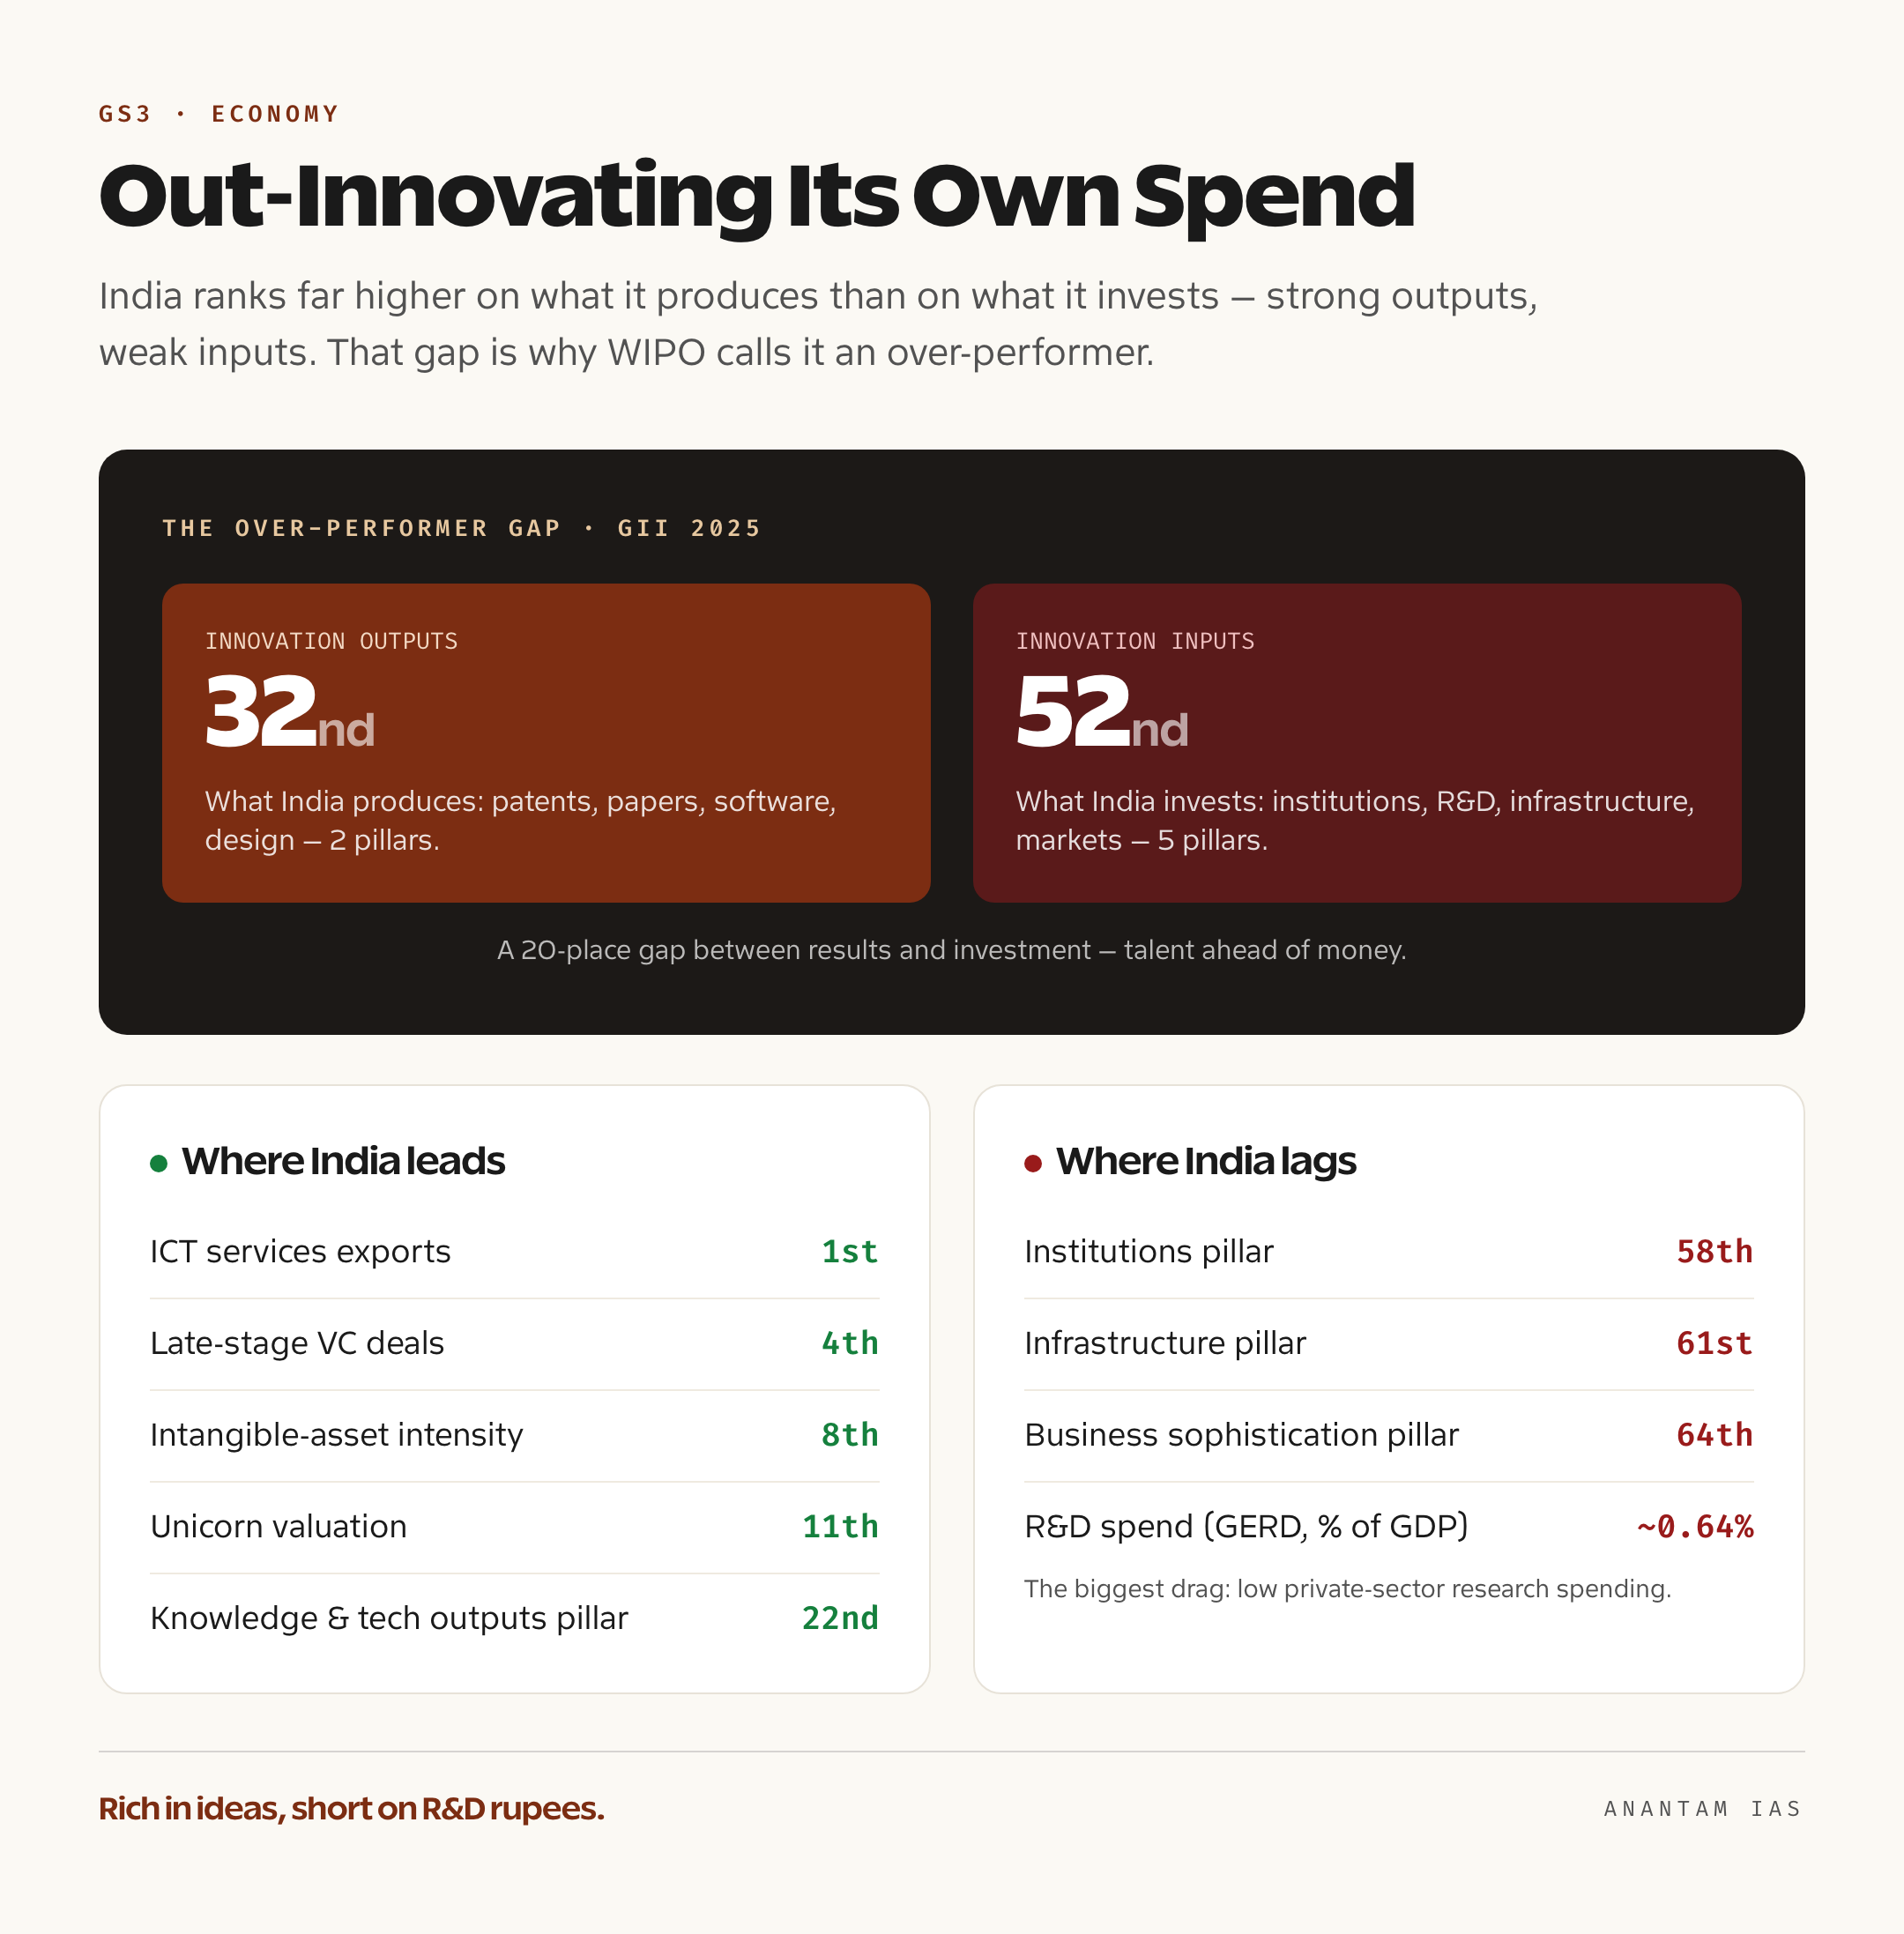
Now the part examiners and editorials actually argue about — the split inside India’s own score. On the Innovation Output Sub-Index, India ranks 32nd in the world; on the Innovation Input Sub-Index, it ranks 52nd. That twenty-place gap is the whole drama of Indian innovation in two numbers. India is over-delivering on results while under-investing in the foundations, and WIPO has now named India an innovation over-performer — a country doing far more than its income level predicts — for the fifteenth year in a row.
Look first at where India shines, because the standout indicators are genuinely world-class. India ranks first on Earth in ICT services exports — the software, IT and back-office work that flows out of Bengaluru, Hyderabad and Pune to the rest of the world. It ranks fourth globally on late-stage venture-capital deals, eighth on intangible-asset intensity (the share of a firm’s value that sits in brands, patents and know-how rather than factories), and eleventh on unicorn valuations, reflecting one of the largest startup ecosystems anywhere, with well over a hundred thousand recognised startups. India is also among the top handful of countries in the sheer volume of scientific papers it publishes and the patents it files. On the Knowledge and Technology Outputs pillar as a whole, India lands around 22nd in the world. So the talent, the entrepreneurship and the raw research output are all there in abundance.
Then look at the other face. On the input pillars, India sits much lower — roughly 58th on Institutions, 61st on Infrastructure and 64th on Business Sophistication. The single most quoted weakness is money: India’s gross expenditure on research and development, the GERD, is stuck at around 0.64 per cent of GDP. Compare that with figures north of 2 per cent in China, well above 3 per cent in South Korea and the United States, and you see the problem at a glance — India is asking its researchers to win a race on a fraction of the fuel. And the shortfall is not mainly the government’s; it is the private sector’s. In most innovation leaders, companies fund the bulk of R&D; in India, the state still carries most of it, and private firms invest far too little in research of their own. That under-spending on inputs is precisely what caps how high India can climb. So the lesson the GII keeps teaching is blunt: India’s people and firms are out-innovating India’s investment, and closing that gap is the next move.
India’s Innovation Clusters and the Geography of Ideas
Innovation is not spread evenly across a country — it clumps. The GII tracks this through its science-and-technology clusters, which measure where in the world patenting and scientific publishing are most densely concentrated, regardless of national borders. And here India’s rise has a clear map. The country has four clusters inside the global top hundred: Bengaluru ranks 21st, Delhi 26th, Mumbai 46th and Chennai 84th. Bengaluru is the engine — India’s deep-tech and software heart, home to global R&D centres, the bulk of the country’s unicorns and a dense web of startups, research institutes and venture capital. Delhi adds scale and a research base anchored by major public institutions, Mumbai brings finance and pharmaceuticals, and Chennai contributes manufacturing, automobiles and a growing electronics and semiconductor push.
What these clusters reveal is that India’s innovation is being carried by a few city-regions doing extraordinary things, rather than by the whole economy lifting together. That is both a strength and a warning. The strength is that these hubs already compete with the best in Asia and are pulling in global capital and talent. The warning is the concentration: when innovation lives in four metros, the gains in jobs, wages and capability bypass most of the country, and a national innovation strategy has to think about spreading these capabilities to tier-two cities and the wider research system. For an answer, the clusters are a gift — they let you turn an abstract index into something concrete and Indian, naming real places the examiner will recognise.
It is worth remembering what these rankings are measuring underneath: density of patents and high-quality research output, the very things that flow from sustained investment in universities, labs and firms. So the cluster map and the R&D-spending weakness are two views of the same truth. Where India has invested over decades — in IT, in pharma, in space and in a handful of elite institutions — world-class clusters have grown. Where it has under-invested, the map stays empty. Geography, in other words, is just policy made visible.
Why the GII Matters for India’s Innovation Policy
This is where the index stops being a scoreboard and becomes a policy compass. The Indian government has explicitly treated climbing the GII as a national goal, and the index’s diagnosis — strong outputs, weak inputs — maps neatly onto what India is now trying to fix. The flagship response is the Anusandhan National Research Foundation, or ANRF, set up under a 2023 Act that came into force in February 2024 to become the apex body funding and steering research across universities, colleges and laboratories. The ANRF is built around a corpus of about 50,000 crore rupees over five years, and the design is deliberately lopsided: only around 14,000 crore is meant to come from the government, with the bulk — close to 36,000 crore — expected to be drawn in from the private sector, philanthropy and industry. The whole point is to pull private money into research, attacking India’s single biggest GII weakness head-on. Layered on top is a separate one-lakh-crore-rupee Research, Development and Innovation fund meant to push patient, long-horizon capital into deep-tech.
Around these sit a thicker web of measures the GII story connects to: the Startup India programme and the Fund of Funds behind the unicorn boom; production-linked incentive schemes nudging high-tech manufacturing and the semiconductor mission; the National Education Policy’s emphasis on research universities; and missions in quantum technology, electronics and green hydrogen. Read together, they are an attempt to convert India’s output strength into a durable input base — to make sure the next decade of innovation rests on Indian R&D spending and Indian institutions, not just on cheap talent and global demand.
But the index is also a reality check, and a good answer keeps that edge. Climbing from 81st to 38th came partly from genuine reform and partly from a low base — the early jumps are always the easiest. The hard yards are now: lifting R&D spending toward 1 per cent of GDP and beyond, getting companies to fund their own research, strengthening the institutions and infrastructure pillars where India still ranks in the fifties and sixties, and spreading innovation past four metros. As WIPO itself warned in 2025, global innovation investment is slowing — R&D growth cooled and venture capital is retreating toward a few rich markets — so the tailwind that helped India rise may weaken. The GII tells India exactly which levers to pull. Whether it pulls them, and how fast, is the open question worth flagging in any conclusion.
For Your Mains Answer
This is a high-value, plug-and-play topic for GS Paper 3, which covers the Indian economy, the development of science and technology, indigenisation and R&D, and the mobilisation of resources. Questions on innovation, the startup and research ecosystem, India’s global rankings, and the role of the private sector in R&D can all be answered with this material. It also feeds GS Paper 2 wherever government schemes and institutions like the ANRF come up, and it offers a clean, data-led example for the Essay paper on themes of knowledge economies, self-reliance and the future of work. The skill examiners reward here is the same one this article uses: state the rank and score precisely, then explain the input-output split that lies beneath it.
How to Build the Answer
Open with what the index is and who runs it — WIPO, around 140 economies, seven pillars in two halves. Then give India’s position in one tight sentence: 38th of 139 with a score of 38.2, up from 81st in 2015, and first among lower-middle-income economies. Move into the heart of the answer with the input-output split: outputs strong (32nd), inputs weak (52nd), over-performer for the fifteenth year. Layer on two concrete strengths (ICT services exports, unicorns and VC) and the two big weaknesses (R&D at 0.64 per cent of GDP, low private-sector research; weak institutions and infrastructure). Bring in the clusters to ground it — Bengaluru, Delhi, Mumbai, Chennai. Close with policy: the ANRF, Startup India and PLI as the response, and the honest caveat that the easy gains are over. That arc — define, locate, split, strengths, weaknesses, clusters, policy, verdict — fits almost any innovation question.
Common Mistakes to Avoid
Don’t confuse the GII with other indices that share initials, and always credit WIPO, not the World Economic Forum. Don’t quote India’s rank without the score and the denominator — “38th of 139, score 38.2” reads as authoritative; a bare “38th” does not. Don’t treat the climb as purely organic; acknowledge the low base. The biggest error is celebrating India’s output ranks without explaining the input weakness — the marks live in the gap between the two sub-indices, not in the headline rank. And don’t claim India under-spends only because the government is stingy; the real shortfall is private-sector R&D.
A Compact Answer Spine
GII = WIPO, ~140 economies, 80 indicators, 7 pillars split into 5 input + 2 output → India 38th of 139, score 38.2, up from 81st (2015), 1st among lower-middle-income economies, over-performer 15 years running → the split: outputs 32nd vs inputs 52nd → strengths: ICT services exports (1st), late-stage VC (4th), intangibles (8th), unicorns (11th), top-tier scientific output → weaknesses: GERD ~0.64% of GDP, weak private R&D, institutions ~58th, infrastructure ~61st → clusters: Bengaluru 21st, Delhi 26th, Mumbai 46th, Chennai 84th → policy: ANRF (₹50,000 cr corpus, mostly private), RDI fund, Startup India, PLI → verdict: strong on talent, weak on investment; the next climb needs money, not just minds.
Diagram or Flowchart Idea
Draw a simple two-column figure: on the left, “Inputs (52nd)” with the five input pillars and a down-arrow on R&D spending; on the right, “Outputs (32nd)” with the two output pillars and an up-arrow on ICT exports and unicorns. A bracket across the middle labelled “the over-performer gap” makes the central point instantly. Add a tiny step-line beside it rising 81 → 40 → 39 → 38 to show the trajectory. Two small visuals, the whole story.
A Balanced-Conclusion Line
A line that lands the marks: “India’s rise to 38th on the Global Innovation Index shows a nation out-innovating its own investment — rich in talent, startups and ideas, but still spending too little on research; the next leap up the index will be bought with rupees on R&D, not just earned by brains.”
How to Use Data Without Cramming
You need only five anchors, not a spreadsheet: 38th of 139 (the rank), 38.2 (the score), 81st in 2015 (the trajectory), 0.64 per cent of GDP (the R&D weakness), and 1st among lower-middle-income economies (the standing). Drop those five into the right sentences and the answer reads as expert. Attribute them plainly — “in WIPO’s Global Innovation Index 2025” — rather than scattering numbers loose.
FAQ
What is India’s rank in the Global Innovation Index 2025? India ranks 38th out of 139 economies in the Global Innovation Index 2025, with a score of 38.2 out of 100, published by the World Intellectual Property Organization (WIPO). That is up one place from 39th in 2024 and 40th in 2023, and a huge leap from 81st in 2015. India is the top-ranked economy in the Central and Southern Asia region and the leader among lower-middle-income economies, a position it has held since 2022.
Why is India called an innovation “over-performer”? Because India produces far more innovation than its income level would predict. The GII splits its score into inputs (what you invest) and outputs (what you get). India ranks 52nd on inputs but 32nd on outputs — strong results from modest investment. WIPO has formally listed India as an innovation over-performer for the fifteenth consecutive year, alongside its world-leading ICT services exports, large startup and unicorn base, and high volume of scientific publications and patents.
Where does India lag in the Global Innovation Index? On the input side. India ranks low on the Institutions, Infrastructure and Business Sophistication pillars (in the fifties and sixties). The most-cited weakness is research spending: India’s gross expenditure on R&D is around 0.64 per cent of GDP, far below China, South Korea and the United States, and the shortfall is largely because the private sector invests too little in research compared with peer economies.
What is the Anusandhan National Research Foundation (ANRF), and how is it linked to the GII? The ANRF is India’s apex research-funding body, set up under a 2023 Act that took effect in February 2024 to fund and coordinate research across universities and laboratories. It is built on a corpus of about 50,000 crore rupees, of which only around 14,000 crore comes from the government and roughly 36,000 crore is meant to be drawn from the private sector and philanthropy. It directly targets India’s biggest GII weakness — low private R&D spending — and is backed by a separate one-lakh-crore-rupee Research, Development and Innovation fund.
Practice Questions
Prelims MCQs
- The Global Innovation Index (GII) is released annually by which organisation?
(a) The World Economic Forum
(b) The World Intellectual Property Organization
(c) The World Bank
(d) The United Nations Development Programme
Answer: (b) The GII is published by WIPO, the UN agency dealing with intellectual property, ranking around 140 economies. - In the Global Innovation Index 2025, India was ranked at which position?
(a) 40th out of 132 economies
(b) 39th out of 133 economies
(c) 38th out of 139 economies
(d) 30th out of 139 economies
Answer: (c) India ranked 38th of 139 economies with a score of 38.2, up from 39th in 2024. - The seven pillars of the Global Innovation Index are divided into an Input Sub-Index and an Output Sub-Index.
Which of the following belongs to the Output Sub-Index?
(a) Institutions
(b) Human Capital and Research
(c) Market Sophistication
(d) Knowledge and Technology Outputs
Answer: (d) The two output pillars are Knowledge and Technology Outputs and Creative Outputs; the other five are input pillars. - With reference to India’s performance in the GII 2025, which statement is correct?
(a) India ranks higher on innovation inputs than on innovation outputs
(b) India ranks higher on innovation outputs than on innovation inputs
(c) India ranks equally on inputs and outputs
(d) India ranks first in the world on innovation inputs
Answer: (b) India ranks 32nd on outputs but 52nd on inputs, which is why WIPO calls it an innovation over-performer. - The Anusandhan National Research Foundation (ANRF) was established to boost research in India.
Which of the following is correct about it?
(a) It was set up under an Act of 2023 and is funded entirely by the government
(b) It was set up under an Act of 2023 with most of its corpus expected from the private sector and philanthropy
(c) It replaces WIPO in India
(d) It only funds defence research
Answer: (b) The ANRF Act came into force in 2024; of its roughly 50,000-crore-rupee corpus, only about 14,000 crore is from the government, with the rest sought from private and philanthropic sources.
Mains Practice Questions
- Examine the structure of the Global Innovation Index and analyse why India ranks far higher on innovation outputs than on innovation inputs. What does this gap reveal about the Indian economy? (15 marks, 250 words)
- “India is out-innovating its own investment.” Critically evaluate this statement in the light of India’s research-and-development spending and the role of the private sector. (15 marks, 250 words)
- Discuss India’s rise in the Global Innovation Index from 81st in 2015 to 38th in 2025. To what extent is this climb the result of deliberate policy rather than a low starting base? (15 marks, 250 words)
- The geography of innovation in India is concentrated in a few city-regions. Discuss the significance of India’s science-and-technology clusters and the challenge of spreading innovation more widely. (10 marks, 150 words)
- Evaluate the Anusandhan National Research Foundation as a response to India’s innovation weaknesses. How far can it address the structural gaps identified by global innovation rankings? (15 marks, 250 words)
Tell Google you want more of this.
Add Anantam IAS as a preferred sourceOne tap, and this site shows up more often in your own Top Stories, AI Overviews and AI Mode. Remove it any time.