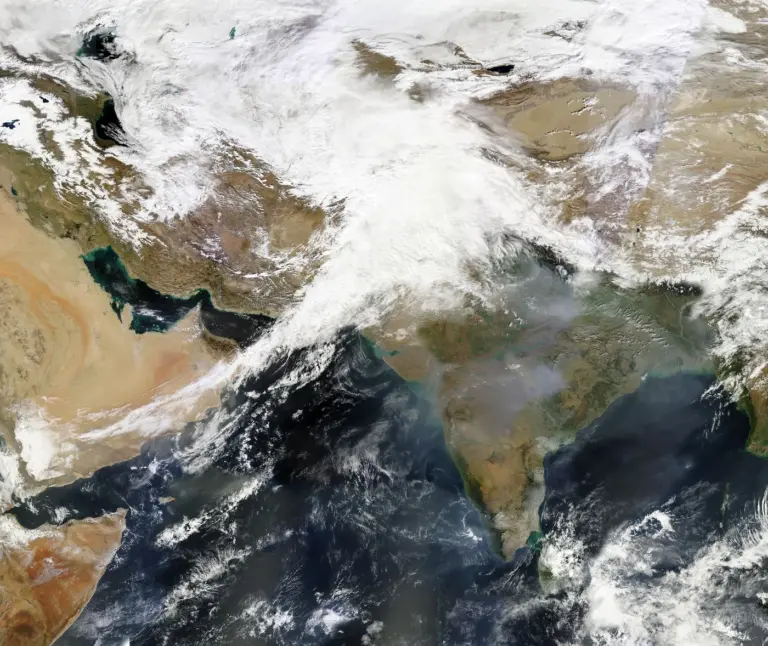
Regional imbalance in India is the persistent gap in income, infrastructure and human development between different parts of the country, and it is one of the few development problems that has grown rather than shrunk since 1991. The Constitution treats balanced regional development as a directive obligation, planning made it an explicit objective, and yet the gap between the richest and poorest large states has widened. Understanding why is a standard GS question.
The Colonial Inheritance
India did not start from a level base. Colonial development was port-led and export-oriented, and it left a specific spatial pattern.
- Modern industry, banking and rail hubs concentrated in the Bombay, Calcutta and Madras presidencies.
- The interior served as a raw-material periphery, connected to ports rather than to each other.
- Deindustrialisation of handicrafts hollowed out inland artisanal towns.
- The permanently settled zamindari belt of eastern India was left with chronically weak agrarian investment.
How Planning Tried to Fix It
- Public-sector location. Steel plants at Bhilai, Rourkela, Durgapur and later Bokaro were deliberately sited on the central and eastern mineral belt, away from the colonial coastal core.
- Backward-area incentives. The Pande and Wanchoo Working Groups of 1968-69 created licensing preferences, transport subsidies, capital subsidies and concessional finance for industrially backward districts.
- Fiscal transfers. The Gadgil formula of 1969, later the Gadgil-Mukherjee formula, weighted plan assistance towards population and per capita income.
- Special Category Status gave hill and border states a 90:10 grant-to-loan ratio, until the Fourteenth Finance Commission effectively subsumed it.
- Area programmes: Drought Prone Areas Programme, Desert Development Programme, Hill Area Development Programme, Tribal Sub-Plan and command-area development. The broader arc is traced in our note on the evolution of planning in India.
Why the Gap Widened Anyway
- Enclave PSUs. Steel and heavy engineering plants generated few local linkages; the surrounding districts stayed poor.
- Licence-permit protection. The control regime often protected incumbents in already-advanced regions rather than seeding new ones.
- Uneven land reform. Agrarian catch-up depended on tenancy reform and ceiling implementation, which happened in Kerala and West Bengal and largely did not elsewhere.
- Post-1991 private investment followed infrastructure, human capital, port access and governance quality, all of which the coastal and southern states already had.
- Demographic divergence. Southern states completed the fertility transition decades earlier, so their dependency ratios and per capita numbers improved faster.
How It Is Measured
- Per capita net state domestic product, the headline comparison.
- NITI Aayog’s Multidimensional Poverty Index, which captures health, education and living standards rather than income alone.
- SDG India Index scores by state and district.
- Human development indicators: infant mortality, literacy, female labour force participation.
- Infrastructure indices covering road density, electrification and internet penetration.
- Intra-state disparity, which is often larger than inter-state disparity and is routinely ignored.
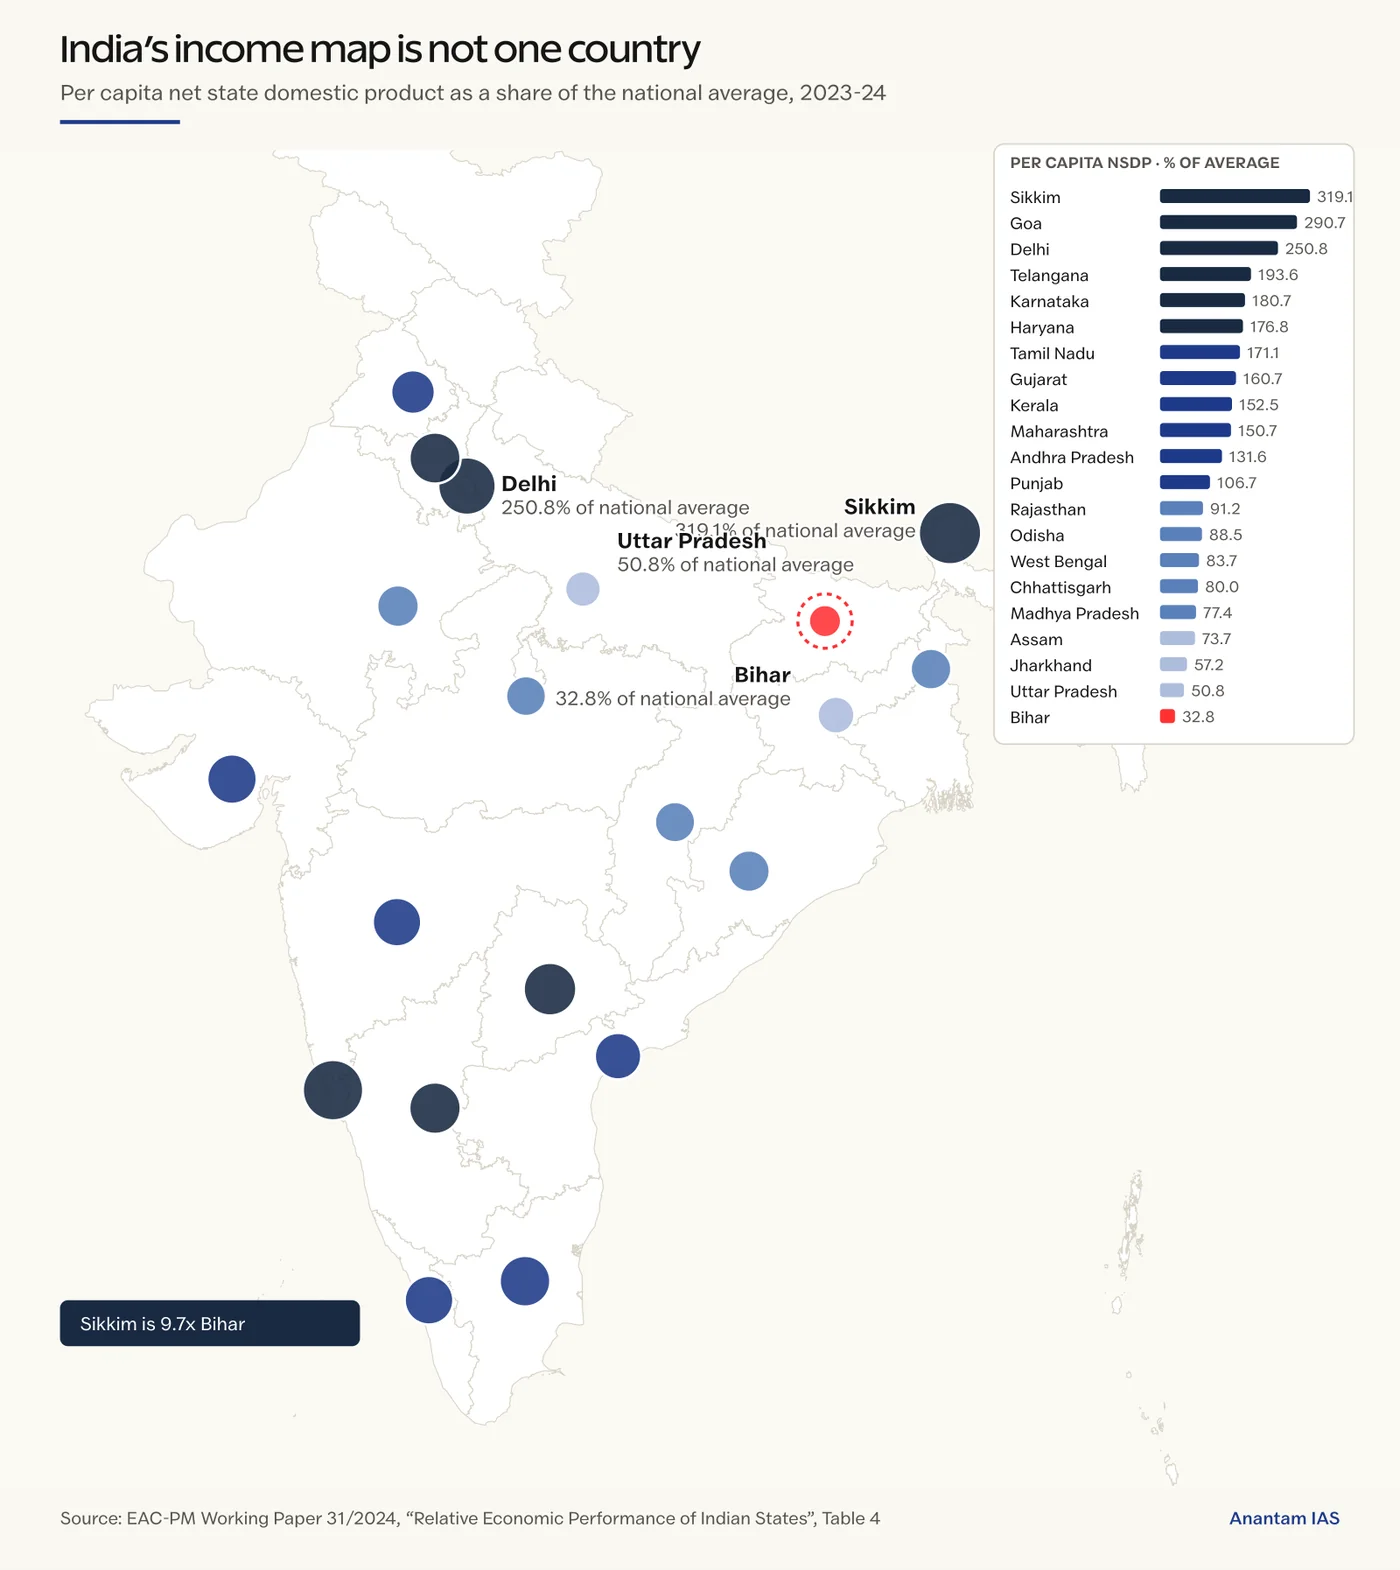
The Political Dimension
Regional imbalance is not only an economic question. It surfaces at every Finance Commission over the devolution formula, and it is about to become sharper.
- States that reduced fertility successfully face relative loss of parliamentary weight when delimitation is next carried out.
- Southern and western states argue that transfer formulas penalise them for better performance on population and revenue effort.
- Poorer states argue that need-based transfers are the whole point of a federal compact.
- Both positions are internally coherent, which is why the issue has no technical solution, only a negotiated one. Our note on cooperative and competitive federalism covers the institutional setting.
Current Instruments
| Instrument | Approach |
|---|---|
| Aspirational Districts Programme (2018) | Ranks and supports 112 of the least-developed districts on composite indicators |
| Aspirational Blocks Programme (2023) | Extends the same method to 500 blocks |
| Finance Commission devolution | Horizontal formula weighting income distance, population, area and forest cover |
| NITI Aayog | Cooperative and competitive federalism through indices and state support missions |
| PM Gati Shakti | Infrastructure corridor planning to connect lagging regions |
| North East Special Infrastructure Development Scheme | Targeted regional infrastructure funding |
Frequently Asked Questions
What is regional imbalance in India?
It is the persistent disparity in income, infrastructure, industrialisation and human development between different states and regions of India. It is measured through per capita net state domestic product, multidimensional poverty, SDG index scores and infrastructure indicators.
What are the main causes of regional imbalance in India?
A colonial legacy of port-led development, uneven natural resource and agro-climatic endowments, uneven implementation of land reform, enclave-type public sector investment with weak local linkages, and post-1991 private investment flowing to regions that already had infrastructure, human capital and governance capacity.
Did planning reduce regional imbalance in India?
Only partially. Public sector siting brought industry to the mineral belt and Special Category transfers raised expenditure capacity in hill and border states, but enclave plants generated few local linkages and divergence widened after 1991 as private investment concentrated in already-advanced regions.
What is the Gadgil formula?
It is the formula adopted in 1969 for distributing central plan assistance among states, weighting population and per capita income among other criteria. It was later revised as the Gadgil-Mukherjee formula and was the main plan-transfer mechanism until the Planning Commission was replaced.
What is the Aspirational Districts Programme?
Launched in 2018, it identifies 112 of India’s least-developed districts and drives improvement through ranking on composite indicators covering health and nutrition, education, agriculture and water resources, financial inclusion, skill development and basic infrastructure. An Aspirational Blocks Programme extended the method in 2023.
Why is delimitation linked to regional imbalance?
Because states that reduced fertility fastest, mostly in the south, would lose parliamentary seats relative to higher-fertility states if seats were reallocated purely on current population. That turns a demographic success into a political cost and makes the transfer and representation debate sharper.
Practice Questions
Prelims MCQs
1. The Gadgil formula was adopted in which year for distributing central plan assistance?
- (a) 1956
- (b) 1969
- (c) 1980
- (d) 1991
Answer: (b) 1969
2. The Aspirational Districts Programme covers how many districts?
- (a) 90
- (b) 101
- (c) 112
- (d) 150
Answer: (c) 112
3. Steel plants at Bhilai, Rourkela and Durgapur were sited primarily to:
- (a) Be close to export ports
- (b) Take industry to the central and eastern mineral belt
- (c) Serve the defence sector
- (d) Use imported iron ore efficiently
Answer: (b) Take industry to the central and eastern mineral belt
4. Special Category Status historically provided assistance in which grant-to-loan ratio?
- (a) 50:50
- (b) 70:30
- (c) 90:10
- (d) 100:0
Answer: (c) 90:10
5. Which body replaced the Planning Commission in 2015?
- (a) Finance Commission
- (b) NITI Aayog
- (c) Inter-State Council
- (d) National Development Council
Answer: (b) NITI Aayog
Mains Questions
- The model of planned economy was adopted in India to address the regional imbalances left behind by colonial rule. Comment.
- “Regional imbalance in India has widened despite six decades of corrective policy.” Critically examine the reasons.
- Discuss the role of Finance Commission devolution in addressing inter-state disparities, and the tensions it generates.
- Examine the argument that intra-state disparity deserves more policy attention than inter-state disparity in India.
- Assess the Aspirational Districts Programme as an instrument for reducing regional development gaps.
Tell Google you want more of this.
Add Anantam IAS as a preferred sourceOne tap, and this site shows up more often in your own Top Stories, AI Overviews and AI Mode. Remove it any time.