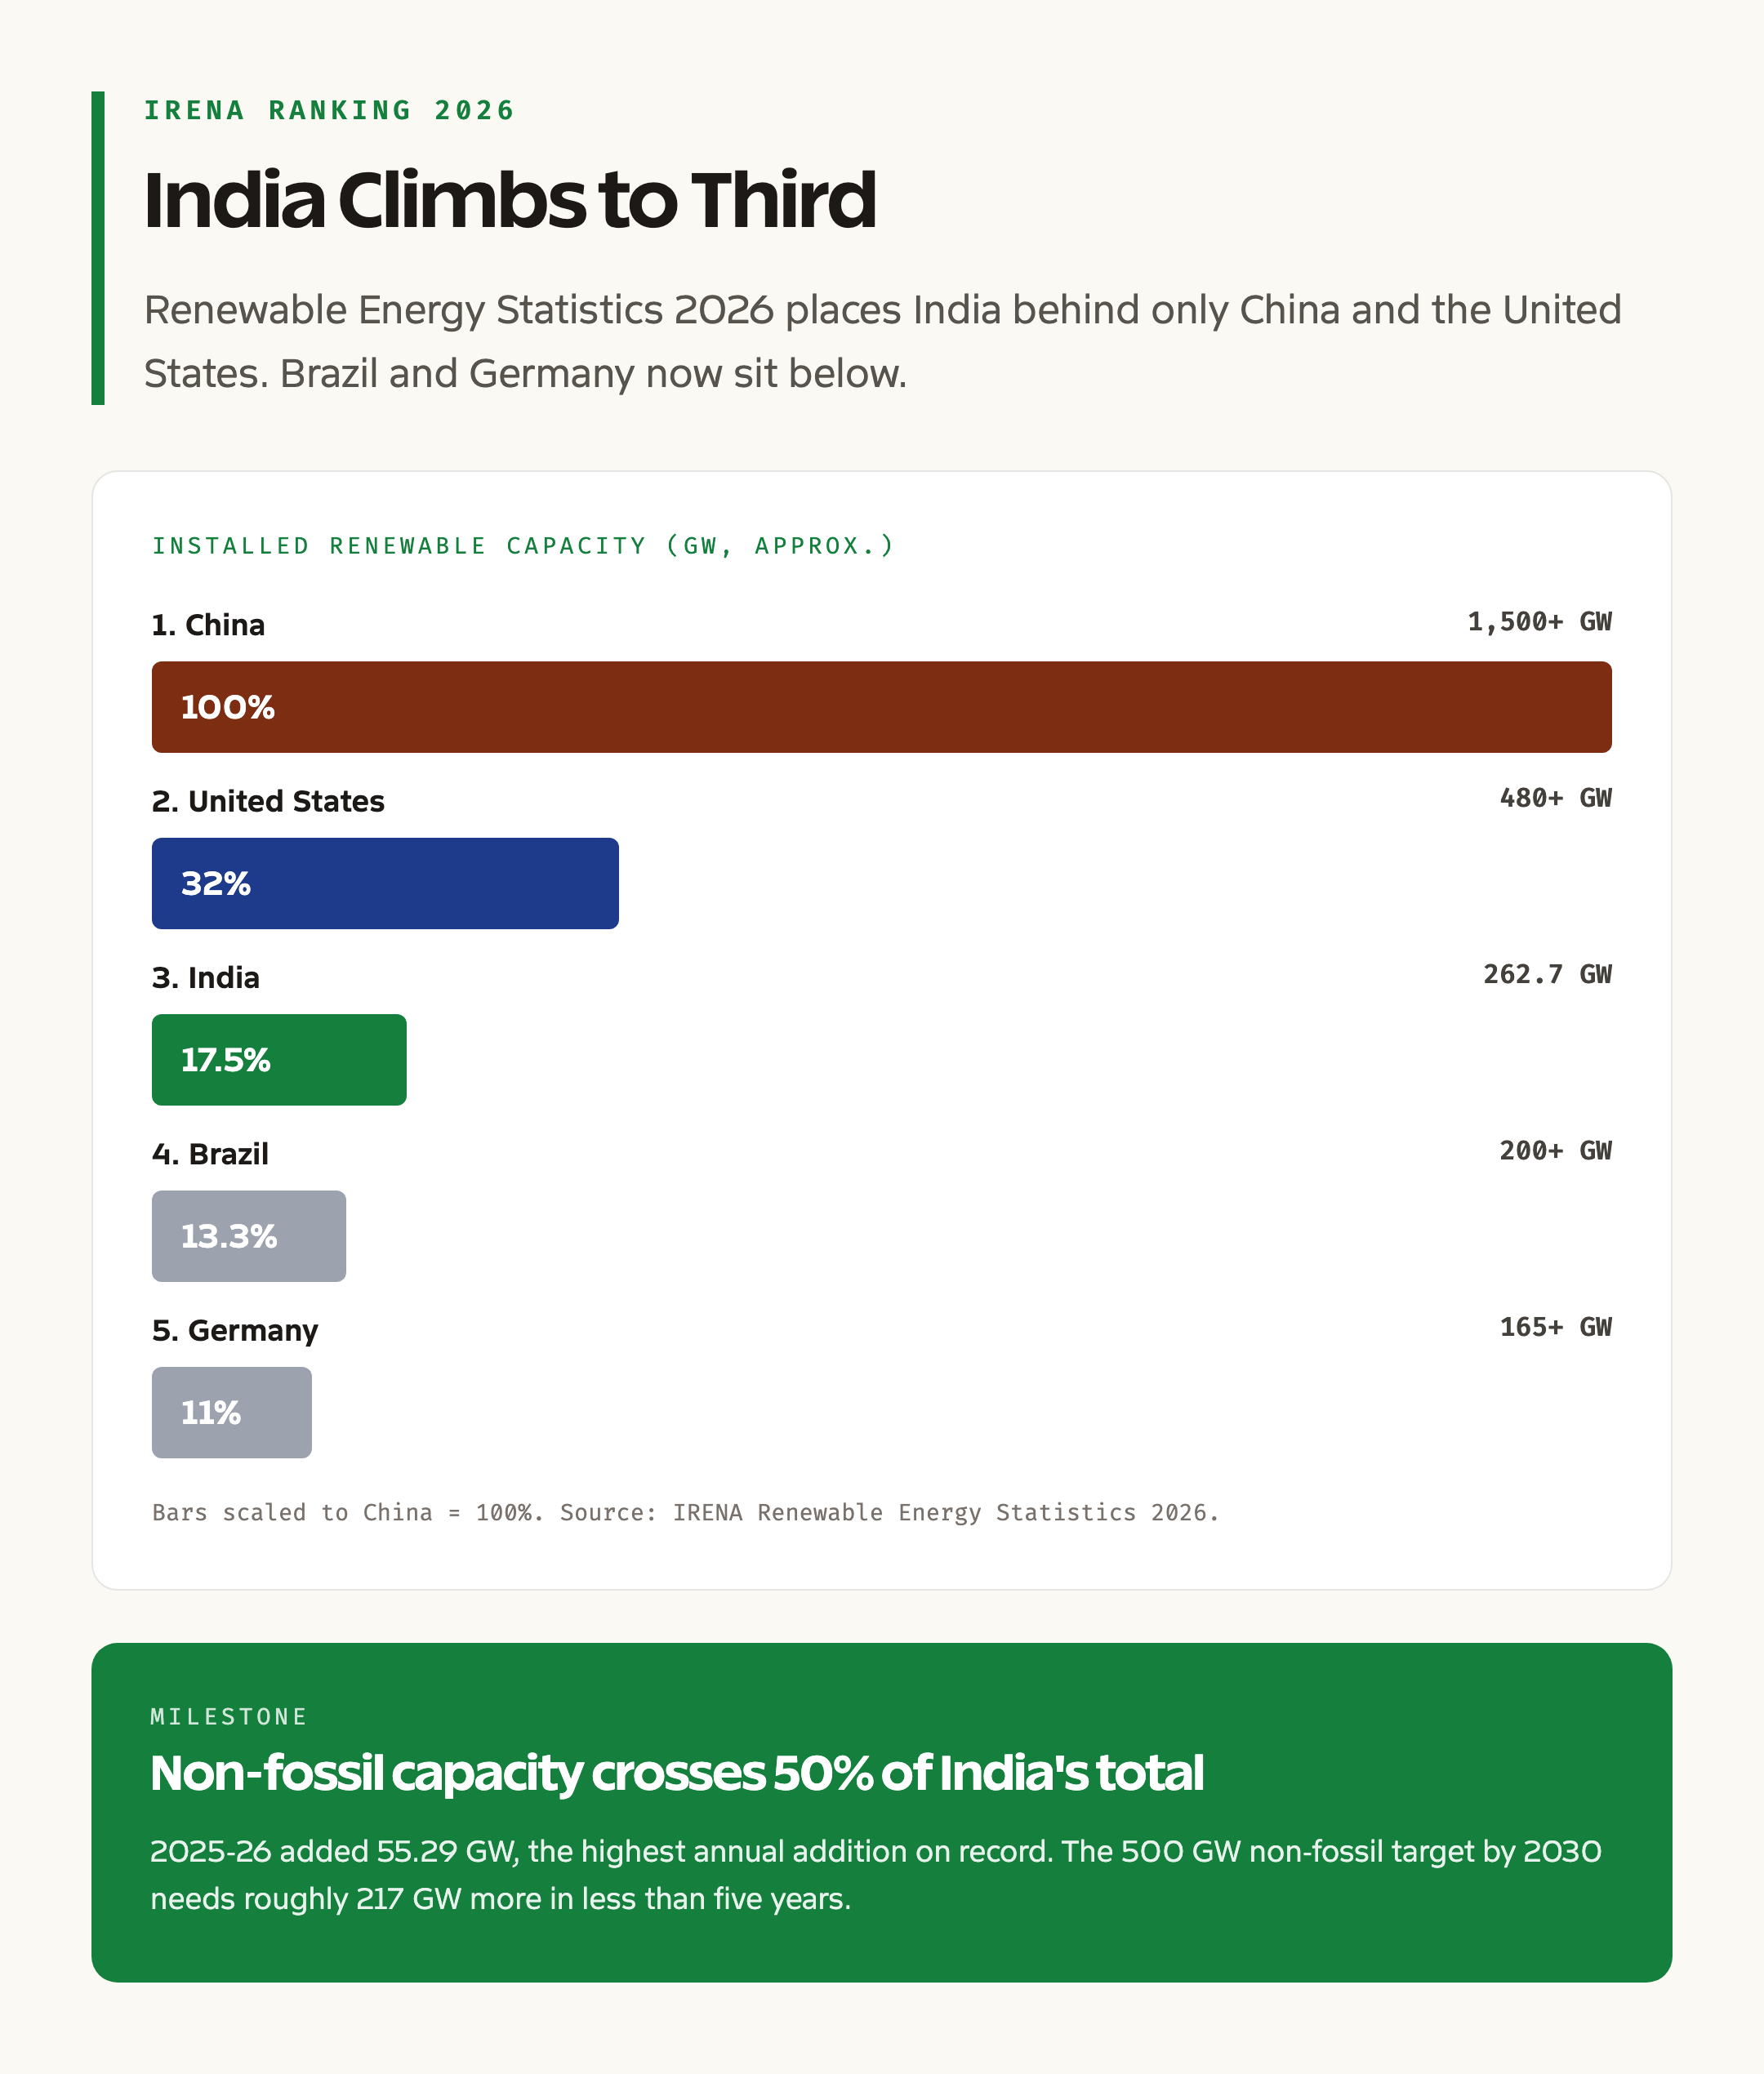
India third largest renewable energy capacity holder. The headline broke on May 11, 2026, when the Union Minister for New and Renewable Energy Pralhad Joshi shared figures from the Renewable Energy Statistics 2026 published by IRENA. The country now sits behind only China and the United States in installed renewable energy capacity, having pushed past Brazil over the previous two years. Total non-fossil installed capacity has crossed 283 GW. Pure renewables, the metric used for the IRENA ranking, stand at 262.7 GW.
That number deserves applause, but it also deserves a closer look. Behind the milestone sits a fragile manufacturing base, a record-breaking annual capacity addition that masks grid integration headaches, and a 2030 target that still needs roughly 220 GW more of clean capacity in less than five years. If you are preparing for UPSC, the story to remember is not just the rank. It is the gap between installed capacity and energy delivered, and the supply chain dependence that nobody puts in the headline.
This piece walks through what changed, why the ranking matters, where India’s clean energy mix actually sits today, and the harder questions about the supply chain, particularly around polysilicon and solar cell manufacturing.
Quick Facts
- Announcement: May 11, 2026, by Union Minister for New and Renewable Energy Pralhad Joshi
- Source: Renewable Energy Statistics 2026, published by the International Renewable Energy Agency (IRENA)
- India’s pure renewable capacity: 262.7 GW (excluding large hydro and nuclear in some definitions, including them in others depending on category)
- Total non-fossil installed capacity: 283.46 GW as of March 31, 2026
- Global rank: Third, behind China and the United States, ahead of Brazil and Germany
- 2025-26 capacity addition: 55.29 GW, the highest in any single year
- 2030 target: 500 GW of non-fossil installed capacity (Panchamrit commitments at COP26)
- Non-fossil share of total installed capacity: Crossed 50 percent in 2025
What Just Happened
The Renewable Energy Statistics 2026 from IRENA placed India third in the world for installed renewable energy capacity. The headline figure builds on a decade of renewable energy policy that combined subsidies, tariffs, and manufacturing incentives. The release confirmed two things. First, India third largest renewable energy ranking is now official, replacing Germany and Brazil from earlier rankings. Second, the country crossed a domestic threshold that the National Electricity Plan had projected for 2027: non-fossil sources crossed 50 percent of total installed capacity in 2025-26.
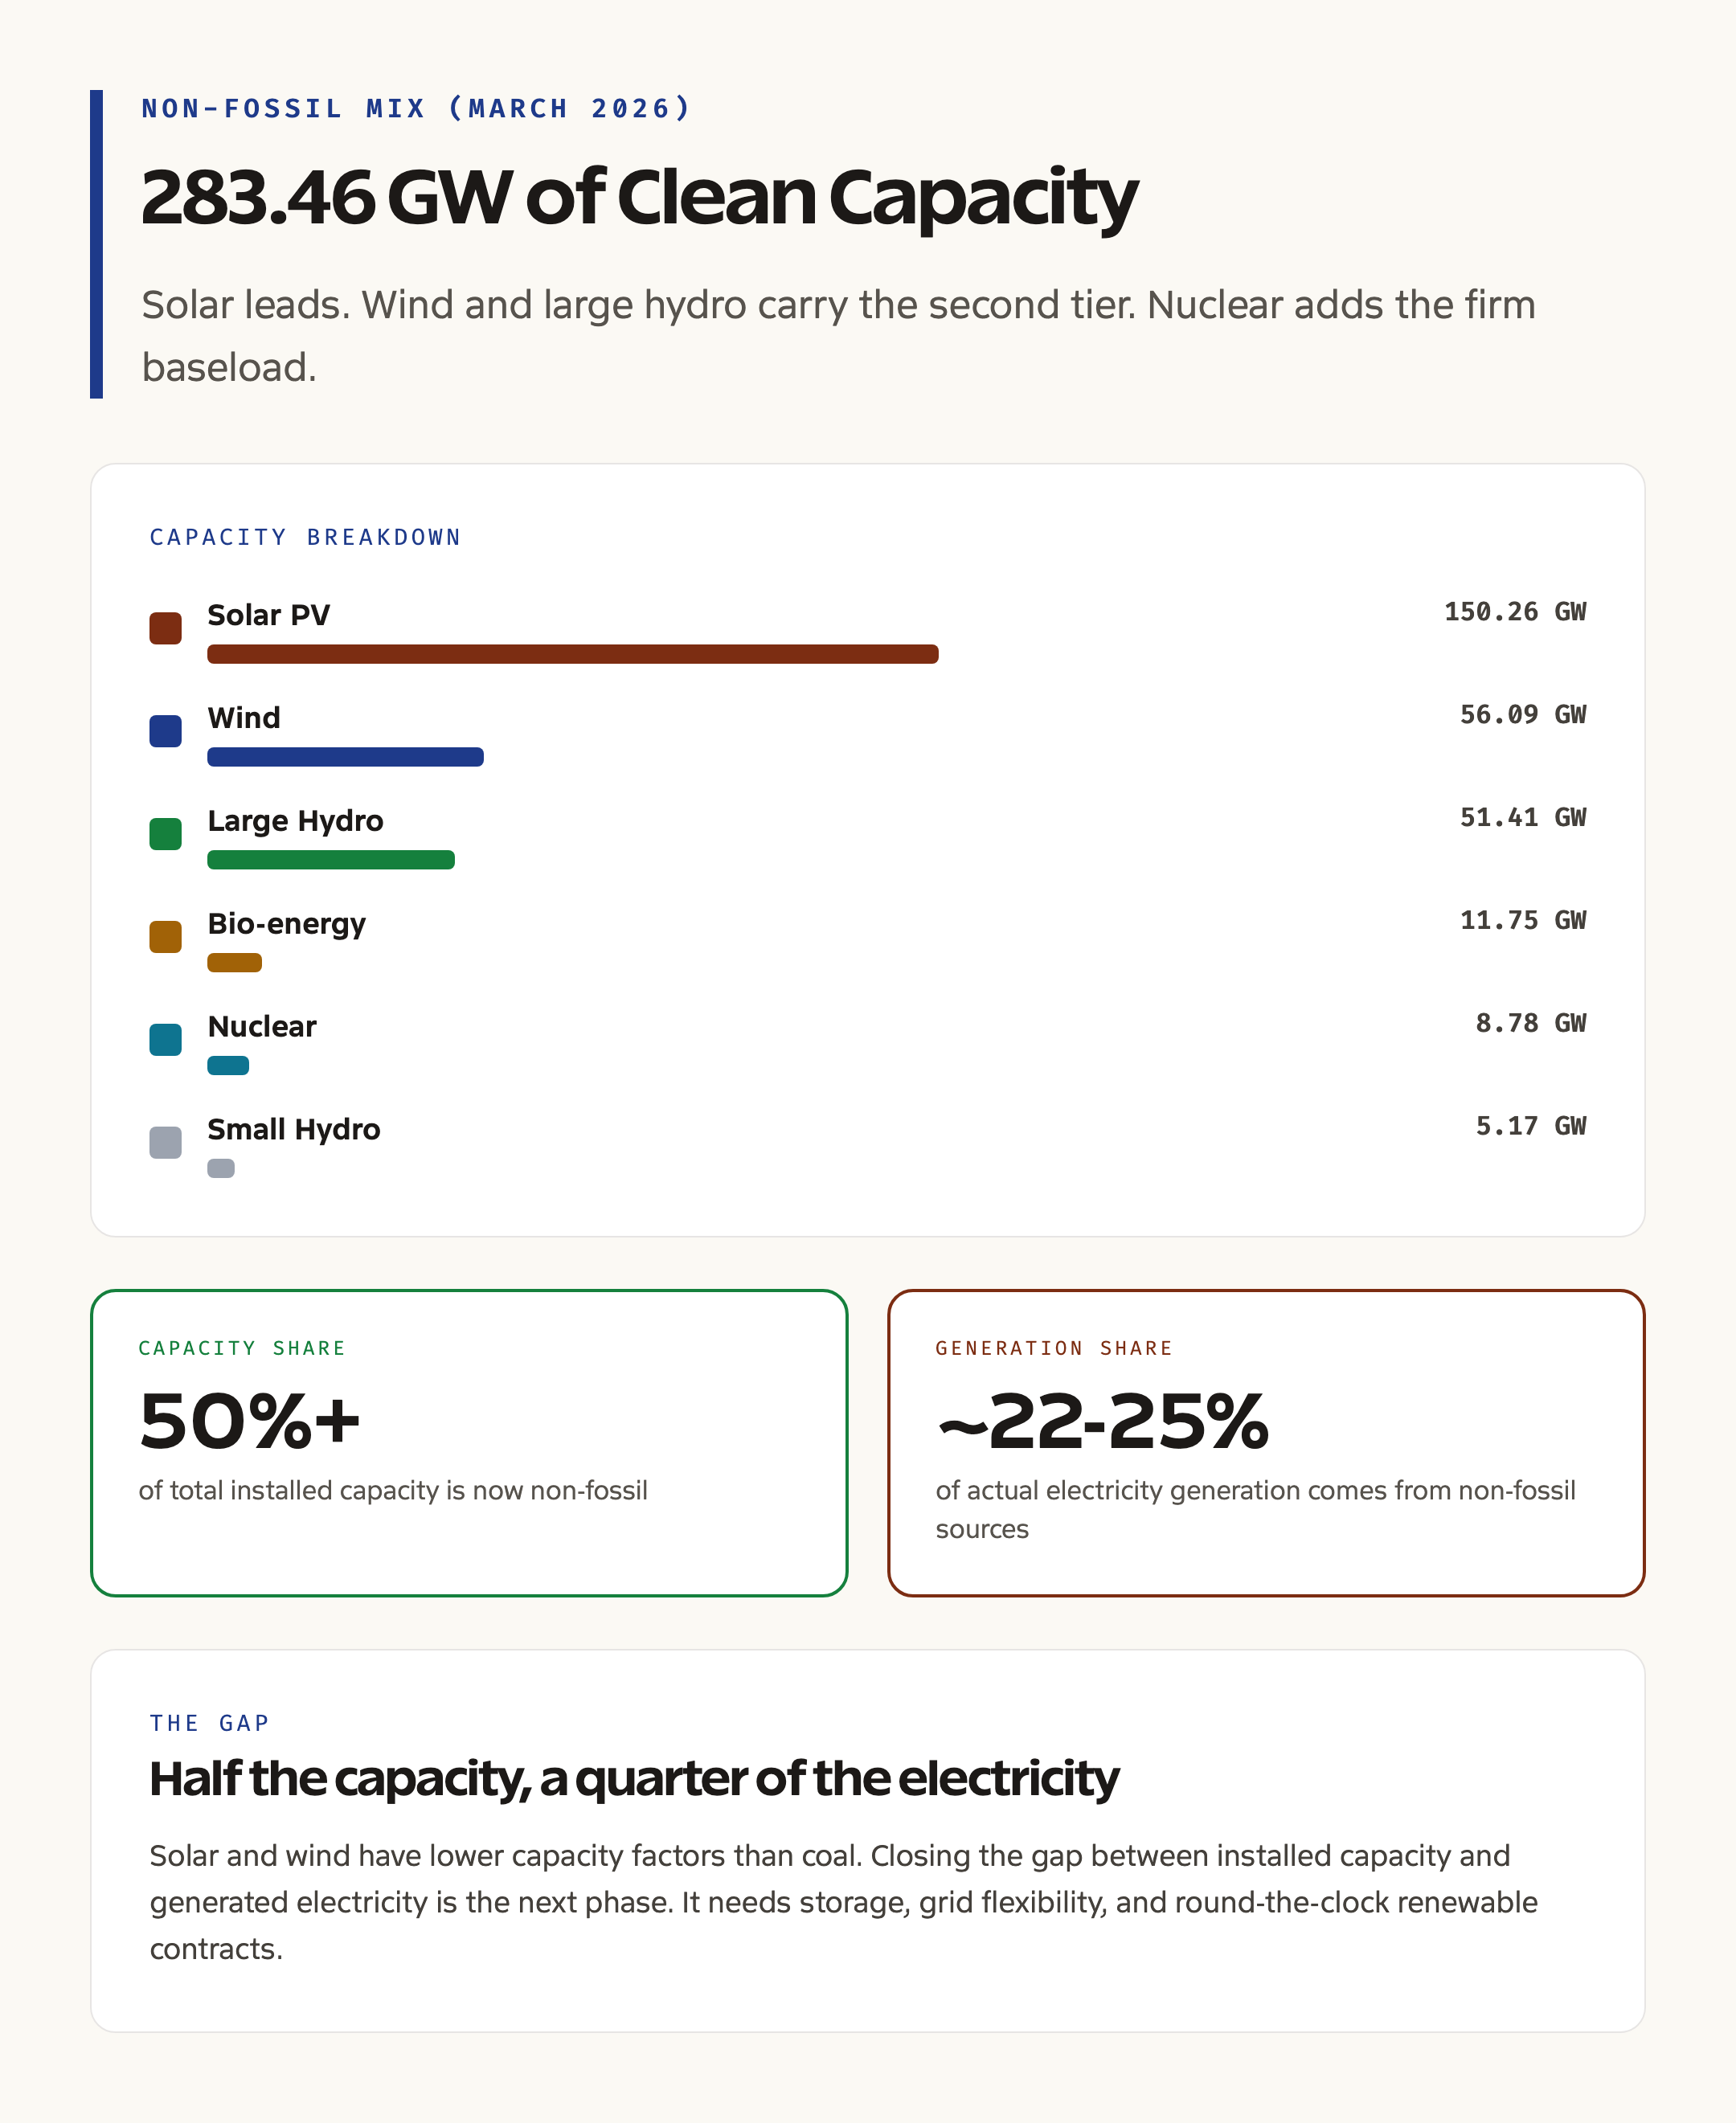
The Ministry of New and Renewable Energy (MNRE) released a breakdown of the 283.46 GW non-fossil installed capacity as of March 31, 2026. It includes 274.68 GW of renewables and 8.78 GW of nuclear. Within renewables, solar power leads at 150.26 GW, followed by wind at 56.09 GW, large hydro at 51.41 GW, bio-energy at 11.75 GW, and small hydro at 5.17 GW.
The 55.29 GW added in 2025-26 was driven almost entirely by solar, including utility-scale solar parks, distributed rooftop installations under the PM Surya Ghar Muft Bijli Yojana, and the first commercial-scale operationalization of solar-wind hybrid plants under the National Hybrid Policy.
Background and Historical Context
India’s solar energy story really begins with the National Solar Mission of 2010, one of the eight missions under the National Action Plan on Climate Change (NAPCC). The original target was 20 GW of solar by 2022. By 2015, that target had been revised upward to 100 GW of solar within a 175 GW renewable energy goal for 2022.
That 175 GW target was the first time India publicly committed to scale. The country missed the original 2022 deadline. By December 2022, the installed renewable capacity was around 122 GW, well short of 175. But the slope of the curve was sharp enough that the subsequent target, 500 GW of non-fossil installed capacity by 2030, was announced at COP26 in Glasgow as part of the Panchamrit commitments.
Three external developments changed the trajectory. First, the cost of utility-scale solar PV crashed globally, from roughly USD 0.30 per kWh in 2010 to below USD 0.03 per kWh by 2024 in competitive auctions. Second, India set up the International Solar Alliance (ISA) in 2015, headquartered in Gurugram, to coordinate solar deployment across sun-rich countries. Third, the Production Linked Incentive (PLI) scheme for solar PV manufacturing, launched in 2021 and expanded in 2022, started building domestic capacity in ingots, wafers, cells, and modules.
By 2024-25, the policy stack had three reinforcing levers. The Approved List of Models and Manufacturers (ALMM) restricted procurement of imported solar modules in government-supported projects. The Basic Customs Duty (BCD) of 40 percent on imported modules and 25 percent on imported cells made imports expensive. The PLI scheme of approximately INR 24,000 crore was building integrated manufacturing.
What the May 2026 announcement confirms is that the policy stack has worked on capacity addition. The harder question is whether it has worked on manufacturing depth.
Key Provisions and Features of the Current Push
Four elements drive the current trajectory.
- Utility-scale solar and wind: Competitive bidding, viability gap funding for offshore wind, and solar park infrastructure under the Ultra Mega Solar Power Park scheme have driven the bulk of capacity addition.
- PM Surya Ghar Muft Bijli Yojana: Launched in February 2024, the scheme targets one crore households with rooftop solar and free electricity up to 300 units per month. As of early 2026, more than 1.5 million installations have been completed.
- PM-KUSUM: The Pradhan Mantri Kisan Urja Suraksha evam Utthaan Mahabhiyan covers solar water pumps under PM-KUSUM, grid-connected agricultural solar, and decentralized solar power plants. It is the rural workhorse of the solar mission.
- National Green Hydrogen Mission: The National Green Hydrogen Mission carries INR 19,744 crore in outlay through 2030, the mission targets 5 million tonnes of green hydrogen production annually, which would require roughly 125 GW of additional renewable capacity to feed electrolysers.
Behind the headline capacity sits the National Mission on Advanced High Efficiency Solar PV Modules under PLI. Tranche-I awarded 8.7 GW of integrated capacity. Tranche-II expanded it to nearly 39.6 GW.
Why It Matters for India
The third-place ranking matters on five fronts. It strengthens India’s climate diplomacy hand at COP and G20 forums, where the country has long argued that emerging economies are doing more on clean energy than they are credited for. It validates the policy stack, which combined subsidies, mandates, tariffs, and PLI, and gives the country a template for green hydrogen and battery storage scale-up. It improves India’s attractiveness for green finance, with the renewable energy sector now drawing more than USD 15 billion in annual investment.
The ranking also reduces a chunk of the country’s external vulnerability. Every GW of solar capacity displaces roughly 1.5 to 2 million tonnes of coal demand per year. With coal still meeting around 55 percent of installed capacity and roughly 70 percent of generation, the renewable push is the only structural lever for energy import substitution.
Finally, it sets up the next harder fight, which is generation share, not just capacity share. Solar capacity factors in India sit around 18 to 22 percent. Wind sits at 22 to 28 percent. Coal sits at 55 to 65 percent. So 50 percent of installed capacity from non-fossil sources delivers only about 22 to 25 percent of actual electricity generation. The next phase is about storage, grid flexibility, and round-the-clock renewable contracts.
Detailed Analysis: The Polysilicon Problem
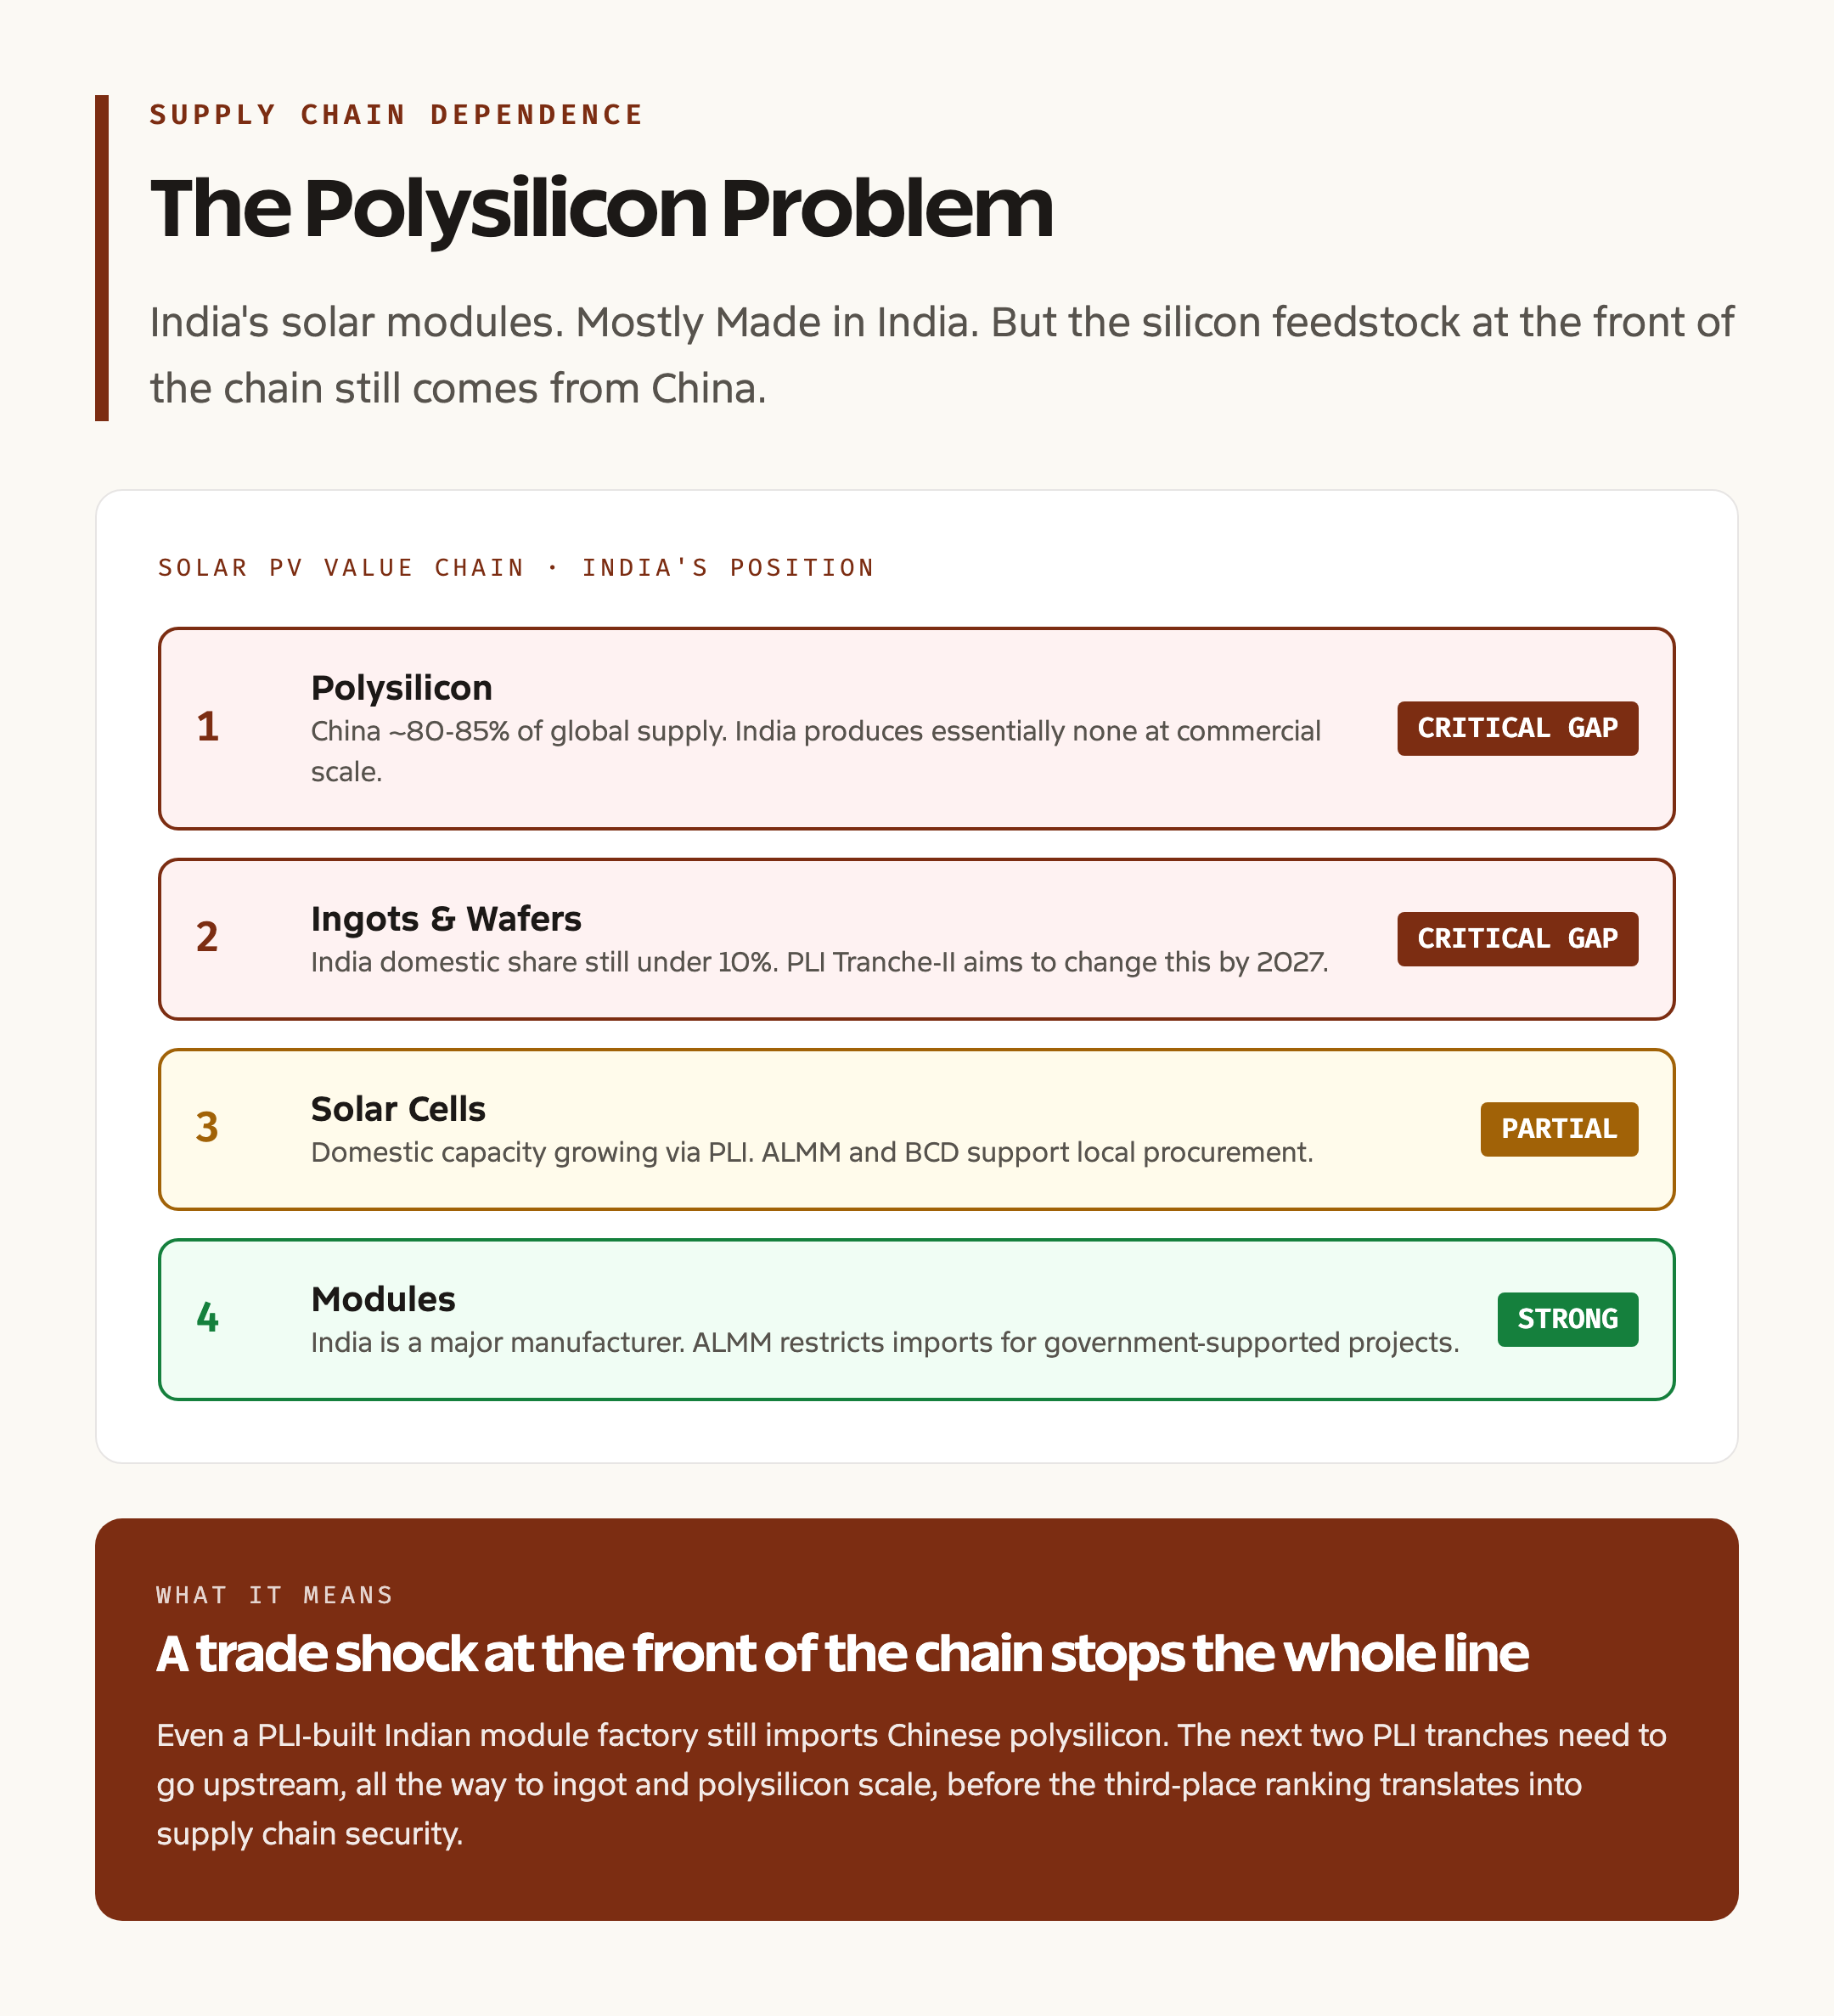
Here is where the picture gets harder. India third largest renewable energy capacity holder, yes, but most of those solar modules sit on top of imported polysilicon. Polysilicon is the silicon-grade feedstock that gets sliced into wafers, doped into cells, and assembled into modules. China produces roughly 80 to 85 percent of global polysilicon and an even higher share of wafers. India produces essentially none at commercial scale today.
Domestic manufacturing of perovskite solar cells in India is a parallel story but commercial scale is still some years away. The PLI scheme has begun to plug the gap in modules and cells. But going upstream into wafers and ingots is harder, and into polysilicon harder still. Polysilicon plants need cheap, reliable power (typically below INR 4 per kWh round the clock), large gas or chemical feedstock supply, and capital expenditure of USD 1 to 2 billion per facility. Returns are long-cycle.
What this means in practice is uncomfortable. Even a fully PLI-built Indian module factory still depends on Chinese polysilicon at the front end of the value chain. A trade disruption with China, whether tariff-led, geopolitical, or pandemic-style, could squeeze India’s solar deployment within months. The International Solar Alliance has begun pushing for diversified polysilicon production across member countries, but nothing at scale exists yet.
The other supply chain vulnerability is rare earths and critical minerals for wind turbines and battery storage. India does not have substantial domestic lithium, cobalt, or neodymium production. The Khanij Bidesh India Limited (KABIL) joint venture is acquiring overseas mineral assets, but the timeline is long.
Comparative Perspective
The top five renewable energy producers globally tell a clear story.
| Country | Installed Renewable Capacity (approx.) | Strength | Vulnerability |
|---|---|---|---|
| China | 1,500+ GW | Vertically integrated supply chain | Domestic coal still dominant in generation |
| United States | 480+ GW | Mature wind base, strong storage push | Policy whiplash across administrations |
| India | 262.7 GW | Fast capacity addition, low cost | Manufacturing depth and grid flexibility |
| Brazil | 200+ GW | Large hydro base, growing solar | Drought-induced hydro volatility |
| Germany | 165+ GW | Grid integration, storage tech | High retail electricity prices |
India’s relative position is genuinely strong on cost and pace. The vulnerability sits on the depth side. China achieved its dominance by going upstream into polysilicon, wafer, glass, encapsulant, junction box, and inverter manufacturing simultaneously. India has chosen to go down the value chain from modules to cells first. Whether the country can compress the polysilicon and wafer build-out into the next five years is the real test.
Challenges Ahead
The 500 GW by 2030 target requires roughly 217 GW more capacity in less than five years, or about 50 GW per year. That is achievable based on 2025-26 numbers, but only if four constraints are managed.
First, transmission. The Central Electricity Authority estimates the country needs roughly INR 9 lakh crore in transmission investment by 2030 to evacuate renewable generation from Rajasthan, Gujarat, Tamil Nadu, and Andhra Pradesh to demand centers in the north and east.
Second, storage. Battery energy storage system (BESS) capacity needs to scale from under 5 GWh today to roughly 40 GWh by 2030 to handle solar over-generation in midday hours. Tariffs for storage-backed renewable contracts are still 30 to 50 percent higher than plain solar.
Third, land. Utility-scale solar needs roughly 4 to 5 acres per MW. The PM-KUSUM model of farm-edge solar helps, but acquiring contiguous land remains a bottleneck in densely populated states.
Fourth, manufacturing depth. Without domestic polysilicon and wafer production, the cost and security advantage of being India third largest renewable energy economy stays partial.
Prelims Pointers
- The Renewable Energy Statistics 2026 ranking is released by IRENA (International Renewable Energy Agency).
- IRENA was established in 2009 and is headquartered in Abu Dhabi, UAE.
- The International Solar Alliance is headquartered in Gurugram, Haryana.
- India’s Panchamrit commitments at COP26 (Glasgow, 2021) include 500 GW of non-fossil capacity by 2030 and net-zero by 2070.
- India’s total non-fossil installed capacity as of March 31, 2026: 283.46 GW (including 8.78 GW nuclear).
- Solar PV: 150.26 GW. Wind: 56.09 GW. Large hydro: 51.41 GW. Bio-energy: 11.75 GW. Small hydro: 5.17 GW. Nuclear: 8.78 GW.
- Capacity added in 2025-26: 55.29 GW, highest annual addition on record.
- PM Surya Ghar Muft Bijli Yojana was launched in February 2024.
- ALMM stands for Approved List of Models and Manufacturers.
- The Basic Customs Duty (BCD) on imported solar modules is 40 percent, on imported cells is 25 percent.
- PLI scheme for solar PV manufacturing total outlay is approximately INR 24,000 crore across Tranche-I and Tranche-II.
- National Green Hydrogen Mission target: 5 million tonnes per annum by 2030.
Mains Questions
- India third largest renewable energy capacity holder, but generation share lags significantly behind capacity share. Discuss the policy and technological steps needed to close this gap. (GS Paper 3, Environment and Economy, 250 words)
- The PLI scheme has built solar module capacity but the polysilicon and wafer dependence on China remains. Critically evaluate India’s solar manufacturing policy. (GS Paper 3, Economy, 250 words)
- Examine the role of the International Solar Alliance in India’s clean energy diplomacy. How does it complement the IORA and BIMSTEC platforms? (GS Paper 2, International Relations, 250 words)
- “Achieving 500 GW of non-fossil capacity by 2030 is necessary but not sufficient for India’s energy transition.” Justify. (GS Paper 3, 150 words)
Way Forward
The next phase of India’s clean energy build needs to move on four parallel tracks. On manufacturing, the country needs at least two commercial-scale polysilicon plants operational by 2028. The PLI scheme should be extended upstream with specific terms for polysilicon and wafer fabrication. On grid, the National Electricity Plan transmission build needs to be front-loaded to 2027-28 rather than 2029-30, especially the high-voltage direct current corridors from western and southern renewable zones.
On storage, the Viability Gap Funding for BESS, announced in 2024, needs to scale at least fivefold to bring storage-backed tariffs within striking distance of plain solar. On finance, sovereign green bonds and the Climate Finance Taxonomy notified by the Ministry of Finance should be operationalized to channel insurance and pension money into long-duration assets.
The IRENA ranking is a strong waypoint. It is not a destination. The harder work, on supply chain depth, generation share, storage, and grid flexibility, starts now.
Frequently Asked Questions
When did India become the third largest renewable energy producer?
The ranking was confirmed in the Renewable Energy Statistics 2026 published by IRENA, announced by the Ministry of New and Renewable Energy on May 11, 2026. India had moved into third place by overtaking Brazil over the previous two years.
What is the difference between renewable energy capacity and non-fossil capacity?
Renewable energy capacity typically includes solar, wind, small hydro, large hydro, and bio-energy. Non-fossil capacity adds nuclear to that mix. India’s renewable capacity is 274.68 GW and its total non-fossil capacity is 283.46 GW as of March 31, 2026.
Why does the IRENA ranking show 262.7 GW while MNRE figures show 283.46 GW?
IRENA’s methodology in the headline ranking covers a narrower set of renewable sources and uses a slightly earlier cut-off date, which produces the 262.7 GW figure. The MNRE 283.46 GW figure includes nuclear and is updated to March 31, 2026.
What is the 500 GW target and where does it come from?
The 500 GW non-fossil installed capacity target by 2030 is part of India’s Panchamrit commitments announced at COP26 in Glasgow in November 2021. It was paired with net-zero by 2070 and a 45 percent emissions intensity reduction by 2030 compared to 2005 levels.
What is the polysilicon problem in Indian solar?
Polysilicon is the silicon feedstock used to make solar wafers and cells. China produces roughly 80 to 85 percent of global polysilicon. India does not have commercial-scale polysilicon production today, so even domestically manufactured Indian solar modules depend on Chinese inputs at the front of the supply chain.
What is the International Solar Alliance?
The International Solar Alliance (ISA) is an India-led intergovernmental organization headquartered in Gurugram. It was launched at COP21 in Paris in 2015 and aims to mobilize finance, technology, and policy support for solar deployment across sun-rich countries.
How big is India’s annual capacity addition?
In 2025-26, India added 55.29 GW of non-fossil capacity, the highest annual addition on record. The previous high was around 35 GW in 2023-24.
What is PM Surya Ghar Muft Bijli Yojana?
Launched in February 2024, the scheme targets one crore households with rooftop solar installations. Eligible households get free electricity up to 300 units per month and capital subsidy on installation cost. More than 1.5 million installations have been completed by early 2026.
What are the main risks to the 2030 target?
Transmission build delays, slow storage deployment, land acquisition friction, and continued upstream supply chain dependence on China for polysilicon, wafers, and rare earths are the four main risks.
Is India’s non-fossil generation share also 50 percent?
No. Installed capacity from non-fossil sources is now above 50 percent, but actual generation share remains around 22 to 25 percent because solar and wind have lower capacity factors than coal. Closing this gap requires storage, grid flexibility, and demand-side management.
Tell Google you want more of this.
Add Anantam IAS as a preferred sourceOne tap, and this site shows up more often in your own Top Stories, AI Overviews and AI Mode. Remove it any time.