

Why in News?
The World Meteorological Organization reported on 9 November that Earth’s energy imbalance had reached its highest level since monitoring began, in an interim climate assessment released at Antalya.
- The January–September 2026 global average surface temperature was about 1.47°C above the pre-industrial average.
- The ocean absorbs about 90% of the excess heat that accumulates in the Earth system.
- WMO expects El Niño to lift surface temperatures further. Its assessment of the full year’s ocean warmth remains provisional.
- A surface thermometer samples a thin layer of the climate system. Ocean measurements reveal warming beneath that layer.
- The same year can bring net planetary heating and a transfer of previously stored heat from the ocean to the atmosphere.
UPSC Relevance
Prelims Relevance
- Absorbed solar radiation and outgoing infrared radiation
- Positive energy imbalance at the top of the atmosphere
- Ocean heat content and sea-surface temperature
- El Niño and tropical Pacific ocean-atmosphere exchange
Mains Relevance
GS Paper 3
- Explain how heat storage can delay the surface expression of warming.
- Assess why ocean observations matter for coastal adaptation.
Background and Context
How Earth Gains Energy
Imagine measuring the energy crossing the top of the atmosphere over the whole planet for a year.
- Some incoming sunlight returns to space after reflection from clouds, ice and other surfaces. Only the absorbed share supplies energy to the Earth system.
- The warmed surface and atmosphere emit infrared radiation. The amount that escapes to space forms the outgoing side of the energy budget. Both sides must cover the same area and period.
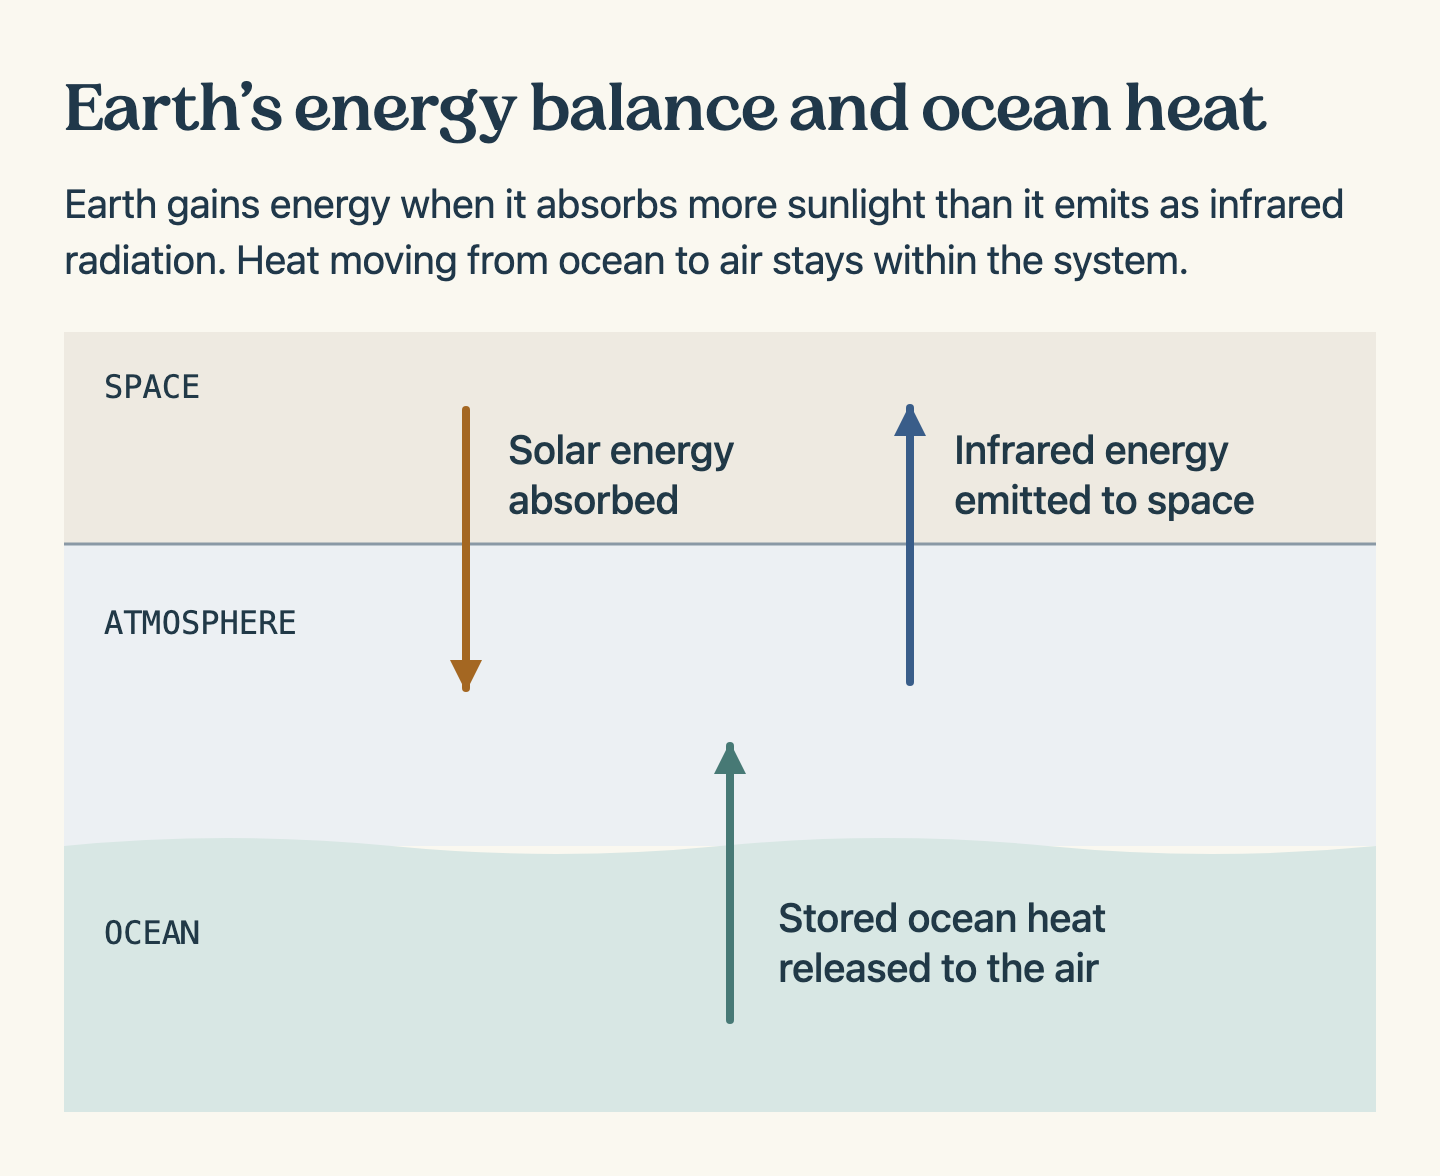
- When absorbed sunlight exceeds outgoing infrared radiation, the positive imbalance supplies energy to the system. A persistent small difference can add substantial heat when summed across the globe over decades.
- At a given temperature, more greenhouse gases impede the escape of infrared energy. As the planet warms it radiates more energy outward, so the size of the imbalance can change over time.
- The distinction is one of units. A scientist can express the imbalance in watts per square metre. Multiplying that rate by area and time gives a quantity of energy in joules.
Where the Excess Heat Goes
The ocean’s depth, circulation and capacity to store heat make it the largest reservoir for the energy accumulating on Earth.
- Water needs considerable energy for a given rise in temperature. A small temperature change across a thick layer of seawater can represent a large addition to the planet’s heat inventory.
- Ocean heat content accounts for the volume of water warmed. Two ocean regions with identical surface readings can hold different amounts of heat if warming penetrates to different depths.
- Wind mixes the upper ocean, while currents carry water and its heat into other regions. To track storage, observers need measurements through the water column across many locations.
- As seawater warms, thermal expansion raises sea level even if the mass of ocean water stays constant. Melting ice on land raises sea level through a separate addition of water.
- Some retained energy also melts ice. During melting, energy changes the physical state of water, so a thermometer alone cannot account for the full change in stored energy.

How El Niño Changes the Surface Reading
El Niño shifts the distribution of warm water in the tropical Pacific and alters the exchange of heat with the atmosphere.
- In a typical El Niño, weaker easterly trade winds allow warm surface water to spread farther east. Reduced upwelling can leave less cold subsurface water at the eastern Pacific surface.
- A larger area of warm surface water can release more heat to the atmosphere. Global mean surface temperature can rise as the ocean gives up some energy it accumulated earlier.
- Follow the boundary in a budget question. Ocean-to-air transfer crosses a boundary inside the climate system. Earth gains energy overall when net radiation crosses its outer boundary inward.
- The January–September average describes a particular interval. Completing the year adds more observations, and assessing long-term warming requires a much longer record than one El Niño-affected year.
- WMO’s December outlook concerns the expected strength of the event. The update includes observations generally through September, so testing that forecast requires observations from the months that follow.
Way Forward
Reading Climate Indicators Together
- Pair surface temperature with ocean heat content when tracking accumulated warming.
- Identify the reference period and months covered before comparing temperature anomalies.
- Use a regional forecast to assess local exposure. The global mean alone cannot specify rainfall at a particular location.
Conclusion
- A planetary energy budget explains why heat accumulates. An inventory of the atmosphere, ocean, land and ice shows where the additional energy has gone.
- Read a warm year alongside both ocean storage and Pacific circulation. The first tracks accumulated heat and the second helps explain when some of it appears in the surface temperature record.
UPSC Practice Questions
Prelims MCQ 1
With reference to Earth’s energy budget, consider the following statements:
- Reflected sunlight contributes to the energy absorbed by Earth.
- A positive energy imbalance can coincide with heat transfer from ocean to atmosphere.
- Warming a deep layer can increase ocean heat content even with little change at the surface.
How many of the above statements are correct?
(a) Only one (b) Only two (c) All three (d) None
Answer: (b) Only two
Explanation:
Statements 2 and 3 are correct. Reflected sunlight returns to space. Internal ocean-to-air heat exchange can occur while the planet gains energy overall.
Prelims MCQ 2
Which observation would best quantify the change in heat stored in an ocean basin?
(a) A series of air temperatures at one coastal station (b) A satellite image of sea-surface color (c) Repeated temperature profiles across the basin and through its depth (d) The date when the trade winds weakened
Answer: (c) Repeated temperature profiles across the basin and through its depth
Explanation:
Temperature changes over the volume of water, together with water density and heat capacity, allow an estimate of the change in stored energy.
UPSC Mains Questions
- Explain how ocean heat content complements global mean surface temperature as an indicator of planetary warming.
- Distinguish the role of greenhouse gases from the role of El Niño in a year of exceptional surface warmth.
Source: World Meteorological Organization.
Frequently Asked Questions
What does a positive Earth energy imbalance mean?
Over the period measured, Earth absorbs more energy from sunlight than it radiates back into space. The difference increases the energy held in the ocean, land, atmosphere and ice.
Why measure heat below the sea surface?
Heat can move downward through mixing and circulation. A depth profile helps estimate how much water has warmed, while a surface reading describes only the water near the top.
Can El Niño warm the atmosphere while Earth is already gaining energy?
Yes. The tropical Pacific can release stored heat to the air while the Earth system as a whole continues to gain energy through its radiative imbalance.
What does the 1.47°C figure cover?
It is the approximate global average surface temperature anomaly for January through September 2026 against a pre-industrial baseline. The full calendar year and the long-term warming level use different averaging periods.
Tell Google you want more of this.
Add Anantam IAS as a preferred sourceOne tap, and this site shows up more often in your own Top Stories, AI Overviews and AI Mode. Remove it any time.