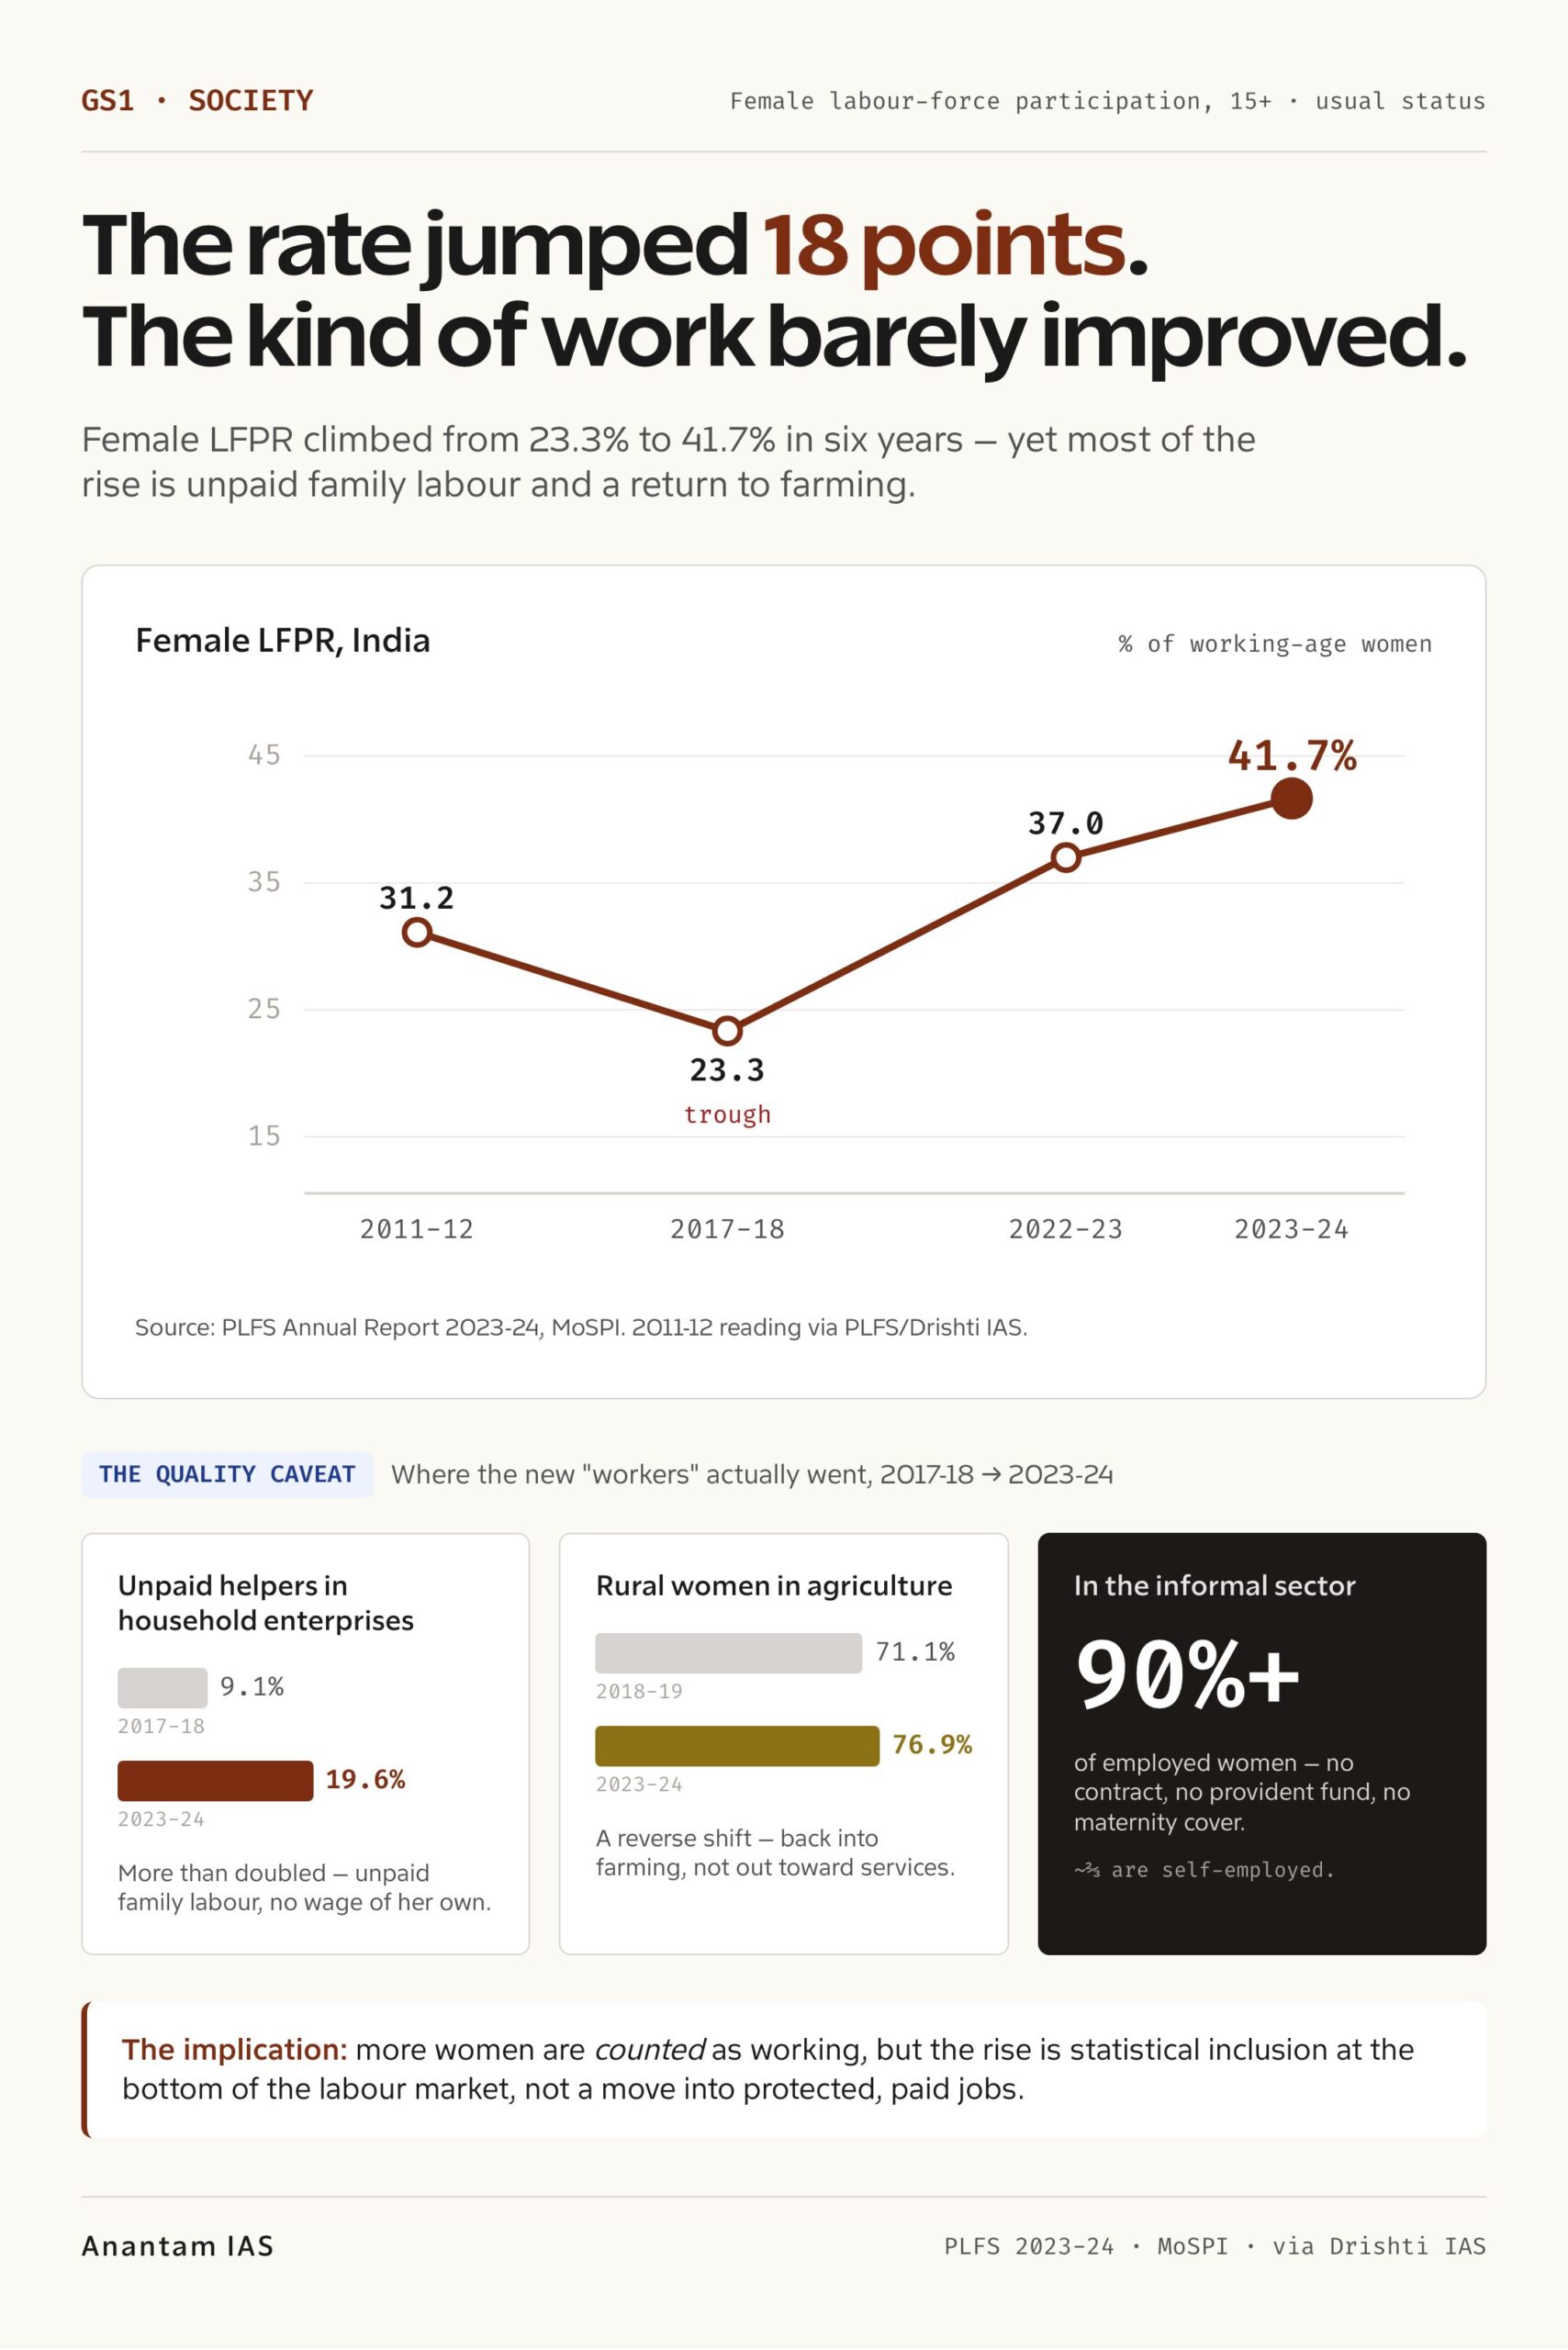
A number this big usually means something changed. India’s female labour-force participation rate jumped from 23.3% in 2017-18 to 41.7% in 2023-24, an 18-point rise in six years, and on paper that reads like the headline every economist has wanted for two decades. So the easy story writes itself: more Indian women are working, the gender gap is closing, the demographic dividend finally has a female half. But the easy story is the wrong story. Because the very same surveys that show more women counted as working also show what kind of work it is, and the picture underneath the line graph is far less flattering than the line itself.
That tension is the whole topic. Participation went up, fast. Yet most of the rise is unpaid family labour, self-employment, and a return to farming, while the load that historically kept women out of paid work, the cooking and cleaning and caring that nobody pays for, has barely shifted. The mark-scoring question for an aspirant isn’t whether the rise is real. It’s whether a rise in counting is the same thing as a rise in opportunity, and what it would take to make the two finally line up.
The Issue, Framed
The argument here isn’t about whether more women are working. The data settles that. The argument is about what “working” means when most of it pays little, carries no protection, and sits on top of a second unpaid shift that never ends.
Let’s fix the vocabulary first, because half the confusion around this topic comes from people using terms loosely. The female labour-force participation rate (FLFPR) is the share of working-age women either employed or actively looking for work. It’s the supply side of the labour market, who’s in the game, not who won. The Periodic Labour Force Survey (PLFS), run by the National Statistical Office, measures it using usual status, which counts a person as a worker if they did any qualifying economic activity for a majority of the year, including subsidiary or part-time work. That definition matters, and we’ll come back to why.
Then there’s the term that decides the whole debate: unpaid care work. It’s the cooking, cleaning, fetching water, and looking after children and elders that households need to function, done mostly by women, and counted in no one’s pay slip. It’s real economic work. It just sits outside the market, so it’s invisible to GDP and, for a long time, invisible to policy.
One more idea you need is the U-shaped curve. Across countries, female participation tends to fall as a poor agrarian economy starts to develop, women leave farm work but haven’t yet moved into salaried jobs, then rises again as education and services expand. India spent two decades on the down-slope. The question now is whether 41.7% is the genuine up-swing, or just a bounce off the bottom.
So the issue isn’t a simple win or a simple failure. It’s a quality problem hiding inside a quantity success. More women are counted. Fewer are counted into good work. And the thing capping the whole transition is the one the headline number never mentions.
What the Data Says
The numbers are where you slow down, because the same dataset tells two stories and you need both. Start with the headline, then read the fine print.
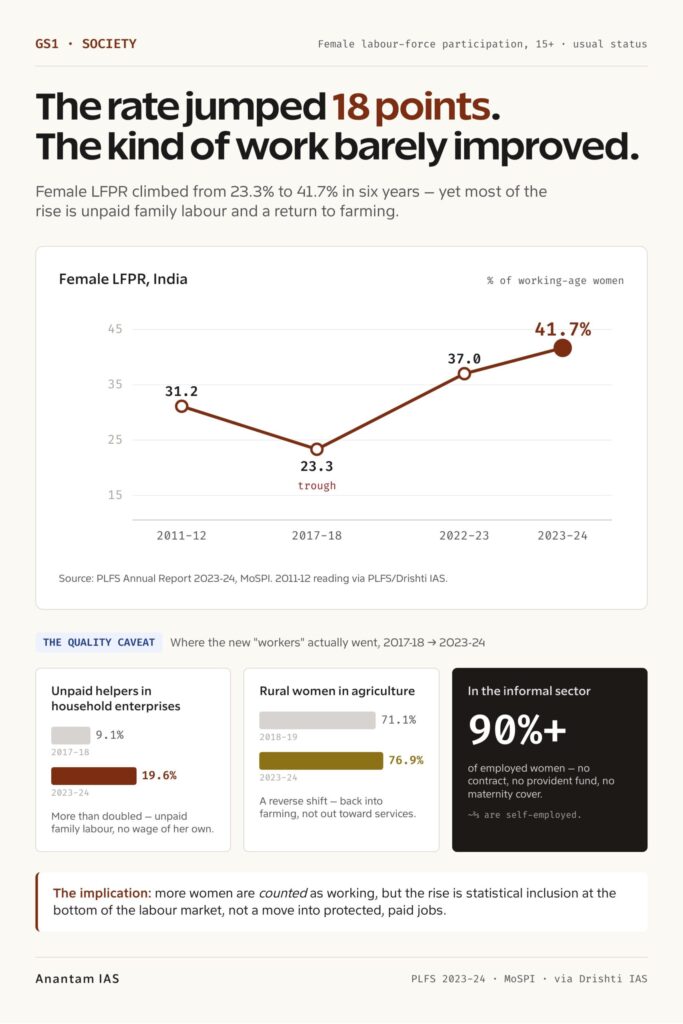
The rise is real and large. Female LFPR (15+, usual status) climbed from 23.3% in 2017-18 to 37.0% in 2022-23 to 41.7% in 2023-24. The worker-population ratio, the share actually employed rather than just looking, moved with it, from 35.9% to 40.3% in a single year. So this isn’t only more women job-hunting. More women are recorded as working. That’s a genuine signal, not a mirage.
Now the composition, which is where the story turns. Over 2017-18 to 2023-24, the share of women reporting “domestic duties” and out of the workforce fell from 57.8% to 35.7%. Good. But where did they go? Women classified as “helpers in household enterprises”, unpaid family labour, more than doubled from 9.1% to 19.6%. And rural women’s engagement in agriculture rose from 71.1% in 2018-19 to 76.9% in 2023-24, which is a reverse structural shift, women moving back into farming rather than out of it toward services. Around two-thirds of working women were self-employed in 2023-24, and over 90% of employed women work in the informal sector, meaning no contract, no provident fund, no maternity cover.
Then there’s pay, and it isn’t close. Self-employed men earn roughly 2.8 times what self-employed women earn; even among regular salaried workers, women take home about 76% of male pay. So the women entering the count are entering at the bottom of it.
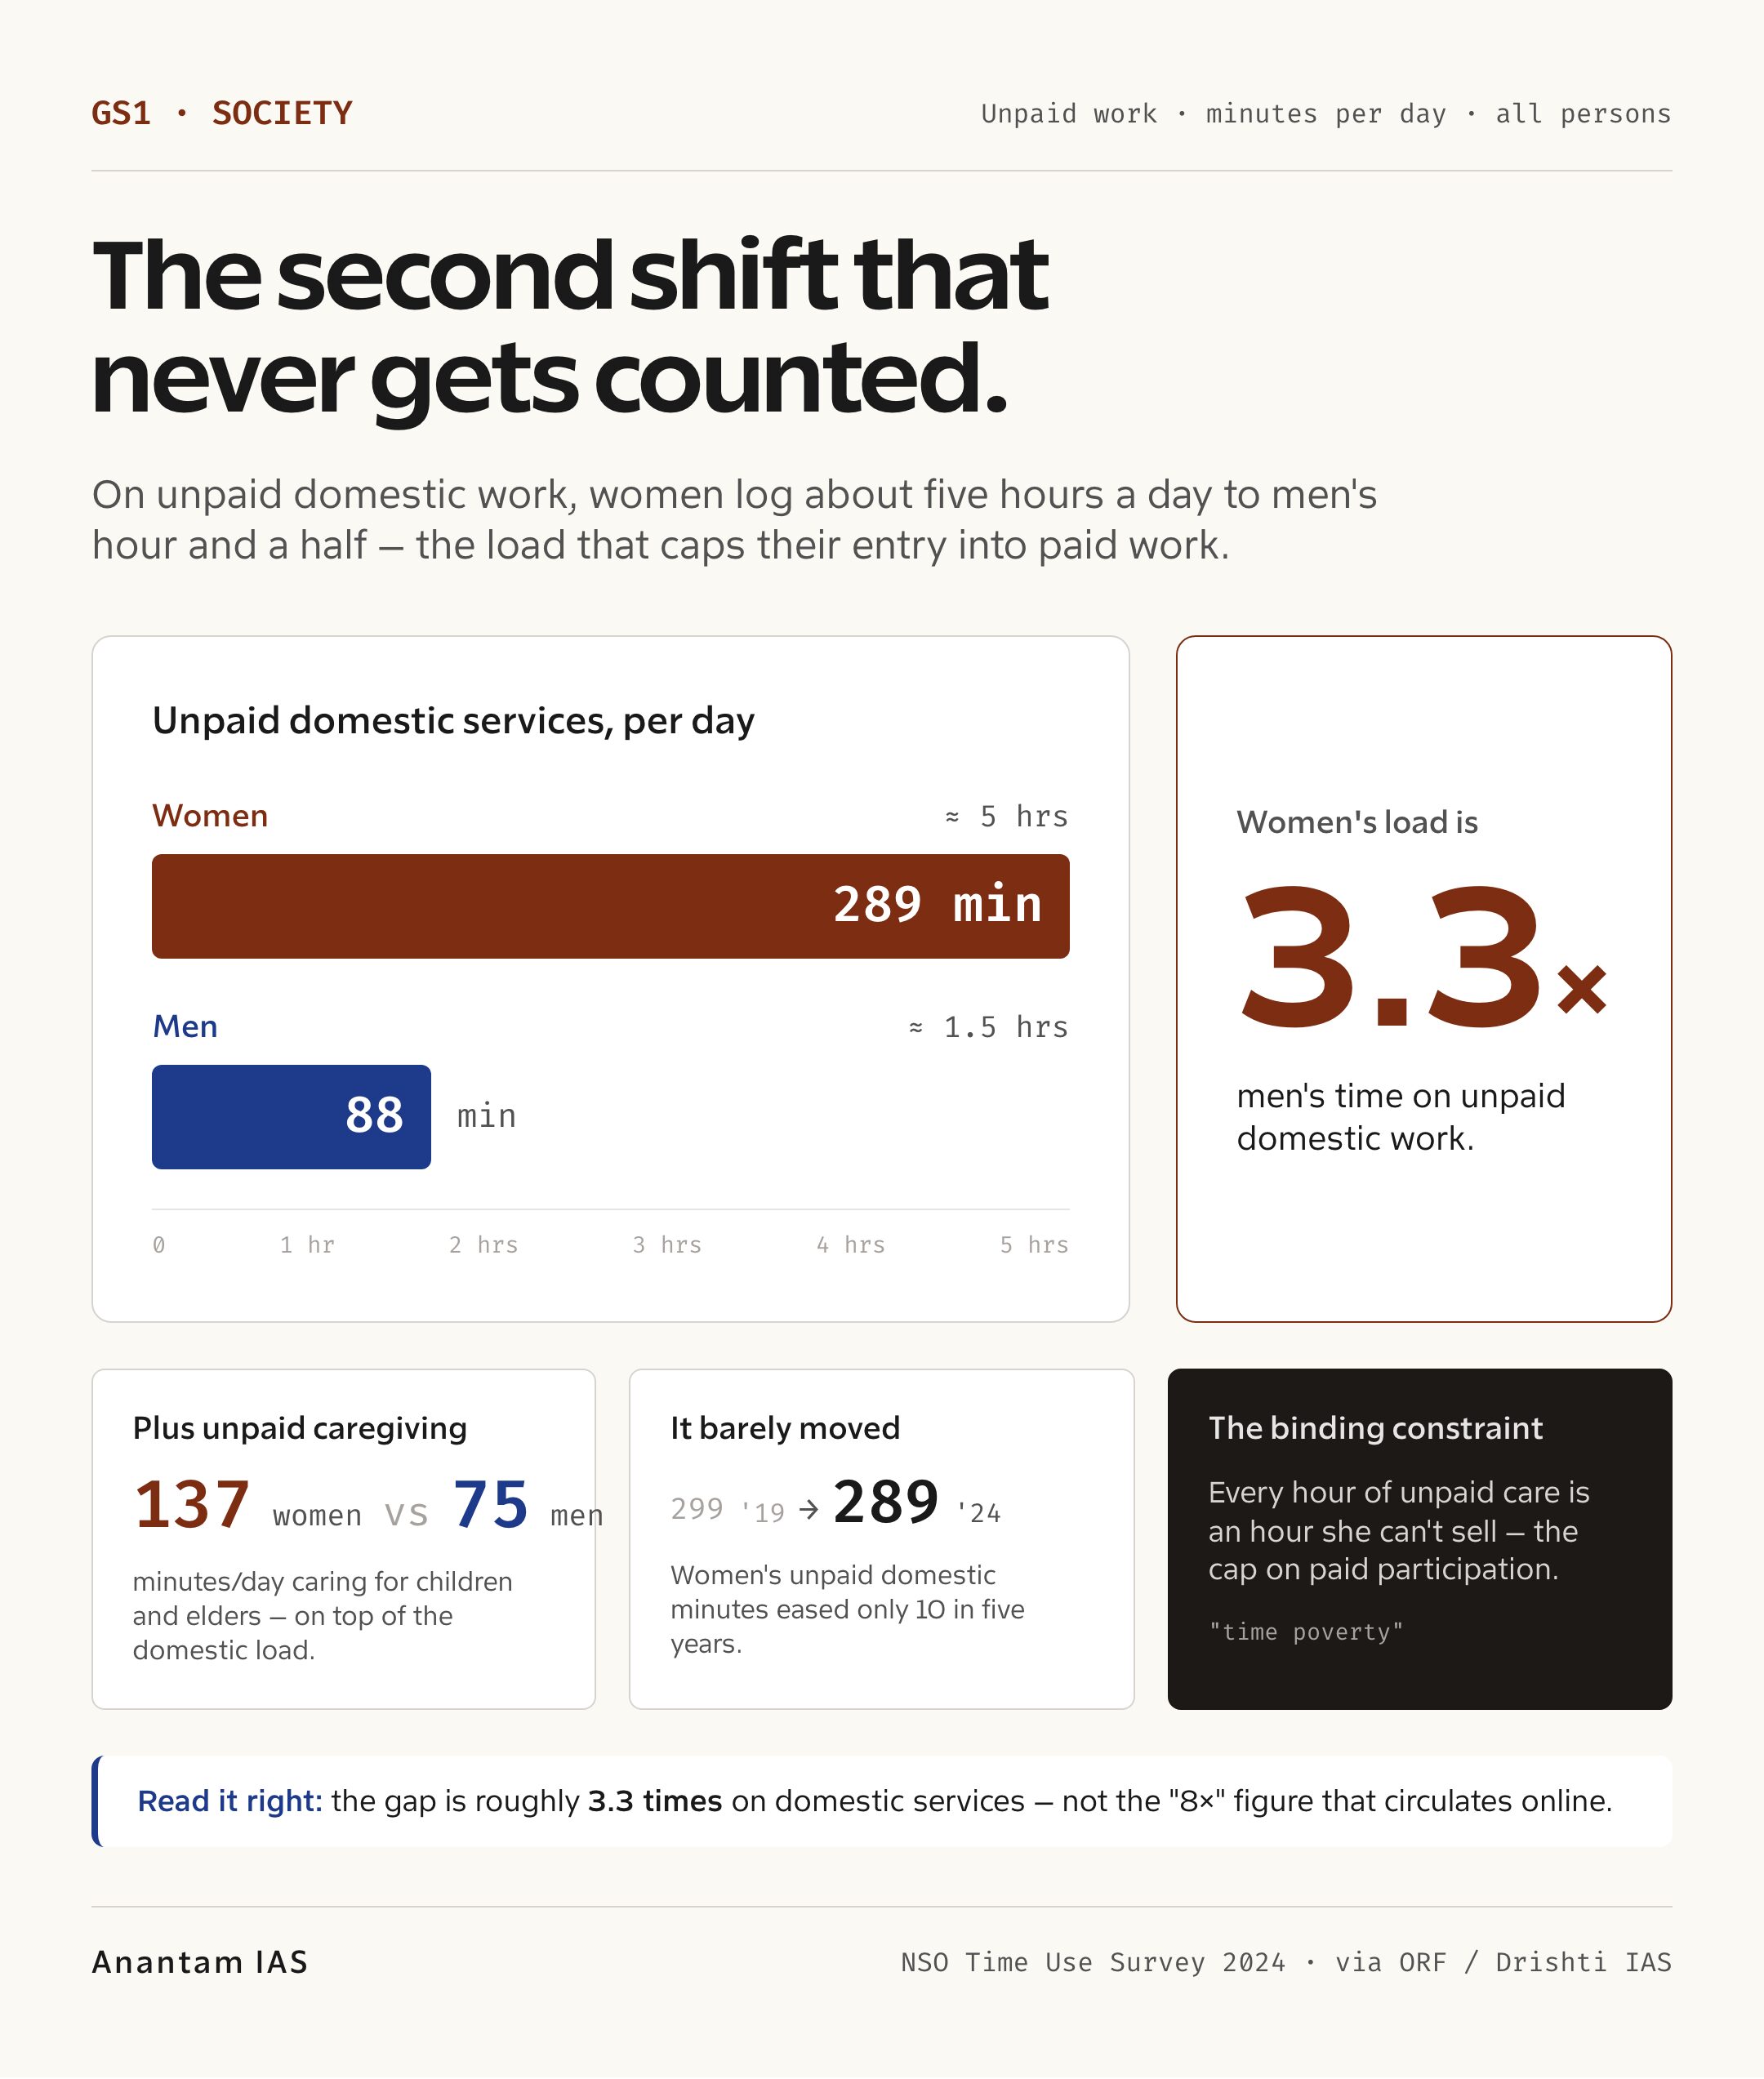
And the constraint behind all of it shows up in a different survey entirely. The NSO’s Time Use Survey 2024 found women spend 289 minutes a day, nearly five hours, on unpaid domestic services, against men’s 88 minutes, about an hour and a half. That’s more than three times the load, on top of another 137 minutes of caregiving for women versus 75 for men. And it barely moved from 2019, when women logged 299 minutes. So the second shift didn’t shrink while paid participation rose. The two are running on different clocks.
One last anchor, to keep the picture honest. The World Bank’s modelled estimate puts India’s female participation at about 32.8% in 2024, well below PLFS’s 41.7%. They measure different things over different reference periods, so don’t treat that as a contradiction. Treat it as a warning that the headline number is sensitive to how you count.
The Case For
The case that this rise is real progress is strong, and a lazy answer that waves it away will lose marks. So state it at full strength.
The magnitude alone is hard to dismiss. An 18-point gain in six years is one of the fastest sustained increases India has ever recorded, and because the worker-population ratio rose alongside it, 35.9% to 40.3%, this is employment, not just a surge of job-seekers who found nothing. When the share of women doing actual recorded work jumps that fast, something structural is moving, not just a survey quirk.
Rural women are entering the economic count, often for the first time. The DAY-NRLM mission has mobilised roughly 10 crore rural women into about 90 lakh self-help groups, and around 2 crore are now “Lakhpati Didis” with annual household incomes above one lakh rupees. That’s credit, income, and a recognised economic identity reaching women who had none of the three a decade ago. So part of the rise reflects a genuine expansion of choice, not only distress.
Some of the new work is real enterprise. The share of women as own-account workers and employers rose from 4.5% to 14.6%. Not all of that is survival-mode family labour. A meaningful slice is women running micro-enterprises, the kind of self-employment that builds assets rather than just absorbing shocks.
And here’s a subtler point worth making. Part of the “rise” is better counting. PLFS captures subsidiary-status and helper activity more carefully than older surveys did, so work women always performed is finally showing up in the statistics. Counting invisible work is itself a form of recognition, and recognition is the first step in any serious care-economy reform. India also leads the BRICS group on the pace of its female-participation increase over the last decade. So the achievement is real. The question is what it’s made of.
The Case Against
Here’s what the progress story walks past. A participation rate measures how many women are working. It says nothing about whether the work pays, protects, or expands their lives. On those tests, the rise has serious holes.
Most of the new work is low-paid or unpaid. The biggest single jump was in “helpers in household enterprises”, unpaid family labour, from 9.1% to 19.6%. A woman recorded as a worker because she helps in the family shop or on the family plot, for no wage of her own, is counted as participating. She isn’t earning. So a chunk of the headline rise is statistical inclusion without economic gain.
The pay gap confirms the quality problem. Self-employed women earn about one-third of what self-employed men earn, and salaried women about 76% of male pay. Add that over 90% of employed women are informal, with no social security, and the picture is of women entering work that is poorly paid and wholly unprotected.
The direction of movement is wrong, too. The expected path of development runs from farm to factory to services. Indian rural women went the other way, into agriculture, 71.1% to 76.9%. Economists call work that gets shared out among family members on a plot that doesn’t actually need them disguised unemployment, and a reverse shift into farming is a classic distress signal, not a sign of a tightening, opportunity-rich labour market.
There’s a counting caveat as well. Part of the climb is recovery from a historic low. India’s female participation was around 31.2% in 2011-12, fell to the 23.3% trough in 2017-18, and has since risen to 41.7%. So on the U-shaped curve, the country is partly climbing back to where it once stood, not only breaking new ground. That doesn’t erase the gain. It does deflate the triumphalism.
And the binding constraint sits under everything: unpaid care. Until the 289-versus-88-minute gap in domestic work narrows, women’s entry into paid work stays capped and fragile, because the second shift never clears. Several analysts read the whole surge as resilience rather than empowerment, women taking on low-paid family and farm work to cope with household stress, not because new choices opened up. That reading is contested, and you should attribute it rather than assert it. But it’s on the table for a reason.
The Deeper Structural Read
Step back from the survey tables and the real fault line shows up. The problem isn’t that women won’t work. It’s that the economy treats one half of the work they already do as if it doesn’t exist, and then wonders why the other half stays small and fragile.
Start with the household as an economic unit, because that’s where the constraint lives. Every hour a woman spends fetching water, cooking, or minding a child is an hour she can’t sell in the labour market. Economists call this time poverty, and the Time Use Survey 2024 measures it precisely: nearly five hours a day for women against an hour and a half for men. Estimates value women’s unpaid domestic work at roughly 15 to 17% of India’s GDP, present that as an estimate, not official accounting, but the order of magnitude tells the story. A sixth of the economy runs on labour the economy refuses to count.
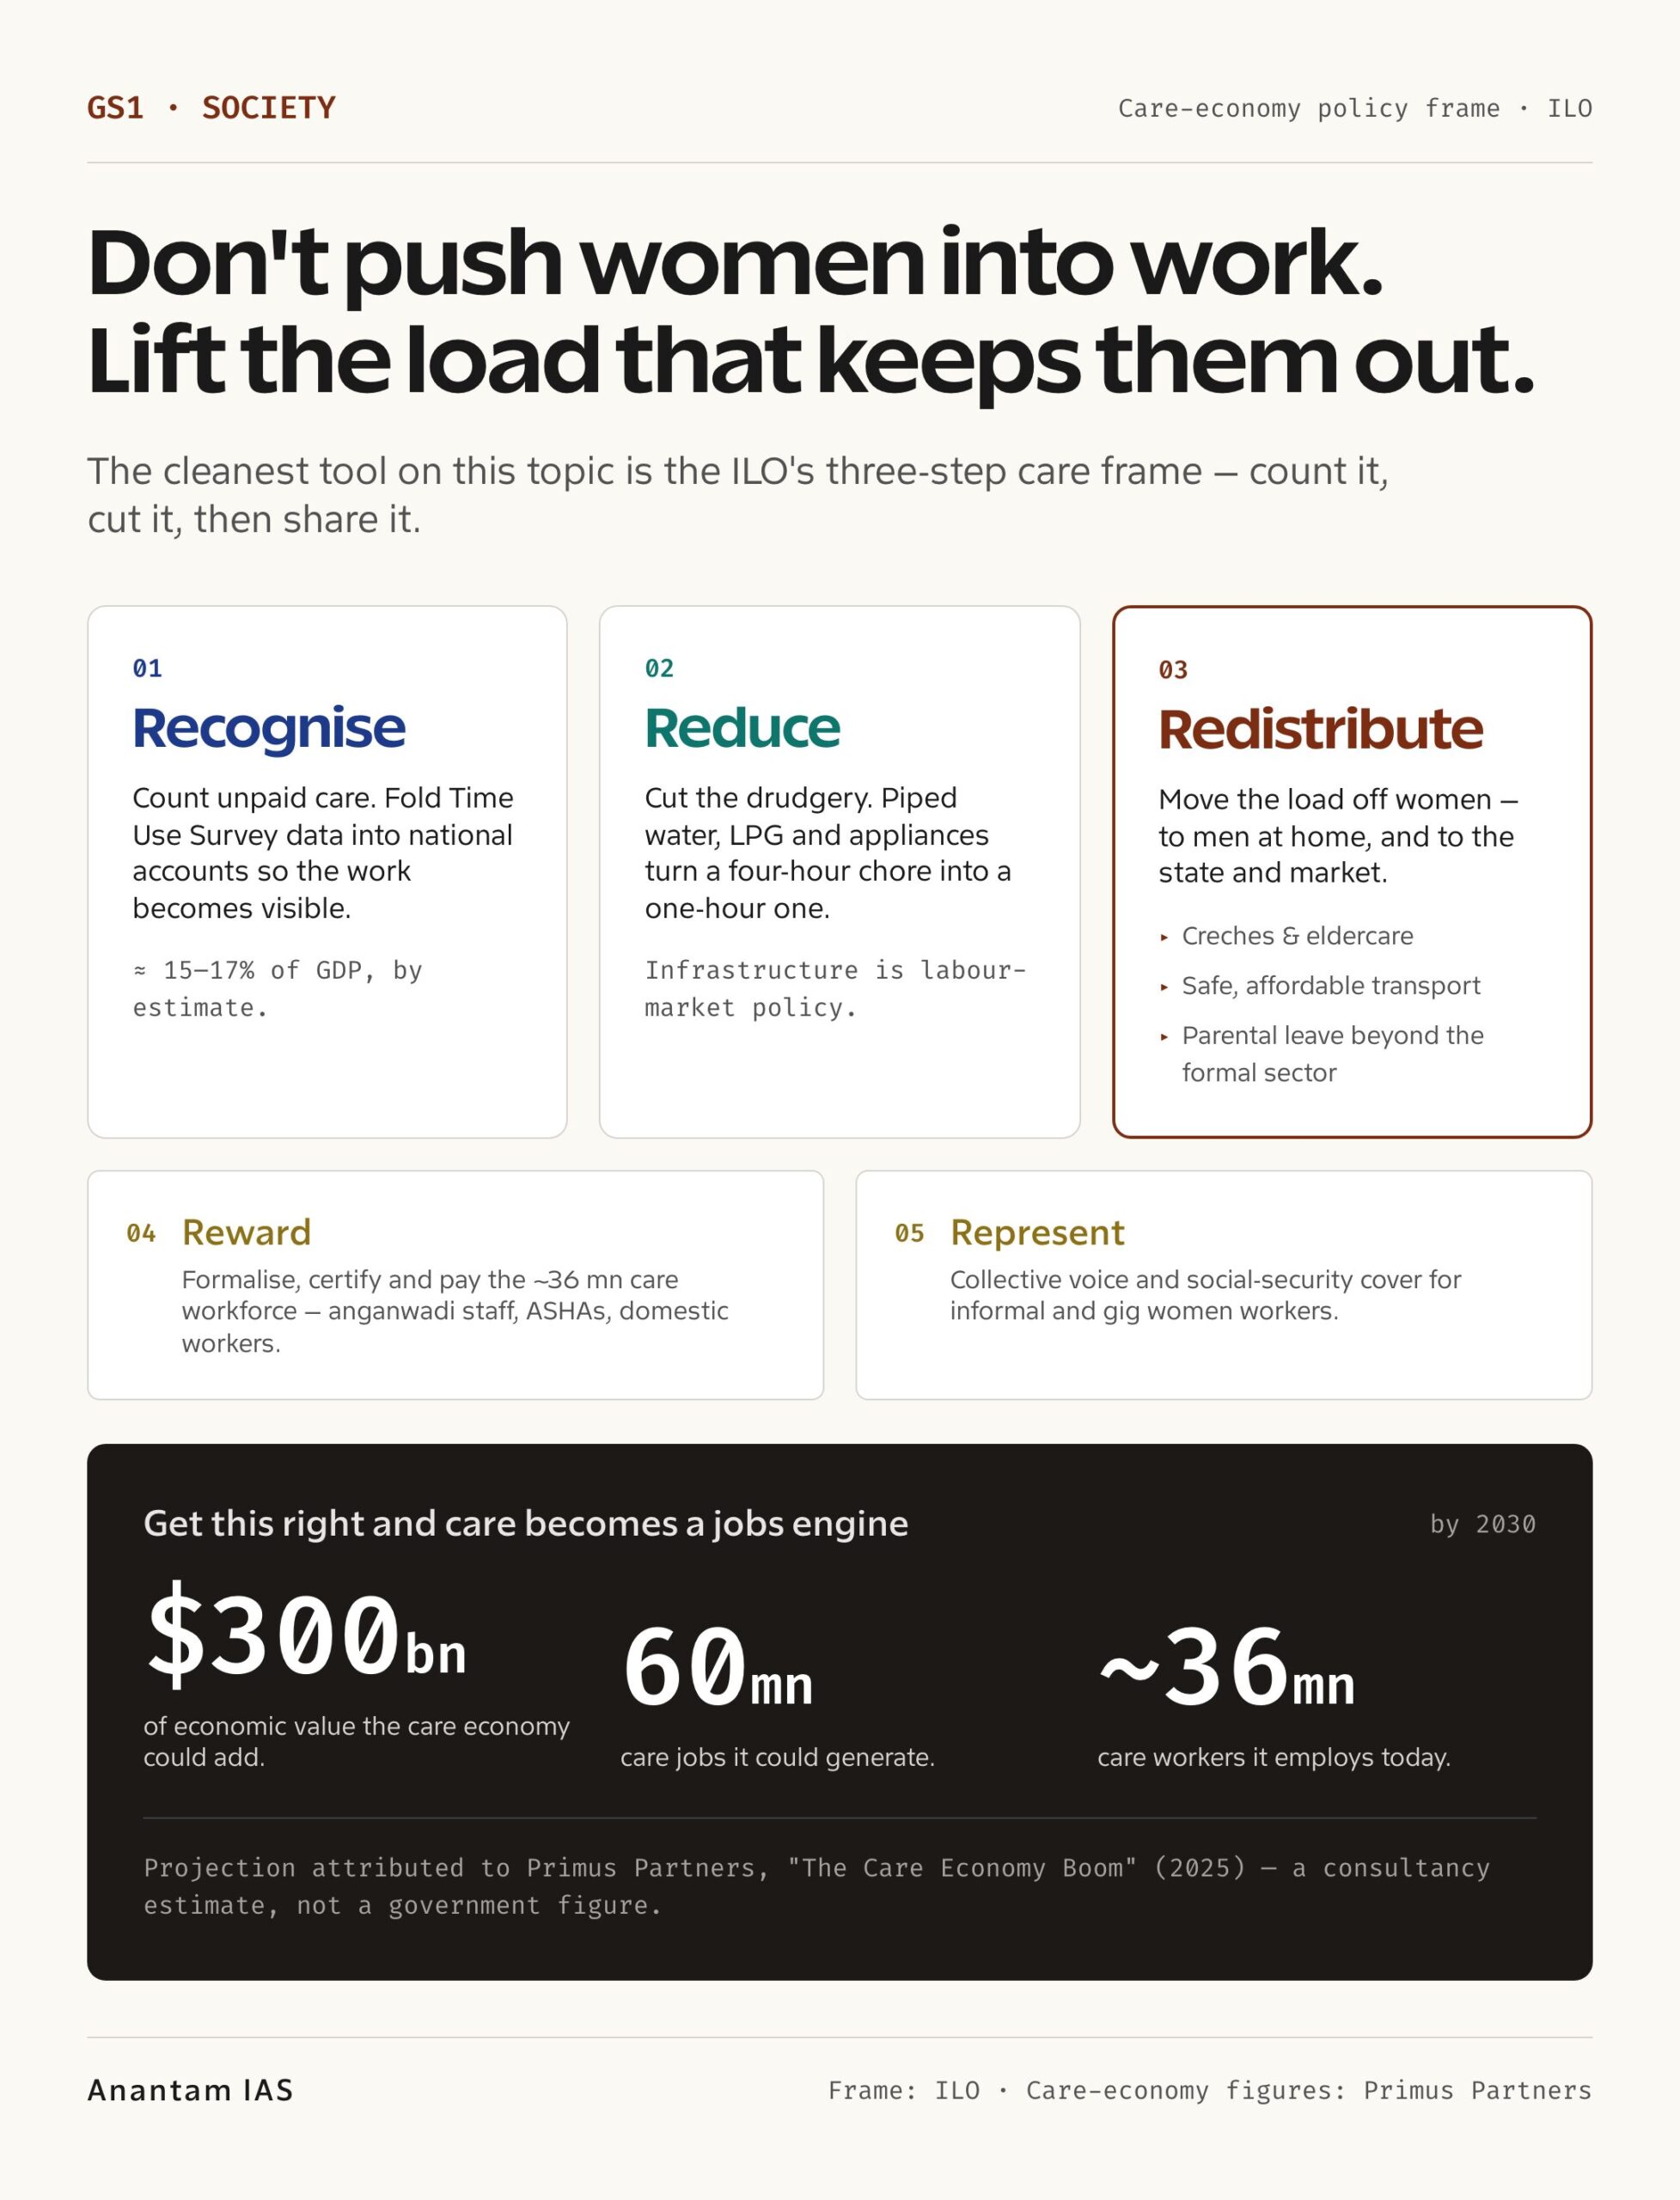
This is where the recognise-reduce-redistribute idea earns its place. It comes from the ILO’s framework for care work, and it’s the cleanest analytical tool you can bring to this topic. Recognise means counting unpaid care, getting time-use data into national accounts so the work becomes visible. Reduce means cutting the sheer drudgery, piped water, LPG, and household appliances that turn a four-hour chore into a one-hour one. Redistribute means moving the load off women’s shoulders, partly to men inside the household, partly to the state and market through creches and eldercare. Get those three right and the constraint loosens. Ignore them and no scheme can push paid participation much higher, because the day only has so many hours.
There’s a structural-transformation layer underneath. The textbook path moves workers from low-productivity farming into higher-productivity manufacturing and services. India’s male workforce has partly made that move. Its rural women, the data shows, moved the wrong way, deeper into agriculture. So the female half of the labour force isn’t just lagging the male half. It’s travelling in the opposite direction, which means the demographic dividend is leaking from one side.
And here’s the part that should bother a future administrator most. The policy reflex has been to “bring women into the workforce” through livelihood schemes, which is necessary but treats the symptom. The disease is that care is unpriced, unshared, and unsupported. So a scheme can hand a woman a loan and a self-help group, and she’ll still hit the same wall at 6 a.m. when the cooking and the caring fall to her alone. Fix the count, the drudgery, and the sharing, and you don’t need to push women into work. They walk in on their own.
What Should Be Done
So what would actually move quality, not just the headline? Not a vague call for “empowerment,” but a set of measures you could brief a finance secretary on tomorrow. Seven, built around recognise-reduce-redistribute and the two R’s that follow it, reward and represent.
- Build care as infrastructure, not welfare. Treat affordable creches and eldercare the way you treat roads and power, as public investment that raises the economy’s capacity. The care economy could add around $300 billion and over 60 million jobs by 2030, on the Primus Partners estimate, attribute it as a consultancy projection, not a government figure, but the logic holds: spending on care creates jobs and frees women’s hours at the same time.
- Recognise unpaid work in the national accounts. Fold the Time Use Survey into satellite accounts so unpaid care shows up in official statistics. You can’t manage what you don’t measure, and a sixth of GDP is too big to keep off the books.
- Reduce the drudgery with basic infrastructure. Piped water, LPG, and electricity aren’t women’s-welfare line items. They’re labour-market policy, because every hour cut from fetching and cooking is an hour available for paid work. The fastest route to higher participation may run through the water tap, not the job scheme.
- Fix the maternity and creche gap. The Maternity Benefit (Amendment) Act, 2017 gave 26 weeks of paid leave and mandated creches at workplaces with 50-plus employees. But it covers the formal sector, which employs a sliver of working women, so for the 90% in informal work the benefit is theoretical. And the 50-employee creche threshold quietly nudges some firms to avoid hiring women at all. Extend protection beyond the formal sector, and consider shared, state-funded creches so the cost doesn’t sit on the employer who hires women.
- Reward the care workforce. India already employs roughly 36 million care workers, anganwadi staff, ASHAs, domestic workers, who are underpaid and largely informal. Formalise, certify, and pay them properly. Care can’t be the sector that lifts other women into work while keeping its own workers poor.
- Convert distress self-employment into decent jobs. A real manufacturing and services pull, plus wage-parity enforcement under the Code on Wages, is what turns an unpaid helper into a salaried worker. Schemes get women to the door. Decent jobs are what’s on the other side of it.
- Extend social security to gig and informal women. Women are estimated to make up around 28% of India’s gig workforce, treat that as an industry estimate, not clean official data, and almost all of them work without protection. Registration and benefits under the Code on Social Security, 2020 are the floor, not the ceiling.
Every one of these attacks quality, not just quantity. A participation rate that rises because care got recognised, reduced, and redistributed is a rate that means something. One that rises because more women were pushed into unpaid family labour is just a bigger number on a worse problem.
For Your Mains Answer
This is a GS1-GS3 crossover that examiners love, because it lets you move from society to economy in one frame and show you can read a dataset critically rather than quote it blindly.
GS paper mapping: GS1: role of women, social empowerment, the household as a site of unpaid labour, effects of development on women. GS3: inclusive growth and employment, the informal sector, agriculture and disguised unemployment, the care economy as a jobs lever.
Likely question frames:
- India’s female labour-force participation rose sharply between 2017-18 and 2023-24, yet the quality of women’s work did not improve in step. Critically examine, with reference to recent PLFS and Time Use Survey data.
- “Unpaid care work is the binding constraint on women’s economic participation in India.” Discuss, and suggest a policy framework to address it.
- A rising female participation rate need not mean rising economic empowerment. Analyse with reference to the composition of women’s employment in India.
Quotable data points:
- Female LFPR rose from 23.3% (2017-18) to 41.7% (2023-24), an 18-point gain in six years.
- Yet female LFPR (41.7%) is still roughly half the male rate (78.8%).
- “Helpers in household enterprises”, unpaid family labour, more than doubled, 9.1% to 19.6%.
- Rural women in agriculture rose from 71.1% (2018-19) to 76.9% (2023-24), a reverse structural shift.
- Over 90% of employed women are in the informal sector.
- Women spend 289 minutes a day on unpaid domestic work versus men’s 88, more than three times the load.
- Women’s unpaid work is valued at an estimated 15 to 17% of GDP.
- India’s care economy could add $300 billion and over 60 million jobs by 2030.
- World Bank’s modelled estimate puts female participation at about 32.8% in 2024, below PLFS, a definitional divergence.
Keywords to use: FLFPR, usual status, worker-population ratio, U-shaped curve, unpaid care work, time poverty, disguised unemployment, feminisation of agriculture, informality, care economy, recognise-reduce-redistribute.
Syllabus linkages: Role of women and women’s organisations; social empowerment; inclusive growth; employment and the informal sector; agriculture and disguised unemployment; government schemes for livelihoods; structural transformation.
Balanced conclusion line: A participation rate that climbs because more women were counted into unpaid, low-paid, and unprotected work is a statistic, not an achievement; the real test is whether India recognises, reduces, and redistributes the care burden so that entering the workforce becomes a choice with rewards, not a coping response without them.
How to Build the Answer
Open with the tension, not the definition. The strongest first line names the paradox: participation rose sharply while quality stalled, and the headline number hides the difference. That single sentence shows the examiner you can read a statistic critically. A definition of FLFPR can follow in the second sentence, never the first.
Bring data in early, but ration it. A strong opening body paragraph can carry three figures: 23.3% to 41.7% on participation, the doubling of unpaid helpers to 19.6%, and the 289-versus-88-minute care gap. Then say what they prove together, that the rise is real but its content is poor. UPSC rewards the move from fact to inference, so the “this means…” matters more than the number.
The next paragraph should steelman the optimistic view. If your stance is that the rise is quality-poor, first grant why it’s genuine progress, the magnitude, the SHG mobilisation, the rise in own-account work. Concede the strong version of the other side, then show why it’s not enough. That’s how an answer reads balanced without going vague.
Group the way forward, don’t scatter it. Cluster the reforms under recognise-reduce-redistribute, then reward and represent. Using the topic’s own vocabulary, time poverty, disguised unemployment, feminisation of agriculture, makes the answer read like analysis rather than a news recap.
Close on the syllabus link and on judgment, not summary. The last line should not echo the introduction. The reliable pattern here is “not X alone, but X with Y”, participation with quality, work with care support, which lets you land a balanced, decisive close.
Common Mistakes to Avoid
- Don’t celebrate the headline number uncritically. 41.7% looks like a triumph until you read the composition. An answer that quotes the rise without the quality caveat misses the entire point.
- Don’t treat unpaid care as a side issue. It’s the binding constraint, not a soft “women also face challenges” line. Build the answer around it.
- Don’t confuse counting with empowerment. Better measurement of subsidiary work explains part of the rise. Say so, rather than reading every percentage point as new opportunity.
- Don’t print the wrong multiple. The unpaid-work gap is roughly three times (289 vs 88 minutes), not eight. A wrong number undercuts an otherwise sharp answer.
- Don’t forget who bears the cost. Name the rural woman moving back into farming, the unpaid helper in the family shop, the care worker who lifts others into jobs while staying poor herself. UPSC rewards policy that names who’s at risk.
A Compact Answer Spine
- Introduction: Open with the rise-versus-quality paradox in one sentence; define FLFPR and usual status in the next.
- Evidence: Use three attributed figures, the participation rise, the composition shift, and the care-time gap, and tie each to an implication.
- Arguments: The case that the rise is progress, then the case that it’s quality-poor and care-constrained. Keep both fair.
- Structural diagnosis: Time poverty and the unpriced care burden as the binding constraint; the reverse structural shift into agriculture.
- Way forward: Group reforms under recognise-reduce-redistribute, plus reward care workers and represent informal women, each with a clear actor.
- Conclusion: Adapt the balanced conclusion line to the exact question wording.
Diagram or Flowchart Idea
For a 15-marker, draw one causal chain, not a decorative mind map. The cleanest here: unpaid care burden (289 min/day) → time poverty → women limited to flexible, low-paid, family/farm work → participation rises in count but not quality → reforms (recognise, reduce, redistribute) loosen the constraint. The examiner reads that logic in five seconds.
For a 10-marker, skip the diagram and use a two-column table instead, “The rise (quantity)” against “The reality (quality)”, with the matching figures in each column. It does more work and is faster to evaluate under time pressure.
Ethics and Governance Angle
Add one ethical line even in a data-heavy answer. The deepest issue here isn’t efficiency, it’s justice: an economy that runs on five hours a day of unpaid female labour while leaving that labour out of its accounts is making a moral choice, not just a statistical one. Naming that choice sharpens the answer.
Then convert the ethics into design. Don’t merely say “value women’s work”. Say how: bring time-use data into national accounts, fund creches as public infrastructure, pay the care workforce properly. That’s the move from moral language to administrative maturity, and it’s exactly what a governance question rewards.
A sentence pattern that travels across topics: “The aim is legitimate, but its legitimacy depends on whether the burden is shared, the work is counted, and the worker is paid.” It accepts the goal of higher participation without pretending a rising number alone is success.
How to Use Data Without Sounding Mechanical
Use fewer numbers than you know. Three well-explained figures beat ten scattered ones. Lead with one big number (23.3% to 41.7%, the scale of the rise), use a second for contrast (helpers doubling to 19.6%, the quality catch), and a third to expose the constraint (289 vs 88 minutes of unpaid work). One headline, one contrast, one constraint is usually enough.
Never leave a statistic standing alone. Follow it with “This means…” or “The implication is…”. That small move turns a fact sheet into analysis. In Mains, facts are raw material; judgment is the finished answer.
Attribute contested and consultancy figures cleanly. Say “on the Primus Partners estimate” or “the World Bank’s modelled figure”, and flag the unpaid-work GDP share as an estimate. Examiners trust an answer that knows the difference between an official statistic and a projection.
One last sweep: cut any line that sounds impressive but does no work, and replace it with a fact, a cause, a consequence, or a reform. That habit separates an answer that feels informed from one that feels memorised. Write for marks, not for noise. Always be specific.
FAQ
Why did India’s female labour-force participation rise so sharply after 2017-18?
Female LFPR rose from 23.3% in 2017-18 to 41.7% in 2023-24 on PLFS data, driven mainly by rural women, more unpaid family labour and self-employment, a return to agriculture, and large self-help-group mobilisation under DAY-NRLM. Better measurement of subsidiary and helper work also surfaced activity women always did, so part of the rise reflects improved counting alongside genuine new entry.
Is the rise in women’s work a sign of empowerment or distress?
It’s contested, and a good answer says so. The optimistic reading points to the scale of the gain, rising own-account enterprise, and SHG-led income. The cautious reading notes that most new work is unpaid family labour, informal, low-paid, and concentrated in agriculture, a reverse structural shift that often signals distress. Attribute both views rather than declaring a winner.
What does the Time Use Survey 2024 show about unpaid care work?
The NSO Time Use Survey 2024 found women spend about 289 minutes a day on unpaid domestic services against men’s 88, more than three times the load, plus 137 minutes of caregiving versus men’s 75. The gap barely changed from 2019. This unpaid burden is widely seen as the binding constraint on women’s entry into paid work.
Why do PLFS and the World Bank report different participation numbers?
PLFS shows female participation at 41.7% in 2023-24, while the World Bank’s modelled ILO-based estimate puts it around 32.8% in 2024. They use different definitions, reference periods, and methods, so the gap is a measurement divergence, not a contradiction. Cite both, name the source, and use the divergence to make the point that the headline number depends heavily on how you count.
Tell Google you want more of this.
Add Anantam IAS as a preferred sourceOne tap, and this site shows up more often in your own Top Stories, AI Overviews and AI Mode. Remove it any time.