The rank of indian economy in the world is the headline number every aspirant gets asked at interview, every newspaper celebrates on Republic Day, and every coaching note gets slightly wrong. Here’s the uncomfortable truth in April 2026: India is not the 4th, not the 5th — it’s currently the 6th-largest economy by nominal GDP, having slipped behind Japan and the UK due to rupee depreciation. By PPP, India is 3rd. The story is more nuanced than the WhatsApp forwards make it. This guide walks you through the latest IMF numbers, the nominal-vs-PPP gap, the historical climb from 10th to 6th, and what it actually takes to hit 3rd by 2027-28.
What is the rank of Indian economy in the world in 2026?
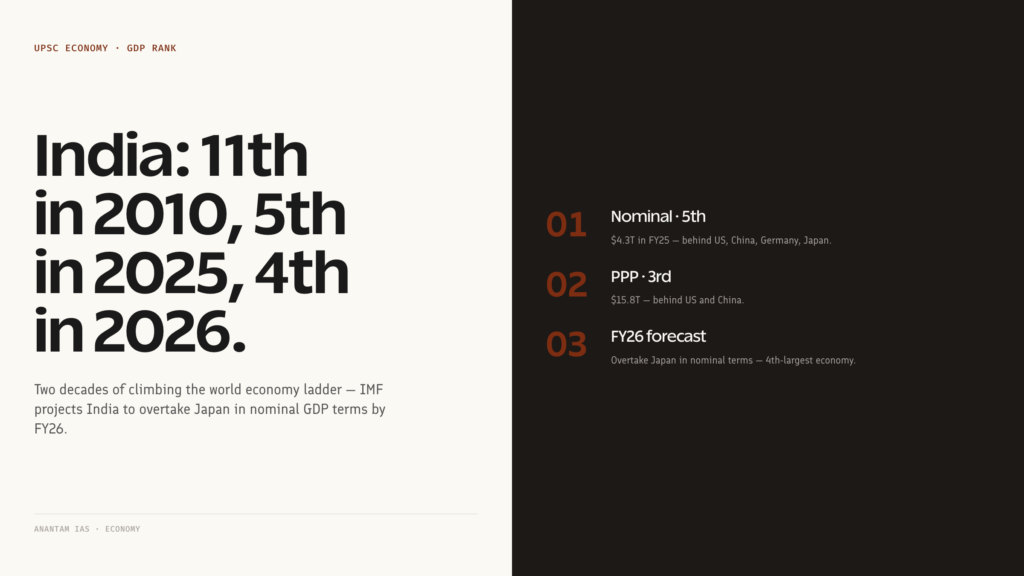
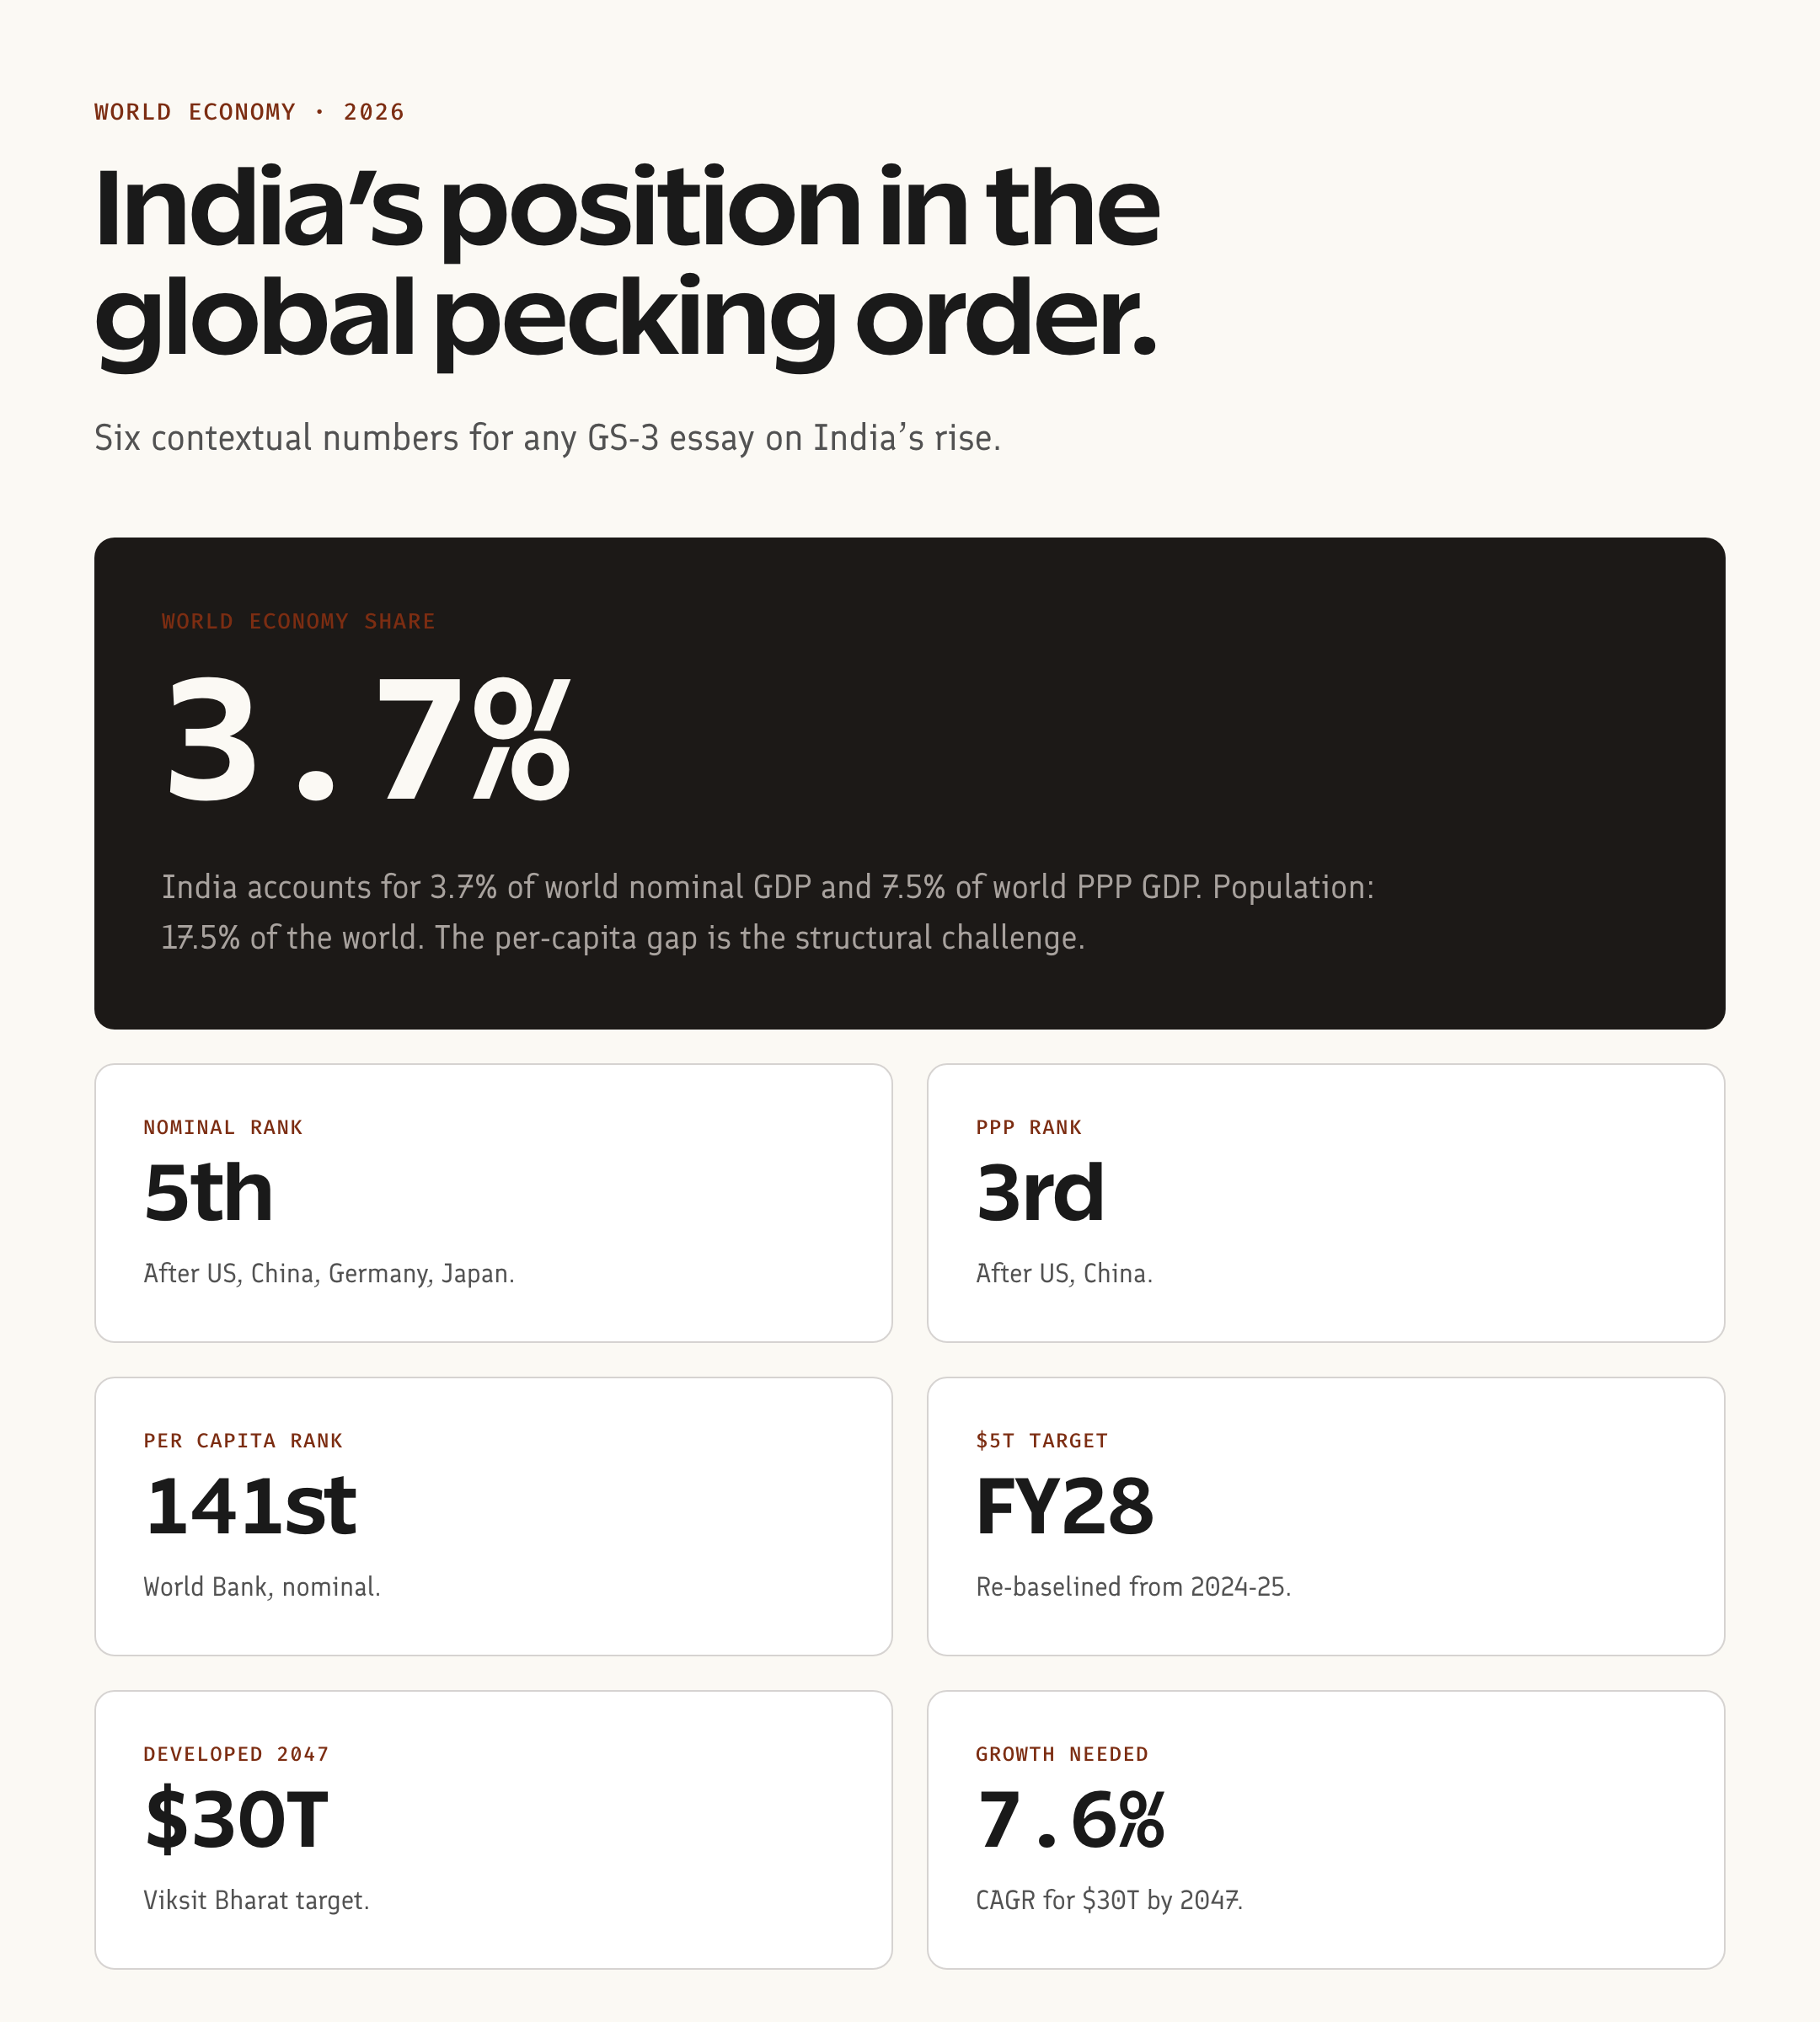
India is the 6th-largest economy by nominal GDP ($4.15 trillion, IMF April 2026 World Economic Outlook) and the 3rd-largest by Purchasing Power Parity (PPP) ($17+ trillion). The top five nominal-GDP economies in 2026 are: United States, China, Germany, Japan, United Kingdom — with India at sixth.
- Nominal GDP rank (2026) — 6th, $4.15 trillion (IMF April 2026)
- PPP GDP rank (2026) — 3rd, behind only China and the US
- Per capita nominal GDP rank — ~140th globally, ~$2,800
- Real GDP growth (FY 2025-26 advance estimate) — 7.4% (MoSPI)
Wait — wasn’t India the 4th-largest in 2025?
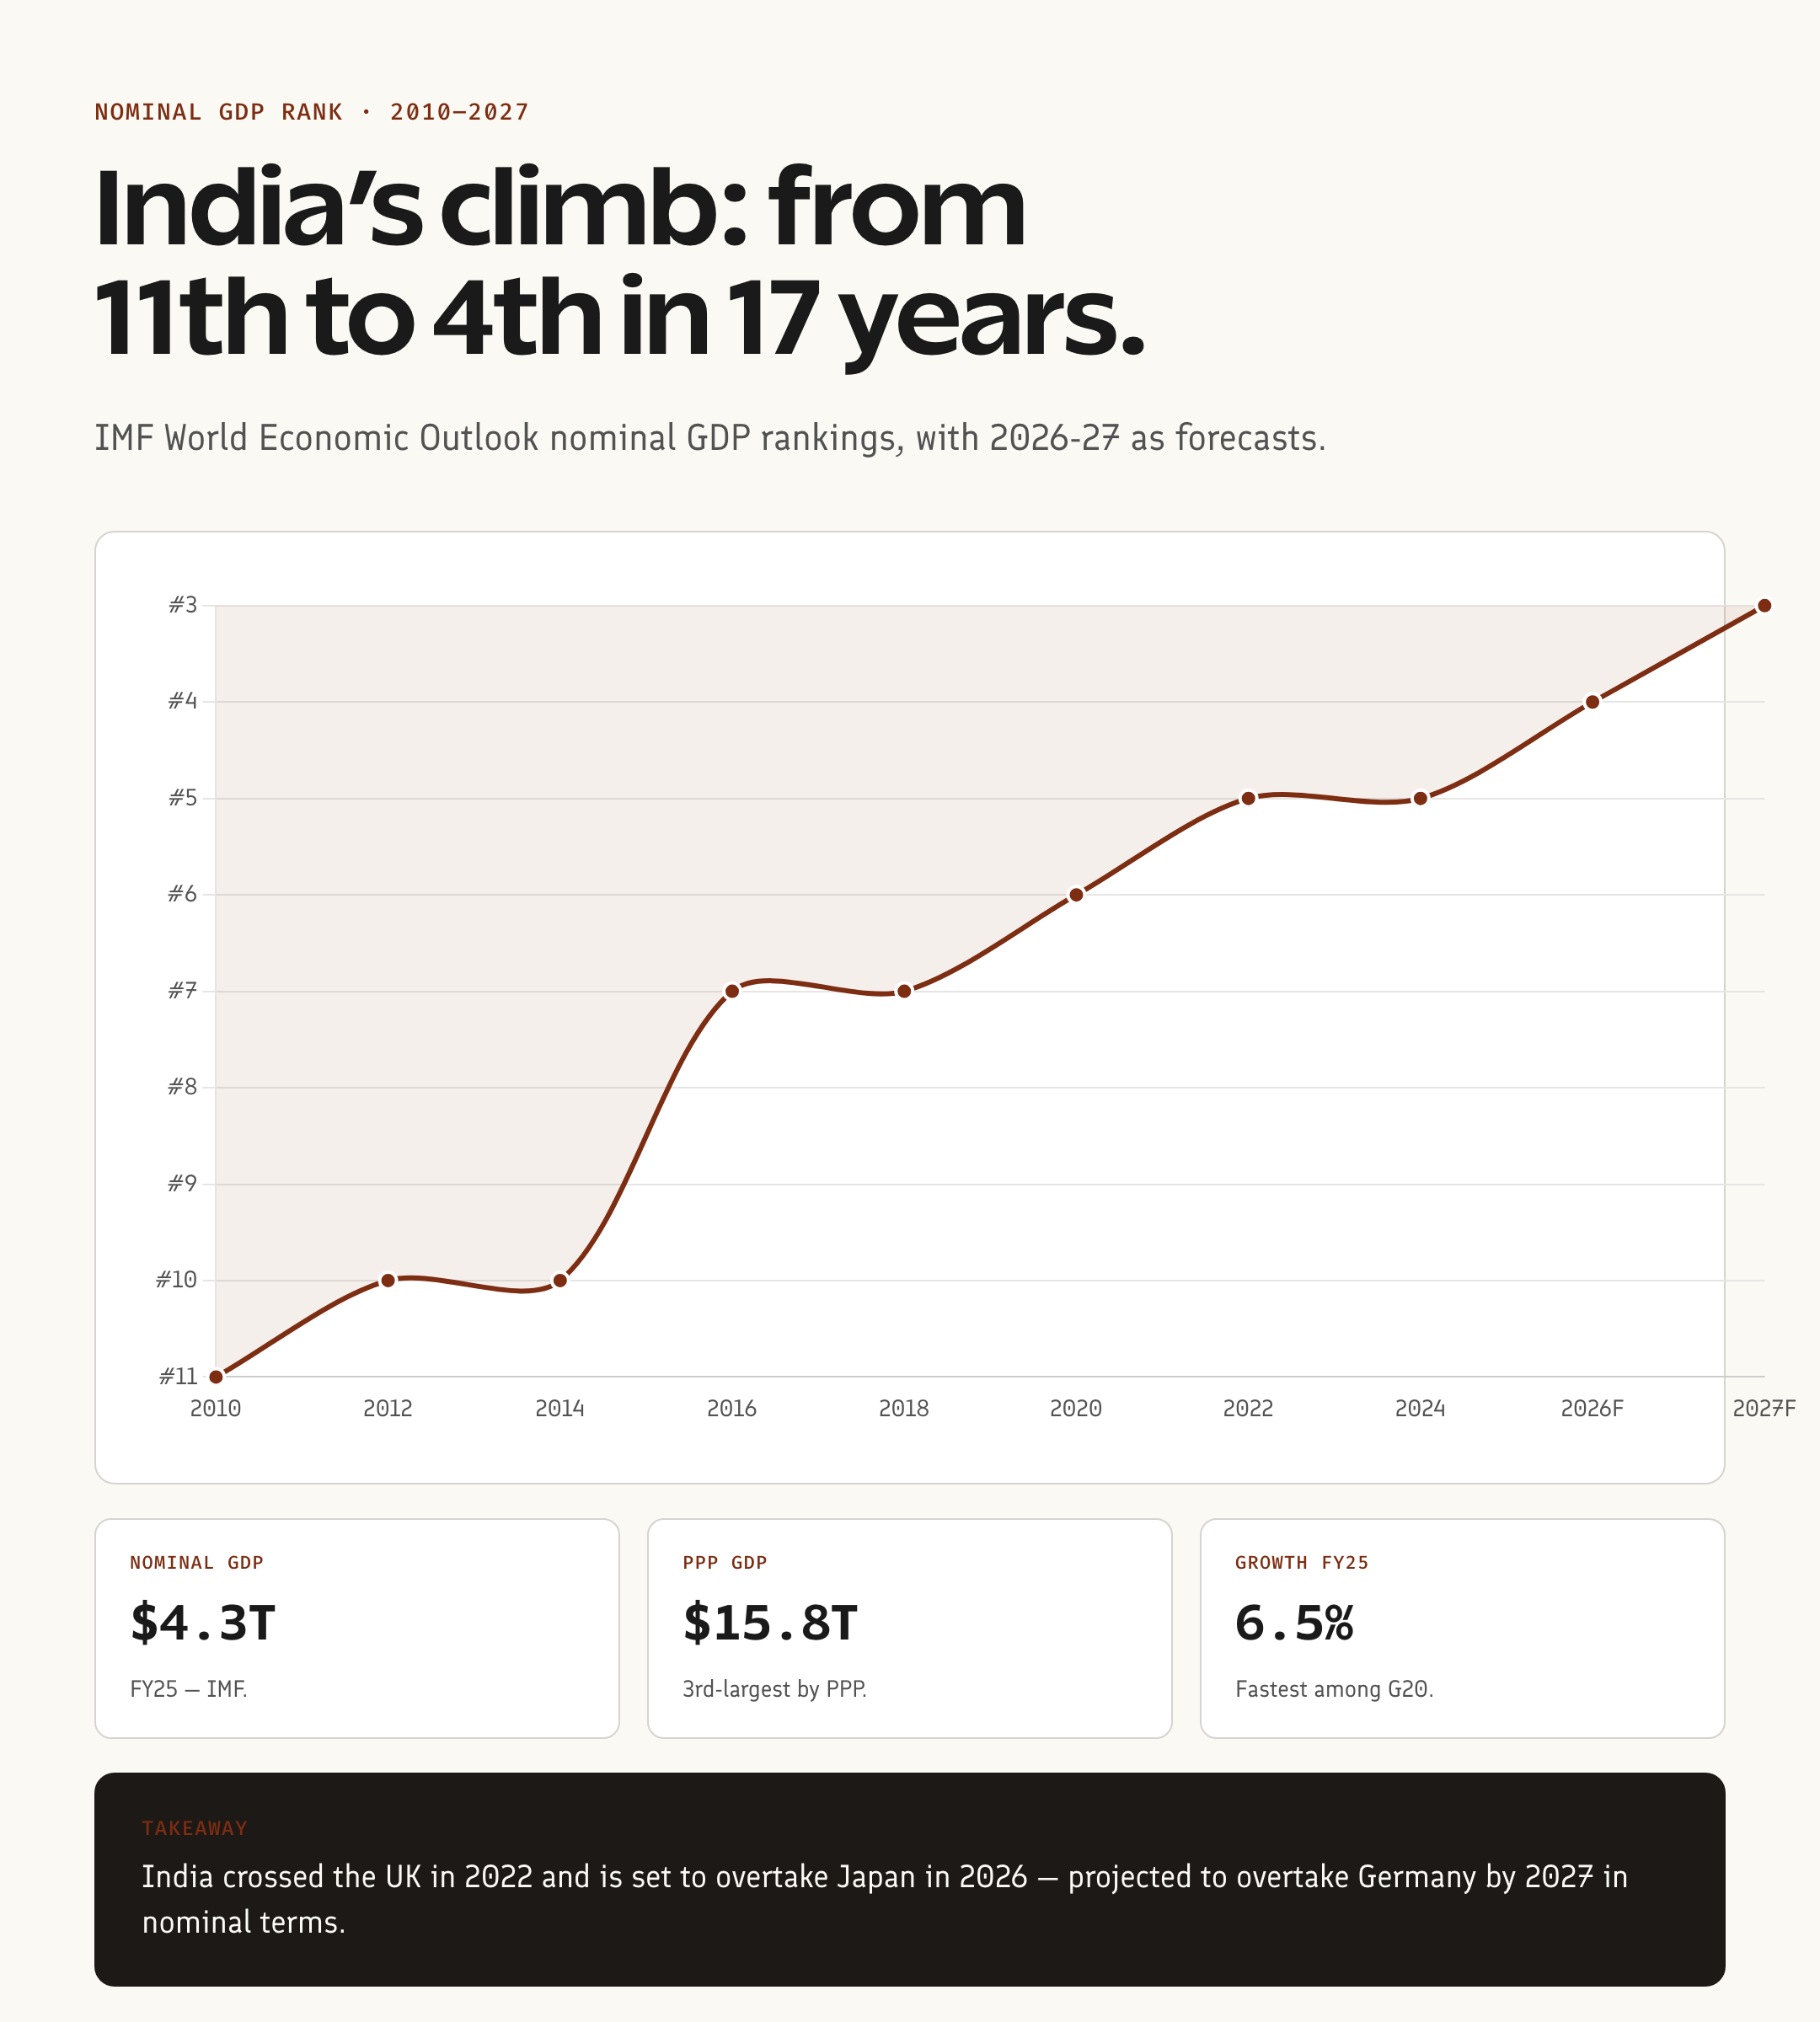
Yes. And that’s the part most coaching material hasn’t updated. In May 2025, IMF projections briefly placed India at 4th, ahead of Japan. But by April 2026, the IMF World Economic Outlook revised India to 6th — behind both Japan ($4.38 trillion) and the UK ($4.26 trillion).
The reason is simple, even if it’s awkward to explain. Look, the rupee depreciated approximately 11% against the dollar in FY 2025-26. Domestic GDP in rupee terms grew strongly… but when you convert to dollars at a weaker exchange rate, the headline number compresses.
This is exactly the trap that trips aspirants in interview boards. “India became the 4th-largest economy” was true for a window in 2025. By 2026, it slid back. The full chronology lives in How India Slid to the 6th Largest Economy — required reading before any interview.
Top 10 economies in the world by nominal GDP (2026)
| Rank | Country | Nominal GDP (USD trillion, 2026) |
|---|---|---|
| 1 | United States | ~$30.5 |
| 2 | China | ~$19.5 |
| 3 | Germany | ~$4.92 |
| 4 | Japan | ~$4.38 |
| 5 | United Kingdom | ~$4.26 |
| 6 | India | ~$4.15 |
| 7 | France | ~$3.31 |
| 8 | Italy | ~$2.55 |
| 9 | Canada | ~$2.42 |
| 10 | Brazil | ~$2.31 |
Source: IMF World Economic Outlook April 2026 database.
The gap between India and the UK is roughly $110 billion — a single quarter of decent rupee appreciation could flip the order again. This isn’t a settled ranking; it’s a moving target.
Top 10 economies by PPP (2026)
| Rank | Country | PPP GDP (USD trillion, 2026) |
|---|---|---|
| 1 | China | ~$43.5 |
| 2 | United States | ~$32.0 |
| 3 | India | ~$17.4 |
| 4 | Russia | ~$7.0 |
| 5 | Japan | ~$6.9 |
| 6 | Germany | ~$6.4 |
| 7 | Indonesia | ~$5.0 |
| 8 | Brazil | ~$4.8 |
| 9 | UK | ~$4.5 |
| 10 | France | ~$4.4 |
Why is India 3rd by PPP but 6th by nominal? Because the same ₹100 buys more food, transport, and services in India than $1 buys in the US. PPP adjusts for this. The Big Mac in Mumbai costs ₹220; in New York, $5.69. PPP recognises that.
For UPSC, both numbers matter. Prelims tests both. Mains rewards aspirants who can explain the difference in two clean sentences.
Nominal vs PPP — what every aspirant must know
This is the most-tested concept in the indian economy world ranking cluster. Get it right.
Nominal GDP = sum of all goods and services produced, valued at current market prices, converted to USD at the current exchange rate. Reflects market size in international trade terms.
PPP GDP = same goods and services, but valued at a common international price set (usually US prices for a basket). Reflects domestic purchasing power.
| Parameter | Nominal | PPP |
|---|---|---|
| What it measures | Market size in dollar terms | Real consumption / living standards |
| Exchange rate impact | Yes, directly | No, adjusted out |
| India’s rank | 6th | 3rd |
| Better for comparing | International trade, FDI | Standard of living, poverty |
| Volatility | High (currency-sensitive) | Low |
For more depth, see GDP of India 2026 and the dedicated India GDP Rank breakdown.
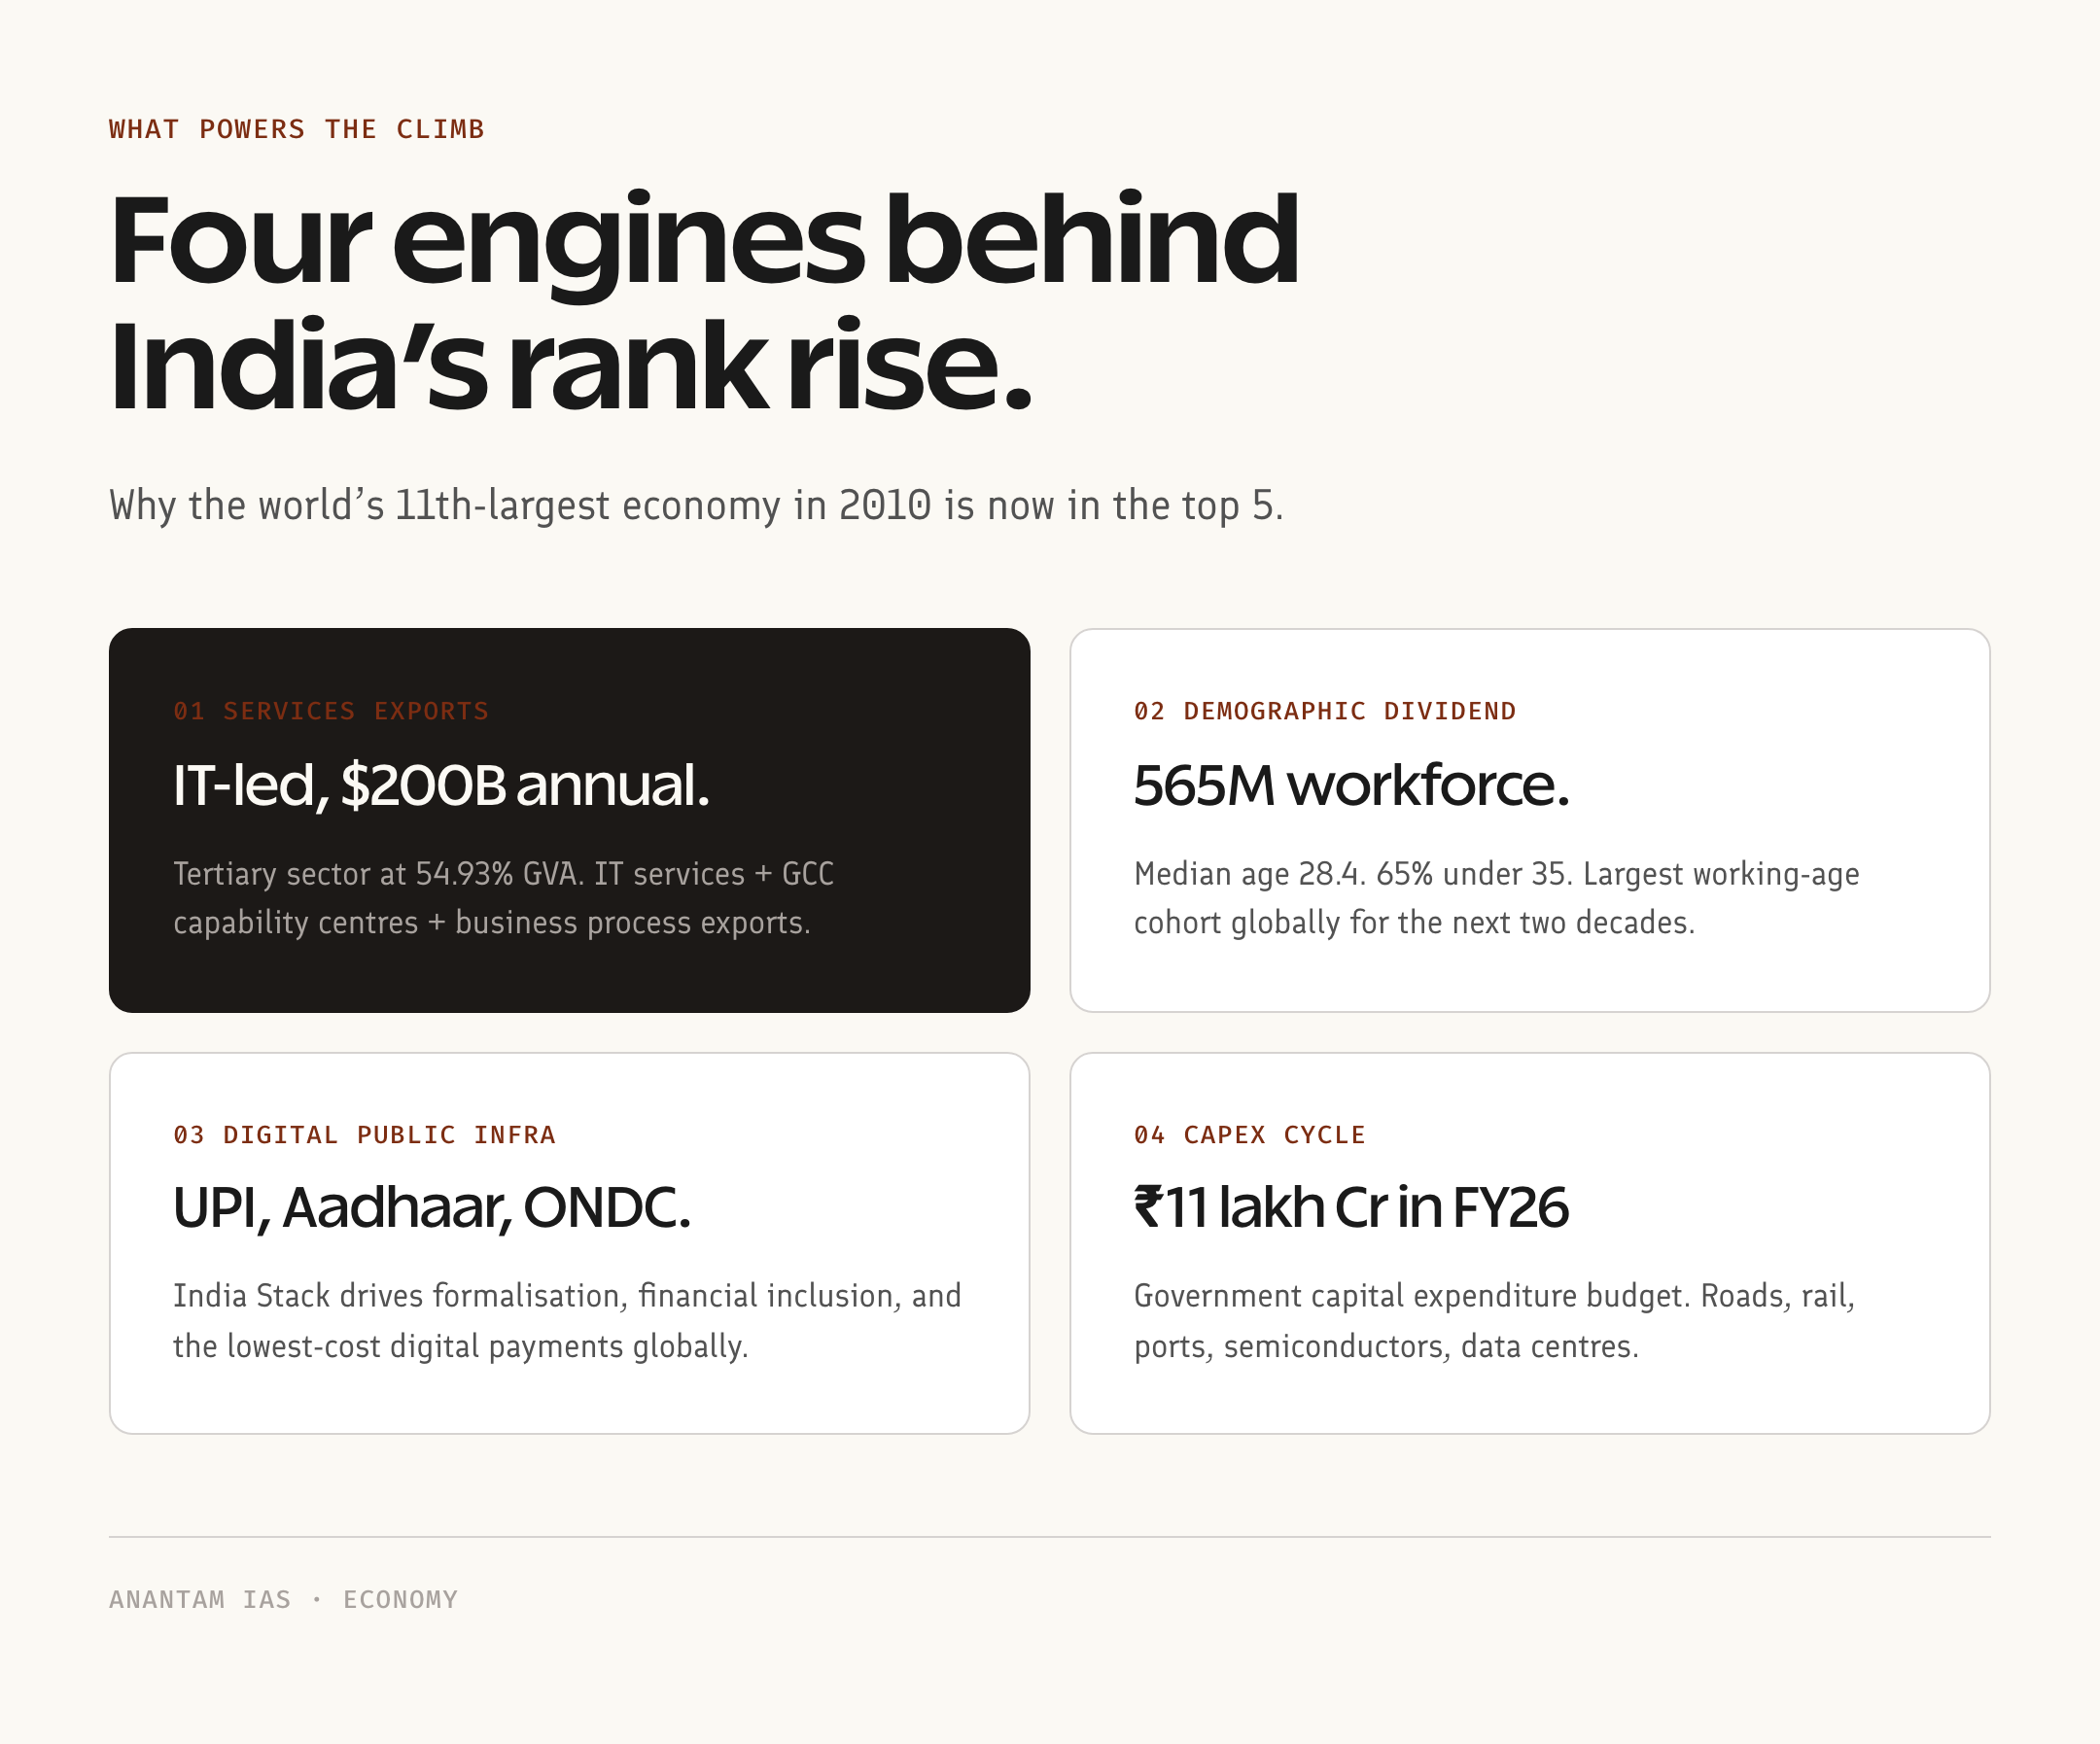
Historical journey — India’s climb up the ladder
Numbered, with sources.
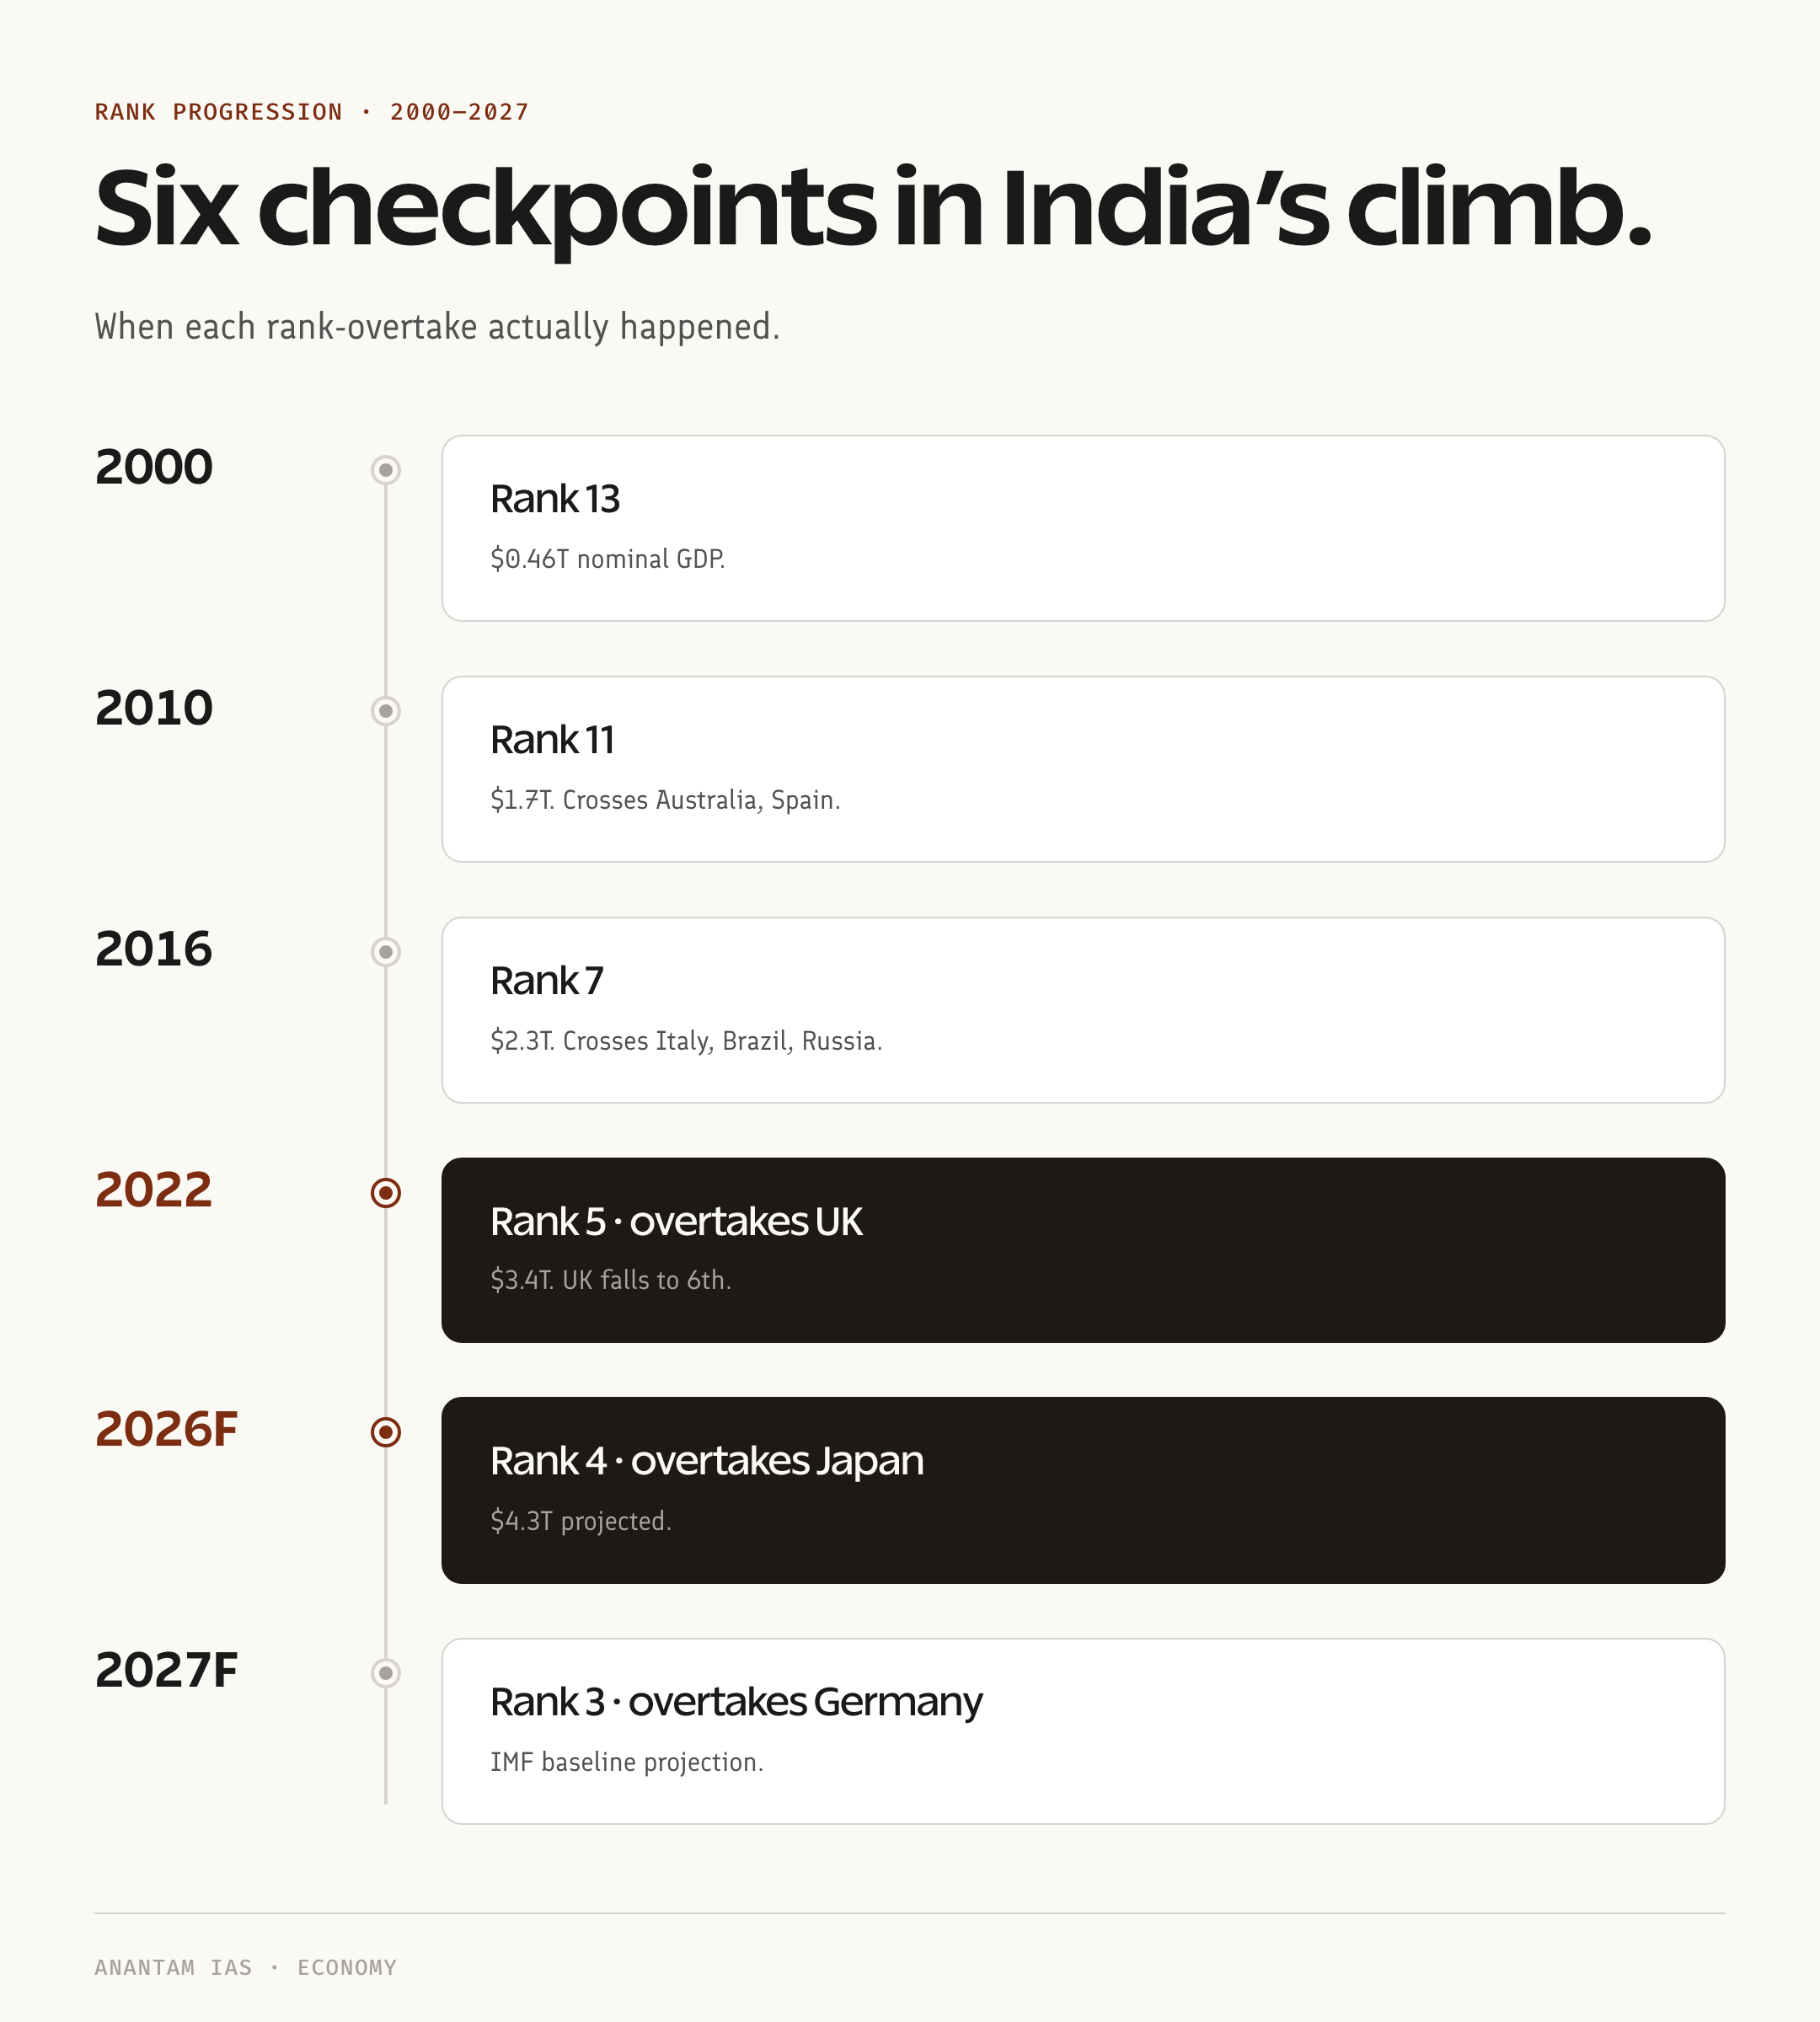
- 1991 — India ranked roughly 16th. Pre-liberalisation, balance-of-payments crisis. GDP was ~$270 billion.
- 2000 — climbed to ~13th. Post-1991 reforms started showing.
- 2010 — 10th globally. GDP crossed $1.7 trillion.
- 2014 — 9th. GDP ~$2 trillion. India overtook Italy.
- 2017 — 7th. India overtook France.
- 2019 — 5th. India overtook the UK briefly during a strong rupee phase.
- 2020 — slipped back to 6th due to COVID contraction (-7.3% real GDP).
- 2021-22 — recovered to 5th. India overtook the UK again. GDP $3.5 trillion.
- 2025 — briefly 4th, ahead of Japan in some IMF projections.
- 2026 (April) — 6th, IMF revised. UK and Japan moved ahead due to rupee depreciation.
- 2027-28 (projected) — IMF and CEA project India to become the 3rd-largest, surpassing Germany.
The trajectory is upward over a 35-year horizon, even with year-to-year zigzags. The rank of indian economy in world has improved by 10 places since 1991. That’s the long-arc story.
Sectoral structure of the Indian economy (2025-26)
The rank of indian economy in the world is one number; what’s underneath it matters more for Mains answers.
Sectoral GDP shares (FY 2024-25 PE, MoSPI):
- Tertiary (services) — 54.93% of GVA, 7.2% YoY growth
- Secondary (industry) — 25.33% of GVA, 6.1% YoY growth
- Primary (agriculture, mining) — 19.74% of GVA, 3.1% YoY growth
Employment shares (FY 2024-25, PLFS):
- Primary — ~45% of workforce (still highest, despite lowest GVA share)
- Secondary — ~24%
- Tertiary — ~31%
That mismatch — agriculture employs 45% but produces under 20% of GVA — is the structural problem India must solve to climb past 5th. For depth on the services pillar, see Services Sector Led Growth in India.
The $5 trillion economy target — where it stands
The original $5 trillion target was set by PM Modi in July 2019 for FY 2024-25. That timeline slipped. Here’s the current honest reading:
- Original target — $5 trillion by 2024-25 (announced 2019)
- Revised CEA position (May 2025) — $5 trillion by 2027-28
- Current FY 2025-26 GDP — $3.916 trillion (IMF April 2026)
- Required CAGR to hit $5T by 2027-28 — ~7-8% real growth + stable rupee
The arithmetic works if growth holds at 7%+ and the rupee doesn’t depreciate further. Both are non-trivial assumptions. As Economic Survey 2025-26 Volume 1 acknowledges, the global headwinds — oil prices, US tariff policy, China slowdown — make the path narrow.
Per capita GDP — the caveat aspirants must add
Total GDP rank says one thing. Per capita rank says another.
- India per capita nominal GDP (2026) — ~$2,800
- India per capita rank globally — ~140th out of 195 countries
- US per capita — ~$87,000 (≈31x India)
- China per capita — ~$13,500 (≈4.8x India)
- Bangladesh per capita — ~$2,650 (close to India)
Total economic size is impressive. Per-capita reality is sobering. Mains answers that mention only the rank without the per-capita caveat lose 1-2 marks. Examiners flag this exact omission.
Why this matters for UPSC
The ranking of indian economy in the world appears in:
- Prelims — direct numerical MCQs on rank, GDP value, top economies. 2024 Prelims asked the IMF/World Bank rank distinction.
- Mains GS-III — “Discuss the structural transformation of the Indian economy since 1991. How has India’s global rank changed?” — recurring framing.
- Essay — “From 10th to 5th: India’s economic ascent” type prompts in 2022 and 2024.
- Interview — almost guaranteed question. Don’t fumble the difference between nominal and PPP.
Examiners love this exact framing — they’ve asked nominal-vs-PPP questions in 2017, 2020, and 2024 Prelims.
Common misconceptions
Myth 1: “India is the 5th-largest economy.” Was true in 2022-23 and briefly in 2025. As of April 2026, India is 6th by nominal GDP. The data updates yearly — always cite the source month.
Myth 2: “India is the 3rd-largest economy.” Only by PPP, not nominal. Specify the metric.
Myth 3: “India is overtaking China.” Not in nominal or PPP terms. China’s GDP is ~$19.5T (nominal), nearly 5x India’s. The narrowing growth-rate gap doesn’t translate to rank parity for at least 30+ years.
Myth 4: “$5 trillion = developed nation status.” No. Per capita matters. Bangladesh and Vietnam aren’t “developed” despite respectable growth rates. The World Bank’s high-income threshold is per capita, not aggregate.
Myth 5: “Rank changes mean the economy shrunk.” No. India’s GDP grew in rupee terms; the rank slipped because the rupee depreciated relative to the yen and pound. Real economy expanded. Dollar conversion compressed.
How to revise this in 30 minutes
- 5 minutes — Memorise the 2026 nominal top-6 in order: USA, China, Germany, Japan, UK, India.
- 5 minutes — Memorise PPP top-3: China, USA, India.
- 5 minutes — Sectoral GDP shares: Tertiary 54.9%, Secondary 25.3%, Primary 19.7%.
- 5 minutes — Per capita rank ~140th and the 31x gap with the US.
- 5 minutes — $5 trillion target: 2027-28 (revised from 2024-25).
- 5 minutes — Quick scan of Second Advance Estimates of GDP 2025-26 for the FY26 7.4% growth figure.
Source priority: IMF World Economic Outlook (April 2026) → MoSPI press releases → Economic Survey 2025-26 Volume 1.
Frequently Asked Questions
: What is the rank of Indian economy in the world in 2026?
India is the 6th-largest economy by nominal GDP at $4.15 trillion (IMF April 2026 WEO) and the 3rd-largest by PPP at approximately $17.4 trillion. The top five by nominal are USA, China, Germany, Japan, and UK.
: Why is India ranked differently in nominal and PPP terms?
PPP adjusts for cost-of-living differences. Goods and services cost less in India than in the US, so the same dollar buys more in India. PPP captures real consumption power; nominal captures market size at current exchange rates.
: Will India become the 3rd-largest economy?
The Chief Economic Adviser projects India will become the 3rd-largest economy by 2027-28, surpassing Germany. This requires sustained 7%+ real growth and a stable rupee. The target is feasible but not automatic.
: What is India’s per capita GDP rank?
India’s per capita nominal GDP is around $2,800 in 2026, ranking approximately 140th globally out of 195 countries. Aggregate size and per-capita prosperity diverge sharply for India.
: How has India’s GDP rank changed since 1991?
India ranked 16th in 1991, climbed to 10th by 2010, 7th by 2017, 5th in 2019 and 2022, briefly 4th in 2025, and is currently 6th in April 2026. The 35-year arc is upward despite year-to-year volatility.
: What are the main sectors of the Indian economy?
The tertiary (services) sector contributes 54.9% of GVA, secondary (industry) 25.3%, and primary (agriculture and mining) 19.7% in FY 2024-25. Services dominate output; agriculture still employs ~45% of the workforce.
: How does rupee depreciation affect India’s GDP rank?
Domestic GDP measured in rupees can grow strongly while dollar-converted GDP stagnates or shrinks if the rupee weakens. The 11% rupee depreciation in FY26 is why India slipped from 4th (2025 projection) to 6th in April 2026 IMF data.
Tell Google you want more of this.
Add Anantam IAS as a preferred sourceOne tap, and this site shows up more often in your own Top Stories, AI Overviews and AI Mode. Remove it any time.